seaborn-analyzer: data visualization of regression, classification and distribution

Project description
seaborn-analyzer


A data analysis and visualization tool using Seaborn library.
Usage
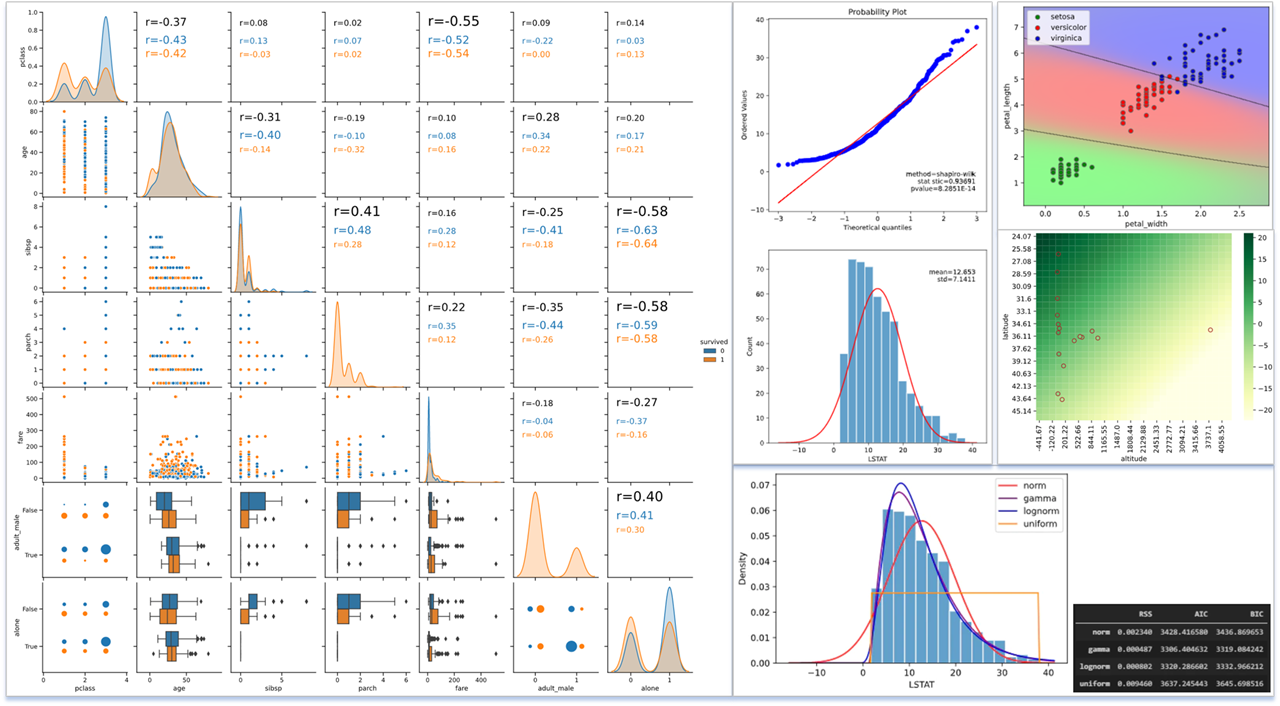
An example of using CustomPairPlot class
from seaborn_analyzer import CustomPairPlot
import seaborn as sns

titanic = sns.load_dataset("titanic")
cp = CustomPairPlot()
cp.pairanalyzer(titanic, hue='survived')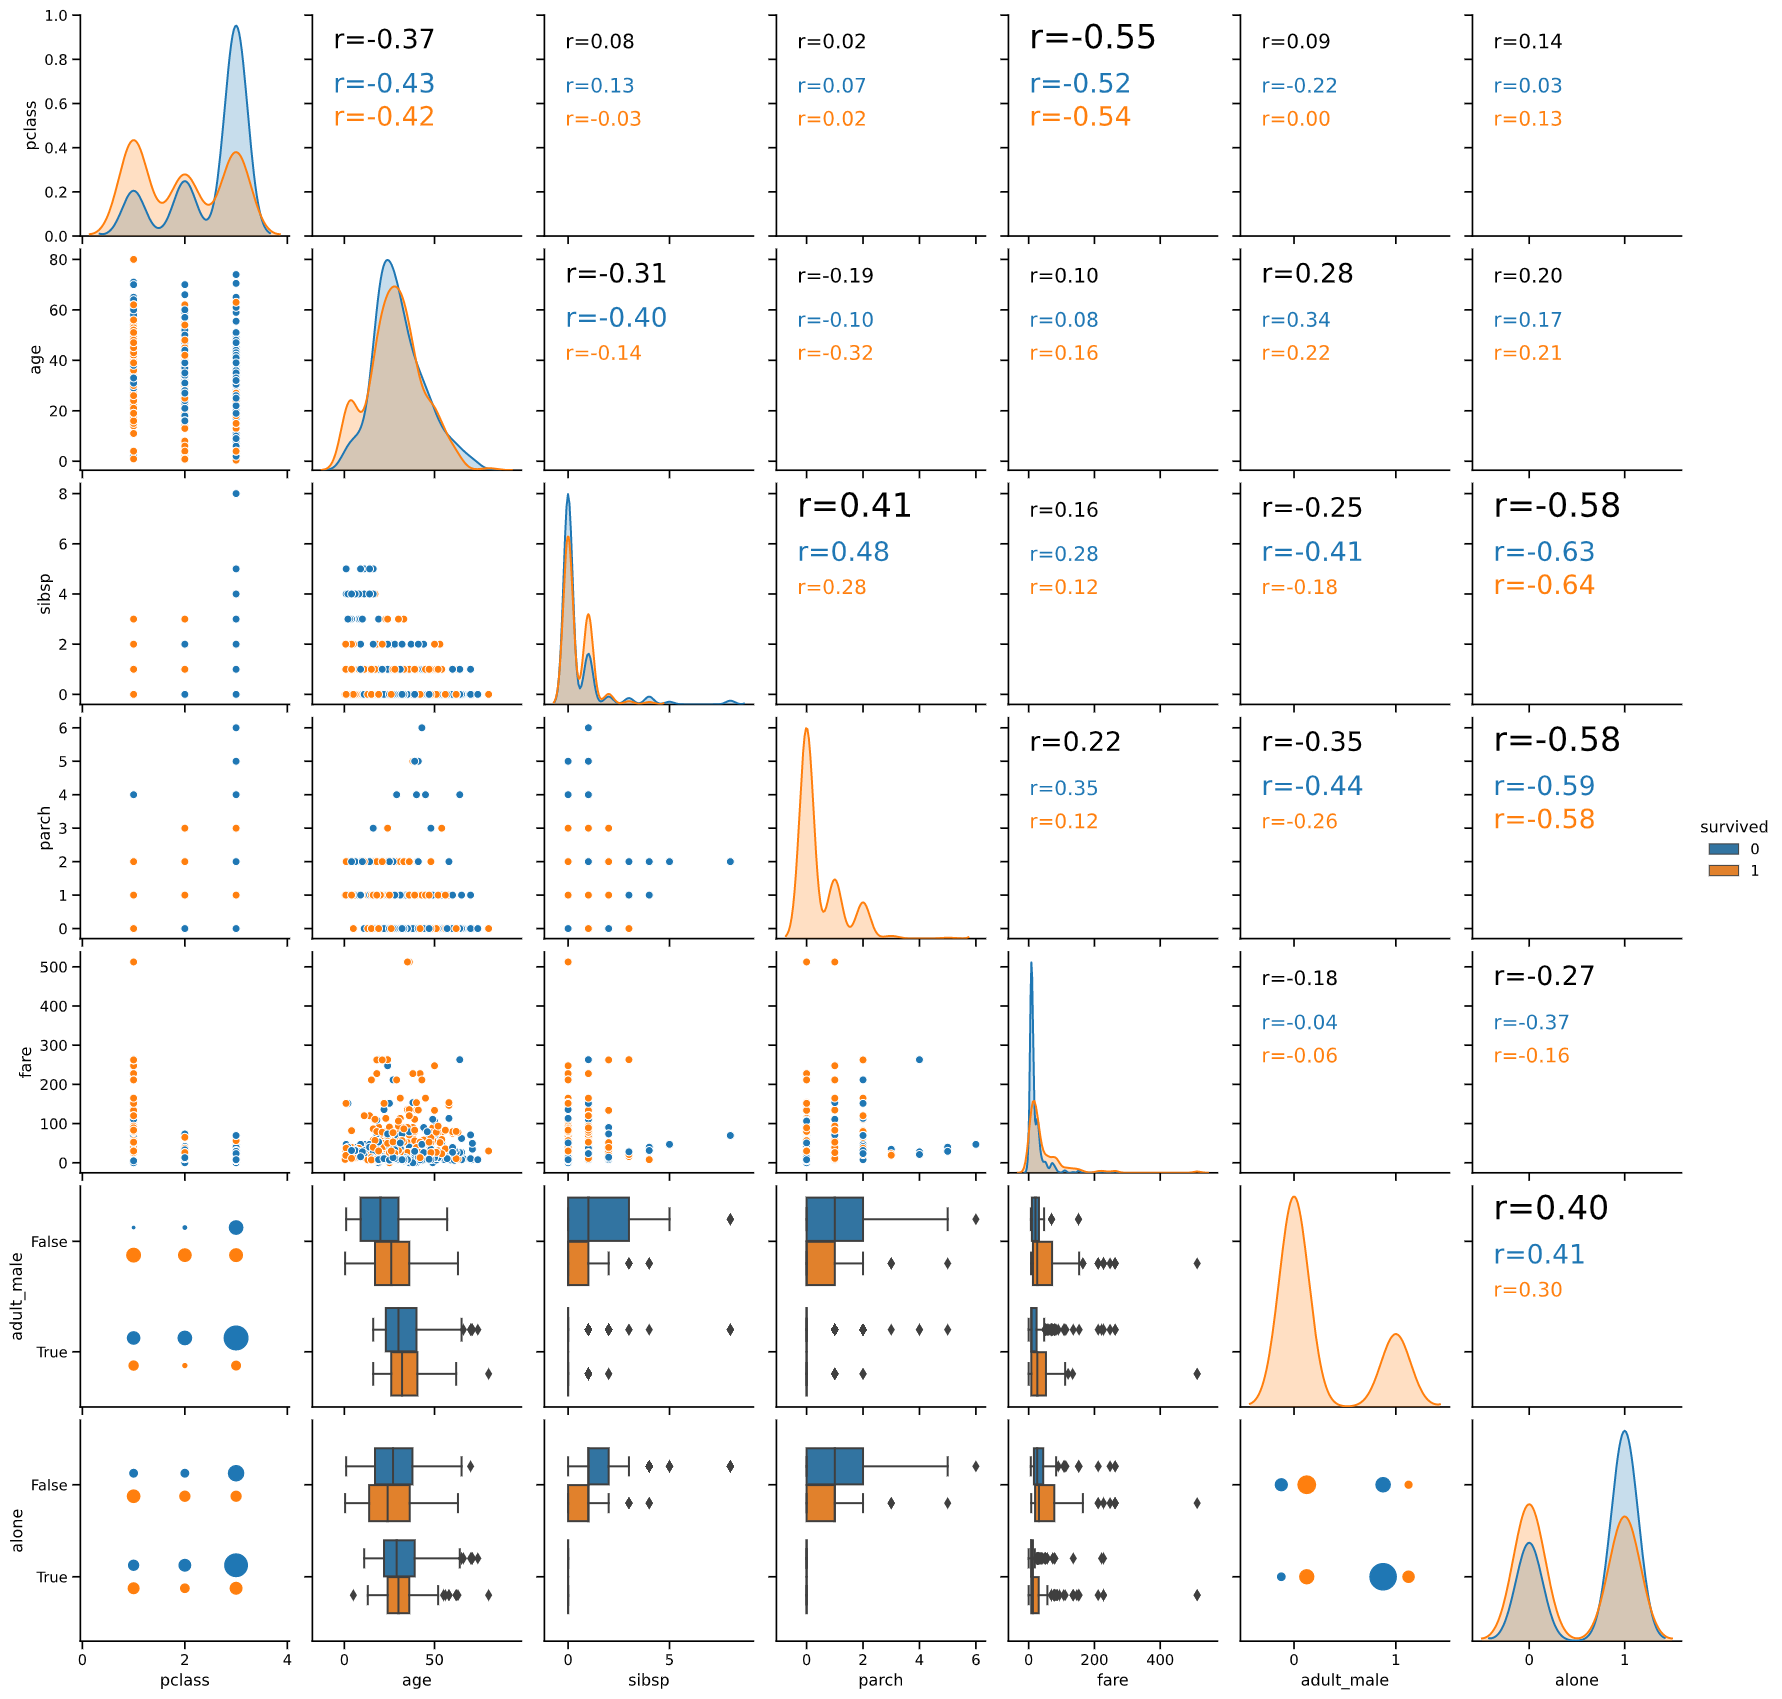
If you want to know the usage of the other classes, see API Reference and Examples
Requirements
seaborn-analyzer 0.3.6 requires
Python >=3.6
Numpy >=1.20.3
Pandas >=1.2.4
Matplotlib >=3.1.3
Seaborn >=0.11.1
Scipy >=1.6.3
Scikit-learn >=0.24.2
LightGBM >=3.3.2
Installing seaborn-analyzer
Use pip to install the binary wheels on PyPI
$ pip install seaborn-analyzerSupport
Bugs may be reported at https://github.com/c60evaporator/seaborn-analyzer/issues
API Reference
The following classes and methods are included in seaborn-analyzer
CustomPairPlot class
Method name |
Summary |
API Documentation |
Example |
|---|---|---|---|
pairanalyzer |
Plot pair plot including scatter plot and correlation coefficient matrix simultaneously. |
hist class
Method name |
Summary |
API Documentation |
Example |
|---|---|---|---|
plot_normality |
Plot normality test result and QQ plot. |
||
fit_dist |
Fit distributions by maximum likelihood estimation and calculate fitting scores. |
classplot class
Method name |
Summary |
API Documentation |
Example |
|---|---|---|---|
class_separator_plot |
Plot class separation lines of any scikit-learn classifier. |
||
class_proba_plot |
Plot class prediction probability of any scikit-learn classifier. |
||
plot_roc_curve_multiclass |
Plot ROC curve in multiclass classifier. |
||
roc_plot |
Plot ROC curve with cross validation. |
regplot class
Method name |
Summary |
API Documentation |
Example |
|---|---|---|---|
linear_plot |
Plot linear regression line and calculate Pearson correlation coefficient. |
||
regression_pred_true |
Plot prediction vs. true scatter plots of any scikit-learn regressor. |
||
regression_plot_1d |
Plot regression lines of any scikit-learn regressor with 1D explanatory variable. |
||
regression_heat_plot |
Plot regression heatmaps of any scikit-learn regressor with 2 to 4D explanatory variables. |
||
average_plot |
Plot relationship between one explanatory variable and predicted value by line graph. |
Examples
CustomPairPlot.pairanalyzer
from seaborn_analyzer import CustomPairPlot
import seaborn as sns
titanic = sns.load_dataset("titanic")
cp = CustomPairPlot()
cp.pairanalyzer(titanic, hue='survived')
hist.plot_normality
from seaborn_analyzer import hist
from sklearn.datasets import load_boston
import pandas as pd
df = pd.DataFrame(load_boston().data, columns= load_boston().feature_names)
hist.plot_normality(df, x='LSTAT', norm_hist=False, rounddigit=5)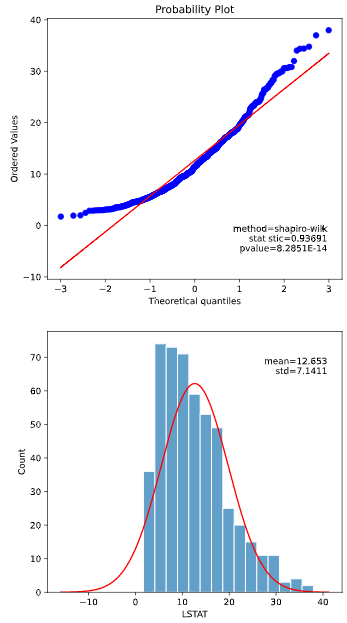
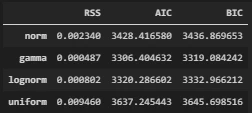
hist.fit_dist
from seaborn_analyzer import hist
from sklearn.datasets import load_boston
import pandas as pd
import matplotlib.pyplot as plt
from scipy import stats
df = pd.DataFrame(load_boston().data, columns= load_boston().feature_names)
all_params, all_scores = hist.fit_dist(df, x='LSTAT', dist=['norm', 'gamma', 'lognorm', 'uniform'])
df_scores = pd.DataFrame(all_scores).T
df_scores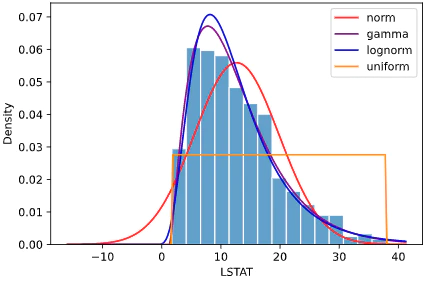
classplot.class_separator_plot
import seaborn as sns
from sklearn.svm import SVC
from seaborn_analyzer import classplot
iris = sns.load_dataset("iris")
clf = SVC()
classplot.class_separator_plot(clf, ['petal_width', 'petal_length'], 'species', iris)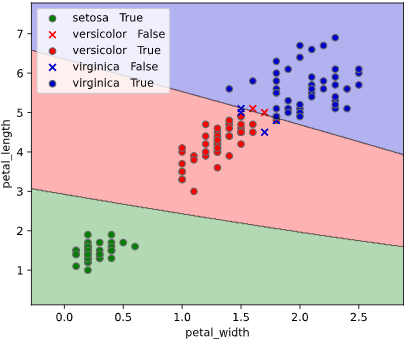
classplot.class_proba_plot
import seaborn as sns
from sklearn.svm import SVC
from seaborn_analyzer import classplot
iris = sns.load_dataset("iris")
clf = SVC()
classplot.class_proba_plot(clf, ['petal_width', 'petal_length'], 'species', iris,
                           proba_type='imshow')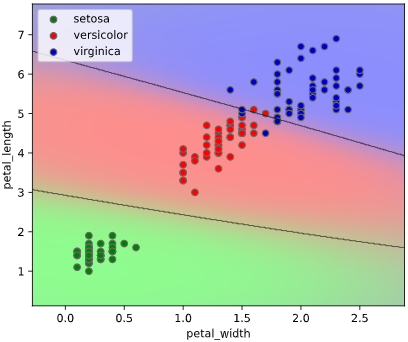
classplot.plot_roc_curve_multiclass
import seaborn as sns
from sklearn.svm import SVC
from sklearn.model_selection import train_test_split
import numpy as np
import matplotlib.pyplot as plt
from seaborn_analyzer import classplot
# Load dataset
iris = sns.load_dataset("iris")
OBJECTIVE_VARIALBLE = 'species'  # Objective variable
USE_EXPLANATORY = ['petal_width', 'petal_length', 'sepal_width', 'sepal_length']  # Explantory variables
y = iris[OBJECTIVE_VARIALBLE].values
X = iris[USE_EXPLANATORY].values
# Add random noise features
random_state = np.random.RandomState(0)
n_samples, n_features = X.shape
X = np.c_[X, random_state.randn(n_samples, 10 * n_features)]
# Plot ROC curve in multiclass classification
X_train, X_test, y_train, y_test = train_test_split(X, y, shuffle=True, random_state=42)
estimator = SVC(probability=True, random_state=42)
classplot.plot_roc_curve_multiclass(estimator, X_train, y_train,
                                    X_test=X_test, y_test=y_test)
plt.plot([0, 1], [0, 1], label='Chance', alpha=0.8,
        lw=2, color='red', linestyle='--')
plt.legend(loc='lower right')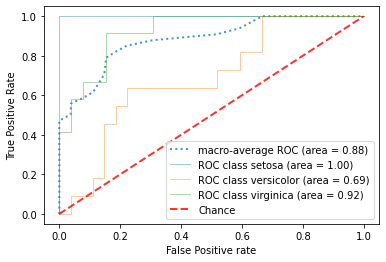
classplot.roc_plot
from lightgbm import LGBMClassifier
import seaborn as sns
import matplotlib.pyplot as plt
from seaborn_analyzer import classplot
# Load dataset
iris = sns.load_dataset("iris")
OBJECTIVE_VARIALBLE = 'species'  # Objective variable
USE_EXPLANATORY = ['petal_width', 'petal_length', 'sepal_width', 'sepal_length']  # Explantory variables
y = iris[OBJECTIVE_VARIALBLE].values
X = iris[USE_EXPLANATORY].values
fit_params = {'verbose': 0,
            'early_stopping_rounds': 10,
            'eval_metric': 'rmse',
            'eval_set': [(X, y)]
            }
# Plot ROC curve with cross validation in multiclass classification
estimator = LGBMClassifier(random_state=42, n_estimators=10000)
fig, axes = plt.subplots(4, 1, figsize=(6, 24))
classplot.roc_plot(estimator, X, y, ax=axes, cv=3, fit_params=fit_params)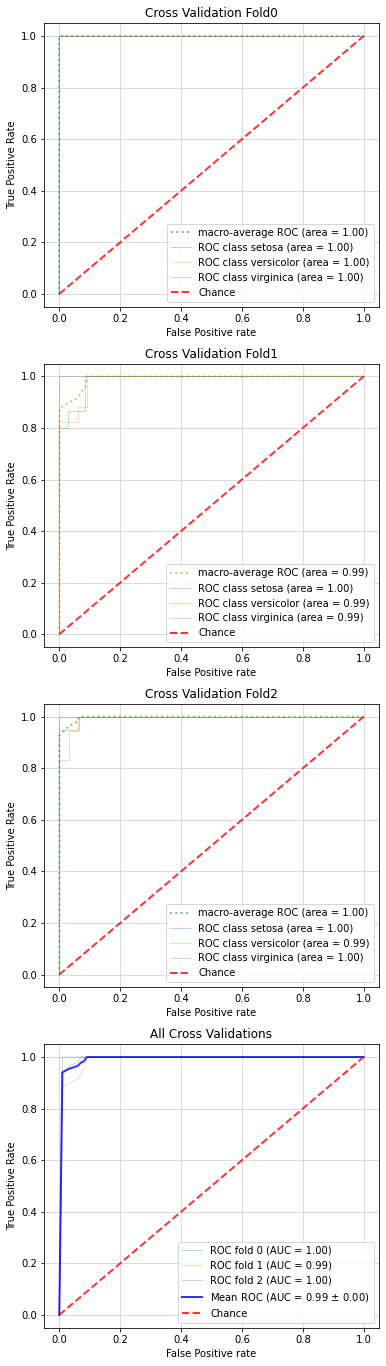
regplot.linear_plot
from seaborn_analyzer import regplot
import seaborn as sns
iris = sns.load_dataset("iris")
regplot.linear_plot(x='petal_length', y='sepal_length', data=iris)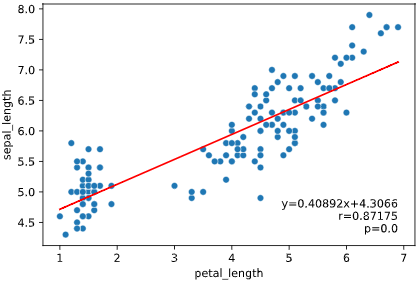
regplot.regression_pred_true
import pandas as pd
from seaborn_analyzer import regplot
import seaborn as sns
from sklearn.linear_model import LinearRegression
df_temp = pd.read_csv(f'./sample_data/temp_pressure.csv')
regplot.regression_pred_true(LinearRegression(), x=['altitude', 'latitude'], y='temperature', data=df_temp)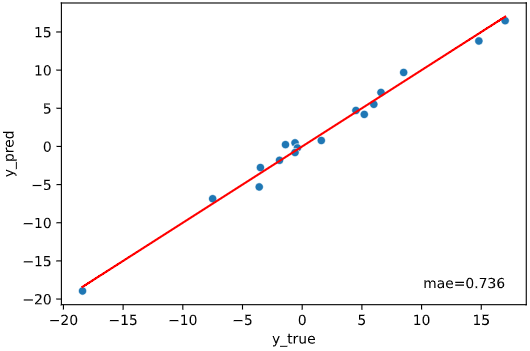
regplot.regression_plot_1d
from seaborn_analyzer import regplot
import seaborn as sns
from sklearn.svm import SVR
iris = sns.load_dataset("iris")
regplot.regression_plot_1d(SVR(), x='petal_length', y='sepal_length', data=iris)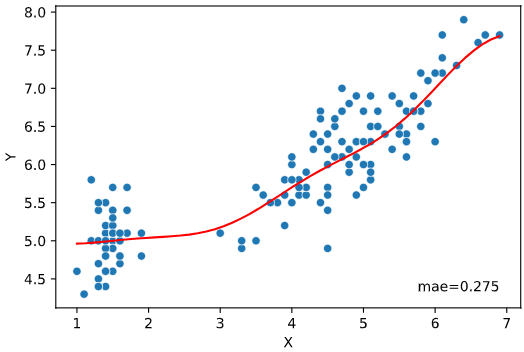
regplot.regression_heat_plot
import pandas as pd
from sklearn.linear_model import LinearRegression
from seaborn_analyzer import regplot
df_temp = pd.read_csv(f'./sample_data/temp_pressure.csv')
regplot.regression_heat_plot(LinearRegression(), x=['altitude', 'latitude'], y='temperature', data=df_temp)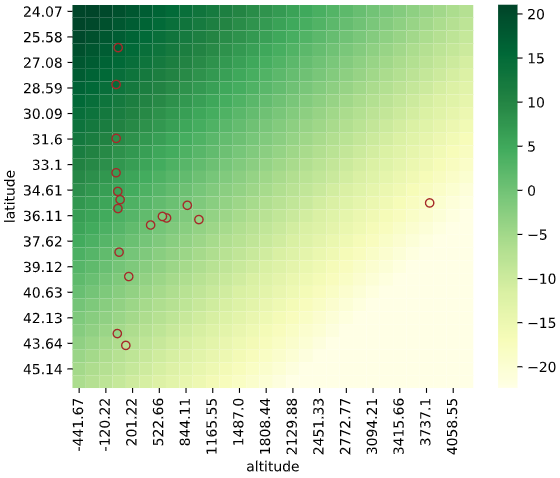
regplot.average_plot
import seaborn as sns
from sklearn.svm import SVR
from seaborn_analyzer import regplot
iris = sns.load_dataset("iris")
svr = SVR()
features = ['petal_width', 'petal_length', 'sepal_width']
X = iris[features].values
y = iris['sepal_length'].values
regplot.average_plot(svr, X, y, x_colnames=features, cv=3)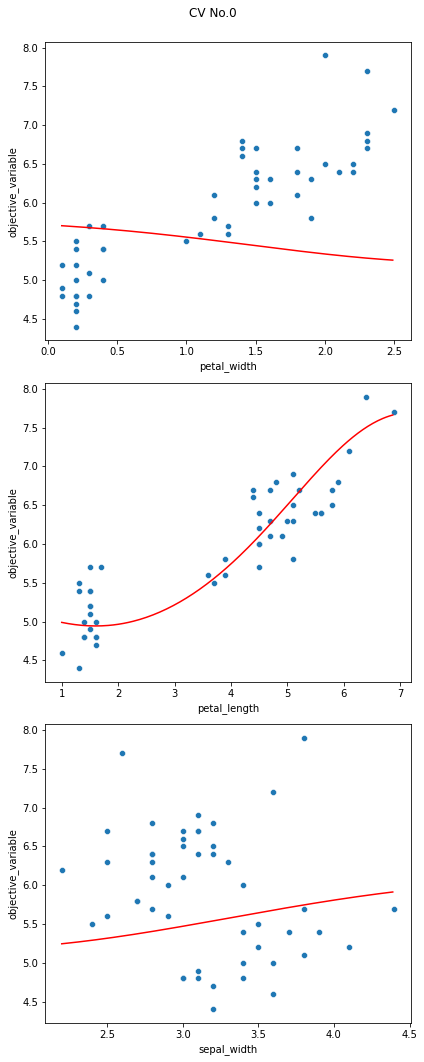
Contact
If you have any questions or comments about seaborn-analyzer, please feel free to contact me via eMail: c60evaporator@gmail.com or Twitter: https://twitter.com/c60evaporator This project is hosted at https://github.com/c60evaporator/seaborn-analyzer
Release history Release notifications | RSS feed


Download files
Download the file for your platform. If you're not sure which to choose, learn more about installing packages.
Source Distribution
Built Distribution
Filter files by name, interpreter, ABI, and platform.
If you're not sure about the file name format, learn more about wheel file names.
Copy a direct link to the current filters
File details
Details for the file seaborn-analyzer-0.3.6.tar.gz.
File metadata
- Download URL: seaborn-analyzer-0.3.6.tar.gz
- Upload date:
- Size: 71.0 kB
- Tags: Source
- Uploaded using Trusted Publishing? No
- Uploaded via: twine/4.0.2 CPython/3.11.7
File hashes
| Algorithm | Hash digest | |
|---|---|---|
| SHA256 |
5e379cd04ba5b9907d7c8551c5513337e76ff5c5fbad3c00dae4b9932eceee09
|
|
| MD5 |
11c5129b80f2ddb1832b6ff173a05ae9
|
|
| BLAKE2b-256 |
25b40eeb3f9e73338c46c06dcf6714308bb22c39475d3d349e47a2f3265c1736
|
File details
Details for the file seaborn_analyzer-0.3.6-py3-none-any.whl.
File metadata
- Download URL: seaborn_analyzer-0.3.6-py3-none-any.whl
- Upload date:
- Size: 69.6 kB
- Tags: Python 3
- Uploaded using Trusted Publishing? No
- Uploaded via: twine/4.0.2 CPython/3.11.7
File hashes
| Algorithm | Hash digest | |
|---|---|---|
| SHA256 |
a248bd0cbee2a8b8986d34401415570de906bb5cf949ee3363051566d45ae784
|
|
| MD5 |
ae833e6dfa9718edc3e2cf39d53736ef
|
|
| BLAKE2b-256 |
493938cbc12334209058da85da54bc49633241d595a3feb7f10e2b400650da63
|


