
Seam
Debug Python and C, C++ or Rust together on Linux x86-64, including WSL.
Python debuggers cannot see into native code, and native debuggers show CPython's internals instead of Python lines. Seam is one debugger that understands both sides:
- breakpoints in
.pyfiles and in.c/.cpp/.rs/.pyxfiles, in one session; - one call stack with Python and native frames interleaved in their true order;
- stepping from a Python line into the native function it calls, and back out;
- Python and native variables, each in their own frames;
- the Debug Adapter Protocol, so it works in VS Code and Neovim.
Seam 0.1.0 supports VS Code and Neovim. Read Limitations before relying on it; STATUS.md records the tested scope.
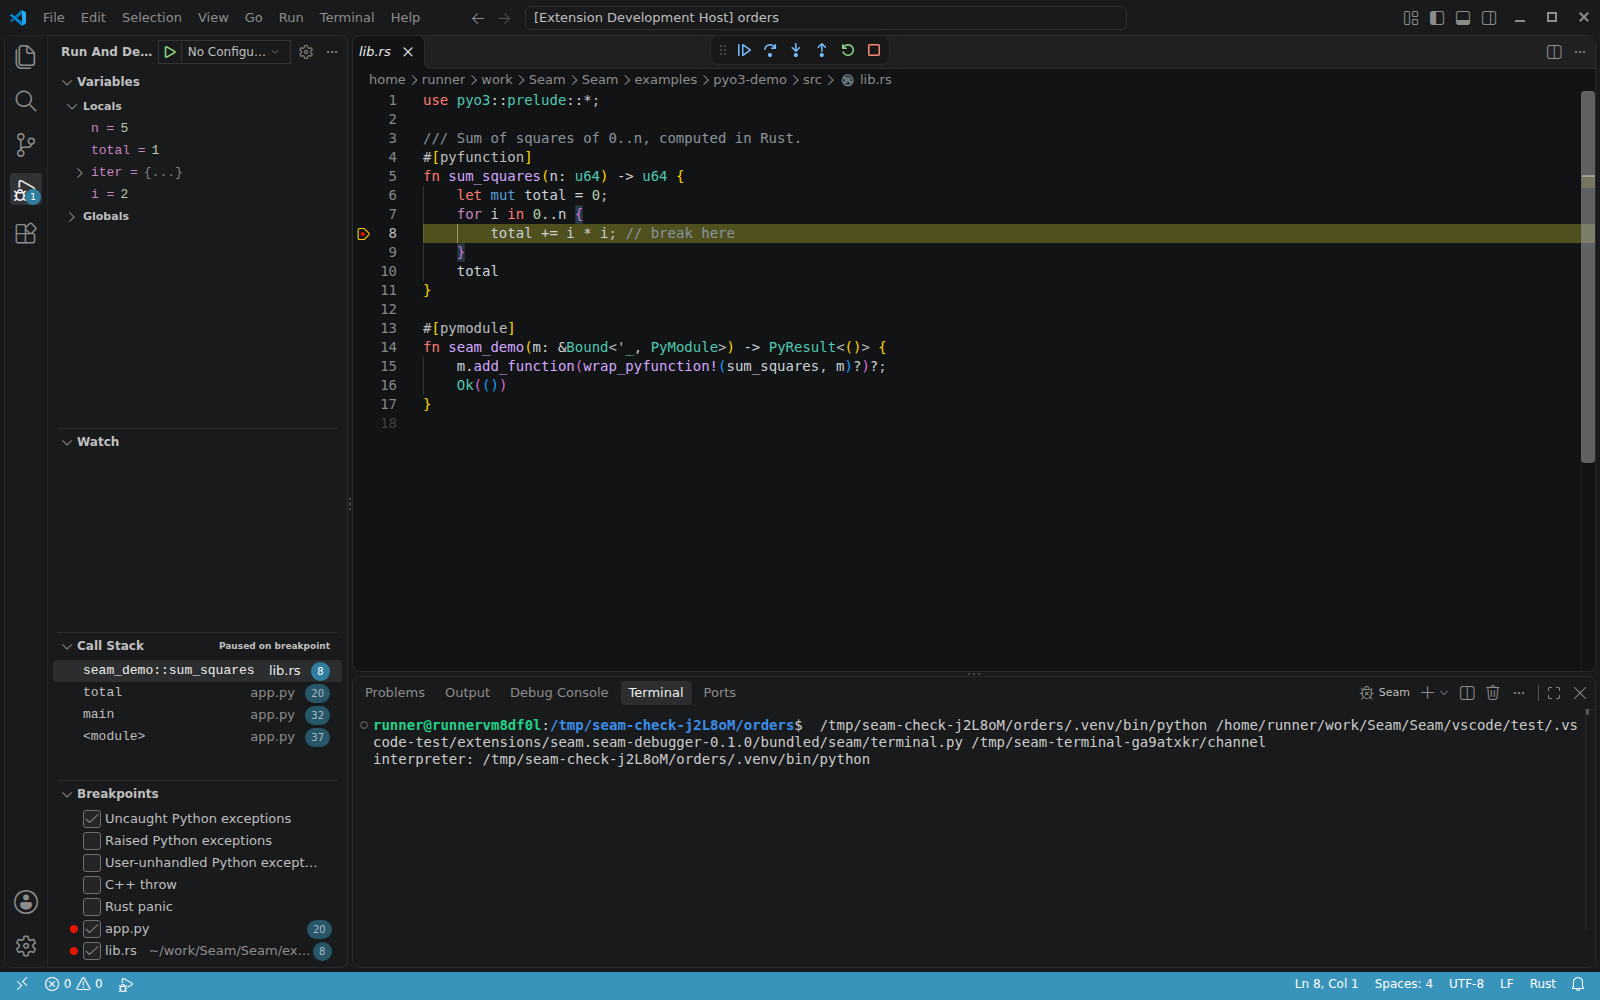
At a Rust breakpoint, inspect Rust locals and select the Python callers below it. This is an actual VS Code session from the packaged-extension acceptance tests.
Requirements
- Linux x86-64 with glibc; Windows users run Seam inside WSL on Linux x86-64.
- CPython 3.12, 3.13 or 3.14 as the program being debugged; 3.15 works as of its release
candidate (3.15.0rc3). Interpreters without debug info (uv-managed Pythons,
-slimcontainer images) and virtual environments are supported. - LLDB 18, 19 or 20, with its Python scripting support (the normal distro package). For
new installations, prefer LLDB 19 or 20: LLDB 18 can lose sessions when threaded
programs start child processes (see Limitations). Seam looks for
lldb-20, thenlldb-19, before plainlldb. An explicitSEAM_LLDBalways wins. - The published Linux x86-64 wheel and VS Code extension include the compiled helper; neither needs a compiler to install. Building from source needs a C compiler and the CPython headers. Building your own native extension still needs its toolchain.
- Permission to
ptracethe program (the default when Seam launches it).
Install
VS Code users need LLDB and the extension, which contains Seam itself. In a Linux or WSL terminal on Ubuntu 24.04:
sudo apt-get update
sudo apt-get install -y lldb-19
Download seam-debugger-linux-x64-0.1.0.vsix from the
0.1.0 release.
In VS Code, run Extensions: Install from VSIX… and select that file. On Windows,
first open your project in a WSL window and install the extension into WSL.
Then follow Quick start.
For Neovim, other DAP clients and the command line, on Ubuntu 24.04:
sudo apt-get update
sudo apt-get install -y lldb-19 python3-venv
python3 -m venv ~/.venvs/seam
~/.venvs/seam/bin/pip install --only-binary=:all: seam-debugger==0.1.0
~/.venvs/seam/bin/seam --version
This command uses PyPI. If the package is
not available there yet, download the .whl from the
GitHub release and install
that file with ~/.venvs/seam/bin/pip install /path/to/downloaded.whl.
LLDB is a separate system dependency; pip does not install it.
Seam itself can live in any Python 3.12+ environment; it does not have to be the
environment of the program you debug. Put ~/.venvs/seam/bin on PATH, or use the full
path to seam in the editor configuration below.
Check the installation, naming the interpreter you will debug with:
~/.venvs/seam/bin/seam doctor --python python3
It checks LLDB and its Python support, the helper, the ptrace setting and the interpreter, says how to fix anything that is wrong, and ends by running a short debug session for real. If something does not work later, its output is the first thing to look at.
Quick start
Suppose demo.py calls a function from your extension module:
import mymodule

def main():
    total = mymodule.add(20, 22)
    print(total)

main()
Build the extension with debug info (-g; for Rust, a debug build or
[profile.release] debug = true).
VS Code. The extension contains Seam itself; nothing else has to be installed except
LLDB (sudo apt-get install -y lldb-19). After installing the extension,
run Seam: Check This Machine from the Command Palette. Open your project and a
Python file, set a breakpoint on a native call and press F5. Step Into enters the
native function; Step Out returns to Python. No launch.json is required.
Seam debugs with the project's interpreter: the one selected in the Python extension if
that is installed, else the python.defaultInterpreterPath setting, else .venv or
venv in the workspace folder, else python3. A launch.json entry is optional:
{
  "type": "seam",
  "request": "launch",
  "name": "Seam: demo",
  "program": "${workspaceFolder}/demo.py"
}
The command Seam: Check This Machine (Command Palette) runs seam doctor for the
project's interpreter, if the first session does not start.
Set a breakpoint on the total = ... line, start the session, and use Step Into: the
debugger stops inside your native add, with main and <module> below it in the same
call stack. Step Out returns to the Python line.
Neovim. See the nvim-dap configuration.
Any DAP client. The adapter is seam dap, speaking DAP on stdin/stdout.
Launch options
| Option | Meaning |
|---|---|
program / module |
Script to run, or module to run with -m. |
args |
Arguments for the program. |
python |
Interpreter to run. In VS Code the default is the project's interpreter (see above); for other clients it is python3. |
pythonArgs |
Arguments for the interpreter itself. |
cwd, env |
Working directory and extra environment variables. |
console |
integratedTerminal or externalTerminal: run the program in the editor's terminal, where it can read input. internalConsole: show its output in the debug console; its input is empty. The VS Code extension defaults to integratedTerminal; the adapter itself, for other clients, to internalConsole. |
stopOnEntry |
Stop on the first line of Python. |
stopOnSignals |
Signals that stop the debugger (default SIGSEGV, SIGBUS, SIGILL, SIGFPE, SIGABRT). Every other signal goes straight to the program. Also valid for attach. |
justMyCode |
Steps and the "Raised Python exceptions" breakpoint keep to your own code: Python files of the standard library and of installed packages are not stepped into (default true). |
sourceMap |
Where the sources of native code are on this machine, when the debug info names another place (built in a container, in CI, in another directory, or with -fdebug-prefix-map / --remap-path-prefix). Pairs of path prefixes, debug info first: {"/io": "${workspaceFolder}"}, or lldb-dap's form [["/io", "${workspaceFolder}"]]. Use "." for relative paths in the debug info. Also valid for attach. |
debugInfoLookup |
Let LLDB find locally installed separate debug-info files (default true). Seam disables automatic network symbol downloads, so startup does not wait for a symbol server. Set false to skip local separate files too; embedded native debug information still works. |
frameworkPaths |
Extra path fragments marking native source as glue to step through. |
showGlueFrames |
Show binding-layer trampoline frames in the call stack (default false). |
To debug a test run, launch pytest as a module:
{
  "type": "seam", "request": "launch", "name": "Seam: pytest",
  "module": "pytest", "args": ["-q", "tests/test_thing.py"]
}
To stop where a test fails, switch on "User-unhandled Python exceptions" in the exception-breakpoint list: pytest catches the failure itself, so "Uncaught Python exceptions" does not fire.
Attach
{ "type": "seam", "request": "attach", "name": "Seam: attach", "pid": "${command:seam.pickProcess}" }
In VS Code ${command:seam.pickProcess} shows your running Python processes to choose
from. pid can also be a number.
Attaching needs ptrace permission for a non-child process
(/proc/sys/kernel/yama/ptrace_scope must be 0, or the program must allow it). See
Limitations for what attach can and cannot do on each Python version.
Breakpoints
Conditions, hit counts and log messages work on both sides of the boundary.
-
Condition: a Python expression on a Python line; a C, C++ or Rust expression (evaluated by LLDB) on a native line.
-
Hit count:
5or==5stops on the fifth hit only;>=5,>5,<5and<=5mean what they say;%5stops on every fifth hit. With a condition as well, only hits where the condition holds are counted. -
Log message: the breakpoint prints the message to the debug console instead of stopping. Text in braces is evaluated:
total is {total}. -
Function breakpoint: a function name, Python or native. For Python the bare name (
compute), the qualified name (Point.__init__) or the module-qualified one (mypackage.geometry.Point.__init__) all work. -
Data breakpoint: stop when a native variable changes ("Break on Value Change" in the Variables view). Works for variables of 1, 2, 4 or 8 bytes that live in memory; a native frame's Globals scope lists the statics of its file. Not available for Python variables. A watch on a local variable is removed when a later access finds that its function has returned, so reusing its stack slot does not stop the program.
A condition which cannot be evaluated is reported once in the debug console; the breakpoint then behaves as if the condition were true. Native breakpoints also show the error in their message. When a library built without debug info loads, the console says why Step Into cannot enter its functions and its source breakpoints cannot bind.
A native breakpoint on a line the compiler left without code (optimised builds) is either reported as unverified or moved by LLDB to the next line that has code, which can be in the next function; the editor shows where it ended up.
Native code built somewhere else
If an extension was built in a container, in CI or with remapped paths, its debug info names source files that are not on your disk: breakpoints you set in your copy stay grey, and stops in that code have no source. Tell Seam where the files are:
"sourceMap": { "/io": "${workspaceFolder}" }
Each entry maps a path prefix in the debug info to a directory on this machine. Several
entries are tried in order, and the first one under which the file exists is used. Use
"." as the prefix when the debug info has relative paths (-ffile-prefix-map=$PWD=.).
When a breakpoint cannot bind for this reason, or Seam stops in your native code and
cannot find its source, the debug console names the path in the debug info and, where it
can, the exact entry to add. readelf --debug-dump=info lib.so | grep -m3 DW_AT_name
shows the paths a library was built with.
A project opened through a symbolic link needs no setting: Seam reports files under the path your editor uses.
Stepping through async code, generators and libraries
- Step over an
awaitends on the next line of the same coroutine, however long it is suspended and whatever other tasks run meanwhile. Step in atawait other()lands on the first line ofother; step out runs a coroutine until it returns and stops in the coroutine that awaited it. - When a coroutine that runs as a task finishes (
asyncio.create_task,gather, the coroutine given toasyncio.run), nothing of yours called it. The step ends at the next line of your code that runs: another task, the coroutine that was waiting for this one, or the line that calledasyncio.run. - A breakpoint in another task still stops while a step is waiting, and ends the step.
- Generators behave as in pdb: stepping over a
yieldends on the generator's next line, when its consumer asks for the next value (the consumer's loop body runs without stopping); step out runs the generator to its end. Step in at ayieldfollows the value to the consumer instead. justMyCode(defaulttrue): a step never ends in a Python file of the standard library or of an installed package. Step in onsorted(items, key=f), on awithblock made withcontextlib, or on a library call that takes a callback lands in your function. When your function returns into a library (a callback called in a loop, a test run by pytest), the step ends where your code runs next. Breakpoints you set in library files still stop; a step from there returns to your code. Set"justMyCode": falseto step through library code line by line.
Variables
Values can be changed from the Variables view or the debug console: Python locals, globals, attributes, list items and dict entries at a Python stop (the new value is any Python expression), and native variables at a native stop. Long lists are fetched in pages, and "Copy as Expression" / "Add to Watch" work on nested values. The debug console completes names and attributes while you type.
Exceptions
The editor's exception-breakpoint list offers five choices:
| Filter | Stops when |
|---|---|
| Uncaught Python exceptions (on by default) | an exception nobody handled is about to end the program or a thread. The call stack shows the frames it passed through, from the raise outwards; their variables can be inspected and expressions evaluated in them. |
| Raised Python exceptions | an exception is raised in your code, or first reaches your code from a library or from native code, even if it is handled afterwards. One stop per exception. |
| User-unhandled Python exceptions | an exception leaves your code for the library code that called it: a failing assert on its way back to pytest, an error in a callback, a request handler or a thread's target. The frame it is leaving is shown at the failing line with its variables. Exits, cancellations and other exceptions outside Exception are ignored. |
| C++ throw | native code executes a throw. |
| Rust panic | Rust code panics. |
"Your code" means anything outside the standard library and site-packages; set
"justMyCode": false to treat library code the same as yours. SystemExit is not an
uncaught exception.
Crashes and signals
If the program crashes in native code (a segfault, an abort()), Seam stops at the
faulting line with the usual merged call stack: the native
frames, then the Python frames that led there, with their locals. Continuing lets the
signal take its course, and the debug console says which signal ended the program.
Signals a Python program handles itself (SIGINT, SIGTERM, SIGUSR1, timers) do not
stop the debugger; they are delivered as if it were not there. Use stopOnSignals to
change which ones stop.
Code without source
Frames in code Seam cannot show source for (a stripped wheel, libc, the interpreter)
appear greyed in the call stack as library!function. In VS Code, right-click such a
frame and choose Open Disassembly View to see the machine code around it; while that
view has focus, Step Over and Step Into advance one instruction at a time. If the program
crashes inside the interpreter itself (typically after an extension passed it a bad
pointer), the interpreter function that faulted is shown on top of the stack.
Child processes
Seam debugs the program you start, not the processes it starts. Children (os.fork,
subprocess, multiprocessing, pytest-xdist workers) run as if no debugger were there:
breakpoints in them do not stop, and the debug console says so once, the first time a
child that runs Python starts. Expressions typed into the debug console may start
processes.
Stopping the session ends the program and the children still in its process group. A
child that moved to a session of its own (start_new_session=True, a daemon) is left
running. If the program ends by itself, its children are left alone; with
internalConsole their output has nowhere to go once the session is over.
When something does not work
| What you see | What to do |
|---|---|
| The session does not start | Run seam doctor --python <your interpreter> (in VS Code: Seam: Check This Machine). It checks LLDB, its Python support, the helper, ptrace permission and the interpreter, and runs one real session. |
| A native breakpoint stays grey | The extension was built without debug info (-g; for Rust debug = true), the line has no code of its own in an optimised build, or the library was built from another path: the debug console then names the path and the sourceMap entry to add. |
| Step Into goes over a native call | The function has no debug info, or the optimiser removed it. A breakpoint by function name still works if the symbol exists. |
| Step Into does not enter a library's Python code | That is justMyCode; set it to false. |
| A breakpoint in a worker process never stops | Child processes are not debugged; the debug console says so the first time one starts. |
| Attach is refused after a wait | The program's main thread is blocked (in a system call or a long native call) and cannot load Seam's helper. Attach while it is doing something, or make it do something. |
| Python expressions are refused | The program is stopped in native code. Step or continue to a Python line; Python variables are still shown, read from memory. |
| Anything else | Set SEAM_LOG=/some/file in the environment of seam dap (in VS Code: the seam.logFile setting), reproduce it, and keep that file and the one next to it ending in .lldb. |
How it works
The usual workaround for mixed debugging attaches two debuggers that each believe they control the process. Seam has a single controller.
- LLDB owns the process. It launches it, sets native breakpoints, steps native code and reads memory. Seam's adapter is a script running inside LLDB.
- A small helper runs inside the Python process. It uses
sys.monitoring(PEP 669) to watch Python-level events. When a Python breakpoint or step fires, it calls an empty C function,seam_trap(), on which LLDB keeps a breakpoint. Every Python stop is therefore a native stop at a known safe point: the GIL is held and the interpreter is consistent. - Python is only executed in the target at safe points. Evaluating expressions and
reading variables with
repr()happens at Python stops. At a native stop Seam reads memory and nothing else, with two narrow exceptions for its own bookkeeping, described in docs/decisions.md. - The merged stack is built from raw memory, without Python's debug info. Seam walks
_PyRuntime→ interpreter → thread state → frames, decodes code objects and line tables, and splices each run of Python frames into the native stack at the C frame whose stack area contains that run's entry frame. - Stepping across the boundary combines both sides. Stepping in from Python arms a Python step and a one-shot breakpoint on every user function of the extension modules, so the step lands in the first user code entered, Python or native, whatever binding layer sits in between. A native step that returns into the interpreter is handed to the helper, which stops on the calling Python line.
With no breakpoints set and no step in progress, the helper has no monitoring events enabled, so the program runs at full speed. Stopping on uncaught exceptions costs nothing either: it hangs off the hook the interpreter calls when it reports one.
Limitations
Out of scope for this version: macOS, native Windows, architectures other than x86-64, free-threaded (no-GIL) builds, the experimental JIT, PyPy, sub-interpreters, and remote or container debugging (Seam must run on the same machine and in the same container as the program).
Windows through WSL is supported because the adapter and program both run on Linux. The release wheel targets glibc Linux; Alpine/musl is not part of the validated scope.
Known limits of what is in scope:
- Python expressions cannot be evaluated at native stops. If the program is stopped
in C, C++ or Rust code, Seam refuses to run Python and says so. Python locals and globals
of the frames below are still shown, decoded from memory:
int,float,str,bytes,bool,Noneand shallowlist/tupleshow their values; other objects show their type and address. Namespace views show up to 500 bindings from the first 4,096 dictionary entries. Step or continue to a Python line for full inspection. - Expressions that crash or time out. Code evaluated by the debugger runs inside the program. A native crash or an interrupted evaluation can leave the interpreter damaged even after LLDB unwinds the call; restart the debug session before evaluating again. Ordinary Python exceptions in expressions are reported without this problem.
- Optimised native code (
-O2, Rust release builds). Stepping in from Python needs the user function to exist as a function or as an inlined instance in the debug info; if the compiler removed it entirely the step behaves like step-over. A statement that is a single inlined library call can end up with no code of its own: a breakpoint on it is then reported as unverified, or moved to the next line that has code (Seam tells the client which). Debug builds do not have these problems. - Stepping into a Python callback from Cython or from optimised code can take several presses of Step Into: the generated or optimised code spreads one source line over many small ranges, and each press advances to the next one. Pieces of binding-layer glue inlined into the line no longer count as presses. A breakpoint in the callback is the reliable alternative.
- Names in generated and generic code. Cython functions and variables appear under
their generated C names (
__pyx_pf_...,__pyx_v_...) unless the module was built with line directives; Rust names are correct but can be very long. - Child processes are not debugged (see above). While a child started by
subprocess,os.systemoros.posix_spawnhas not yet replaced itself with the new program, LLDB takes every breakpoint out of the parent; a breakpoint another thread reaches in that moment, normally well under a millisecond, is missed. - LLDB 18 and child processes in programs with several threads. LLDB 18 mishandles a
child being started (
subprocess,os.system) at the moment another thread is at a breakpoint, including a conditional one whose condition is false, and several threads starting children at once. It then cannot evaluate expressions any more or loses the program; Seam says so when the program is lost, and the session has to be restarted. A breakpoint in a loop that another thread runs constantly makes this likely; otherwise it takes a coincidence. LLDB 19 and 20 avoid this bug: install one (apt install lldb-19). Seam prefers installedlldb-20/lldb-19over plainlldb. IfSEAM_LLDBis set, remove it or point it to the newer version in the environment ofseam dap(for VS Code: of the editor).seam doctorreports the selected path and version, and warns if it is 18. - Under pytest, a segfault stops twice: at the fault, and again when
faulthandler(which pytest enables) re-raises the signal after writing its report.pytest.fail()does not trigger the user-unhandled stop (it is not anException); a failingassertdoes. - A step waiting in a generator that is never resumed. Stepping over a
yieldwaits for the generator's next line. If its consumer drops it instead, some interpreters (3.12.3) discard it without running it: the step never ends and the program runs on to the next breakpoint, as under pdb. - Generated code (a dataclass's
__init__, anything run throughexec) has no source and is stepped over;justMyCode: falsesteps into it without showing a source. - Source paths.
sourceMapmaps directories on the same machine; remote path mapping is not supported. A breakpoint in a header that cannot bind because of its path is not explained (breakpoints in compiled files are). - Disassembly. Breakpoints cannot be set in the disassembly view. Instructions before
the first function of a library section, and code in which LLDB finds no function
boundaries, are shown as
??. - Exception stops. At an uncaught or user-unhandled exception, a C++ throw or a Rust
panic there is nothing to step through (the frames have unwound, or control is about to
leave by unwinding), so a step simply continues. Uncaught exceptions in threads are seen through
threading.excepthook; a program that replaces that hook after start-up hides them from Seam. A thread started with the low-level_threadmodule is not covered. - C++ exception messages.
what()is read for exceptions whose RTTI describes a single-inheritance chain tostd::exception; other throws show their type. This calls a native virtual method, so a customwhat()can have side effects. - Local data breakpoints. A later invocation of the same function reusing the same stack position cannot be distinguished if no watched access happened between them.
- Thread names. Python names are cached at safe stops. Native stops use the last cached names; new or renamed threads need a safe stop and a thread-list request first.
- Very large extension modules. The first Step Into of a session looks up every
function of each large module once: about 0.4 s for 15,000 functions, about 4 s for
pydantic-core (123,000 functions and inlined instances; the debug console says so).
Later steps take the usual few hundredths of a second. This uses
/proc/<pid>/mem; where that cannot be written, modules with more than 20,000 functions are excluded from step-in from Python, as before.SEAM_ENTRY_TRAPS=offin the environment ofseam dapswitches the mechanism off. - Programs with busy Python threads. If a request Seam runs in the program cannot finish on its own thread because another thread holds an interpreter lock, the other threads are let run for the moment it takes (after one second).
- Changing Python breakpoints while the program runs is applied by the main thread at its next bytecode boundary. If the main thread is blocked in a long native call, the change takes effect when that call returns.
- Attach loads the helper at the main thread's next safe point. A main thread blocked indefinitely in a system call will not get there, and the attach times out.
- Program input and output. With
console: integratedTerminalthe program has the editor's terminal to itself, and Ctrl-C there interrupts it as usual. It is not that terminal's foreground job (a small holder process is), so it is not sentSIGWINCHwhen the terminal is resized and Ctrl-Z does nothing. WithinternalConsolethe program's stdout and stderr arrive in the debug console as one stream and its standard input is empty:input()raisesEOFError. - Thread-heavy programs run about twice as slowly under Seam even with no breakpoints, because LLDB handles every thread start and exit. CPU-bound work is unaffected.
- Initial library loading pauses while LLDB processes the new module. The no-breakpoint throughput checks exclude interpreter startup and this one-time import cost.
- Embedded interpreters. Launch expects a normal
pythonexecutable (it injects the helper atPy_RunMain). Programs that embed Python are not supported. - LLDB quirks. Seam works around LLDB showing stale or cut-short frame lists (see
docs/decisions.md §4d and §12); the workaround calls
getpid()in the target. Where LLDB genuinely cannot unwind a function (LLDB 20 through nanobind's optimised library code), native frames below it are missing; Seam says so in the debug console and still shows every Python frame.
Building from source
For contributors or machines building the helper locally (Ubuntu 24.04):
sudo apt-get install -y lldb-19 gcc python3-dev python3-venv git
git clone https://github.com/ChirayuAgg0706/Seam.git
python3 -m venv ~/.venvs/seam
~/.venvs/seam/bin/pip install ./Seam
To build a VSIX, run scripts/build-vsix.sh from the checkout; Node.js and the Python
headers are required. See CONTRIBUTING.md
for the development toolchain.
Development
scripts/test.sh -q              # full suite against /usr/bin/python3.12
SEAM_TEST_PYTHON=/path/to/python3.14 scripts/test.sh -q
SEAM_TEST_OPT=O2 scripts/test.sh -q
SEAM_TEST_REPEAT=20 scripts/test.sh -q -k stepping   # hunt for flakiness
The suite launches real programs under Seam through a scripted DAP client and needs LLDB, gcc/g++, uv and, for the PyO3 scenarios, a Rust toolchain.
Licence
Apache-2.0. See LICENSE.
1 maintainer

Metadata
1 maintainer
Release files for seam-debugger 0.1.0
For a detailed explanation of source distributions (sdists) and built distributions (wheels), please see the package formats documentation.
Source distribution (sdist)
| File | Size | Uploaded | |
|---|---|---|---|
| seam_debugger-0.1.0.tar.gz | 184.7 kB | Details |
Built distribution (wheel)
| File | Interpreter | ABI | Platform | Reset |
|---|---|---|---|---|
| seam_debugger-0.1.0-cp312-abi3-manylinux2014_x86_64.manylinux_2_17_x86_64.manylinux_2_28_x86_64.whl | CPython 3.12 | abi3 | Linux glibc 2.17+ x86-64, Linux glibc 2.28+ x86-64 | Details |
Total release size: 318.8 kB
Release files / seam_debugger-0.1.0.tar.gz
| Download URL | seam_debugger-0.1.0.tar.gz |
|---|---|
| Size | 184.7 kB |
| Tags | Source |
|
SHA-256 checksum How to use checksums |
ddbec1fec49591d7ffafbb79536a71752ff518f47c58fa038ee594bfb270f49a
|
|
BLAKE2b-256 checksum How to use checksums |
f7b47766e3758b065590265f6d508d258bdae0ce22119a94550e1ab5047aa032
|
| Upload date | |
|
Uploaded using Trusted Publishing? What is trusted publishing? |
Yes |
| Uploaded via |
twine/7.0.0 CPython/3.13.14
|
Provenance
Provenance describes where a file came from. On PyPI, provenance is shared via attestations, which provide a verifiable record of the build or publishing details. View details, limitations and caveats.


PyPI Publish Attestation
PyPI verified that this artifact, at this checksum, originated from the publisher listed below.
Signed by GitHub Actions, verified by PyPI on Oct 7, 2026.
Transparency logRelease files / seam_debugger-0.1.0-cp312-abi3-manylinux2014_x86_64.manylinux_2_17_x86_64.manylinux_2_28_x86_64.whl
| Download URL | seam_debugger-0.1.0-cp312-abi3-manylinux2014_x86_64.manylinux_2_17_x86_64.manylinux_2_28_x86_64.whl |
|---|---|
| Size | 134.1 kB |
| Tags | CPython 3.12 Linux glibc 2.17+ x86-64 Linux glibc 2.28+ x86-64 abi3 |
|
SHA-256 checksum How to use checksums |
788303c0207fc6f53eafb65194a82e508ce29d86646de56e0a75e1907ead190e
|
|
BLAKE2b-256 checksum How to use checksums |
76840381e0075bef1efcd29d39716d3f813cdae5558e2106db114ff5177c5550
|
| Upload date | |
|
Uploaded using Trusted Publishing? What is trusted publishing? |
Yes |
| Uploaded via |
twine/7.0.0 CPython/3.13.14
|
Provenance
Provenance describes where a file came from. On PyPI, provenance is shared via attestations, which provide a verifiable record of the build or publishing details. View details, limitations and caveats.
PyPI Publish Attestation
PyPI verified that this artifact, at this checksum, originated from the publisher listed below.
Signed by GitHub Actions, verified by PyPI on Oct 7, 2026.
Transparency log












