Visualise time series data as seasonal spiral charts
Verified details
These details have been verified by PyPIProject links
GitHub Statistics
Maintainers

Project description
seasonal-spirals

Turn any daily time series into a seasonal spiral chart.
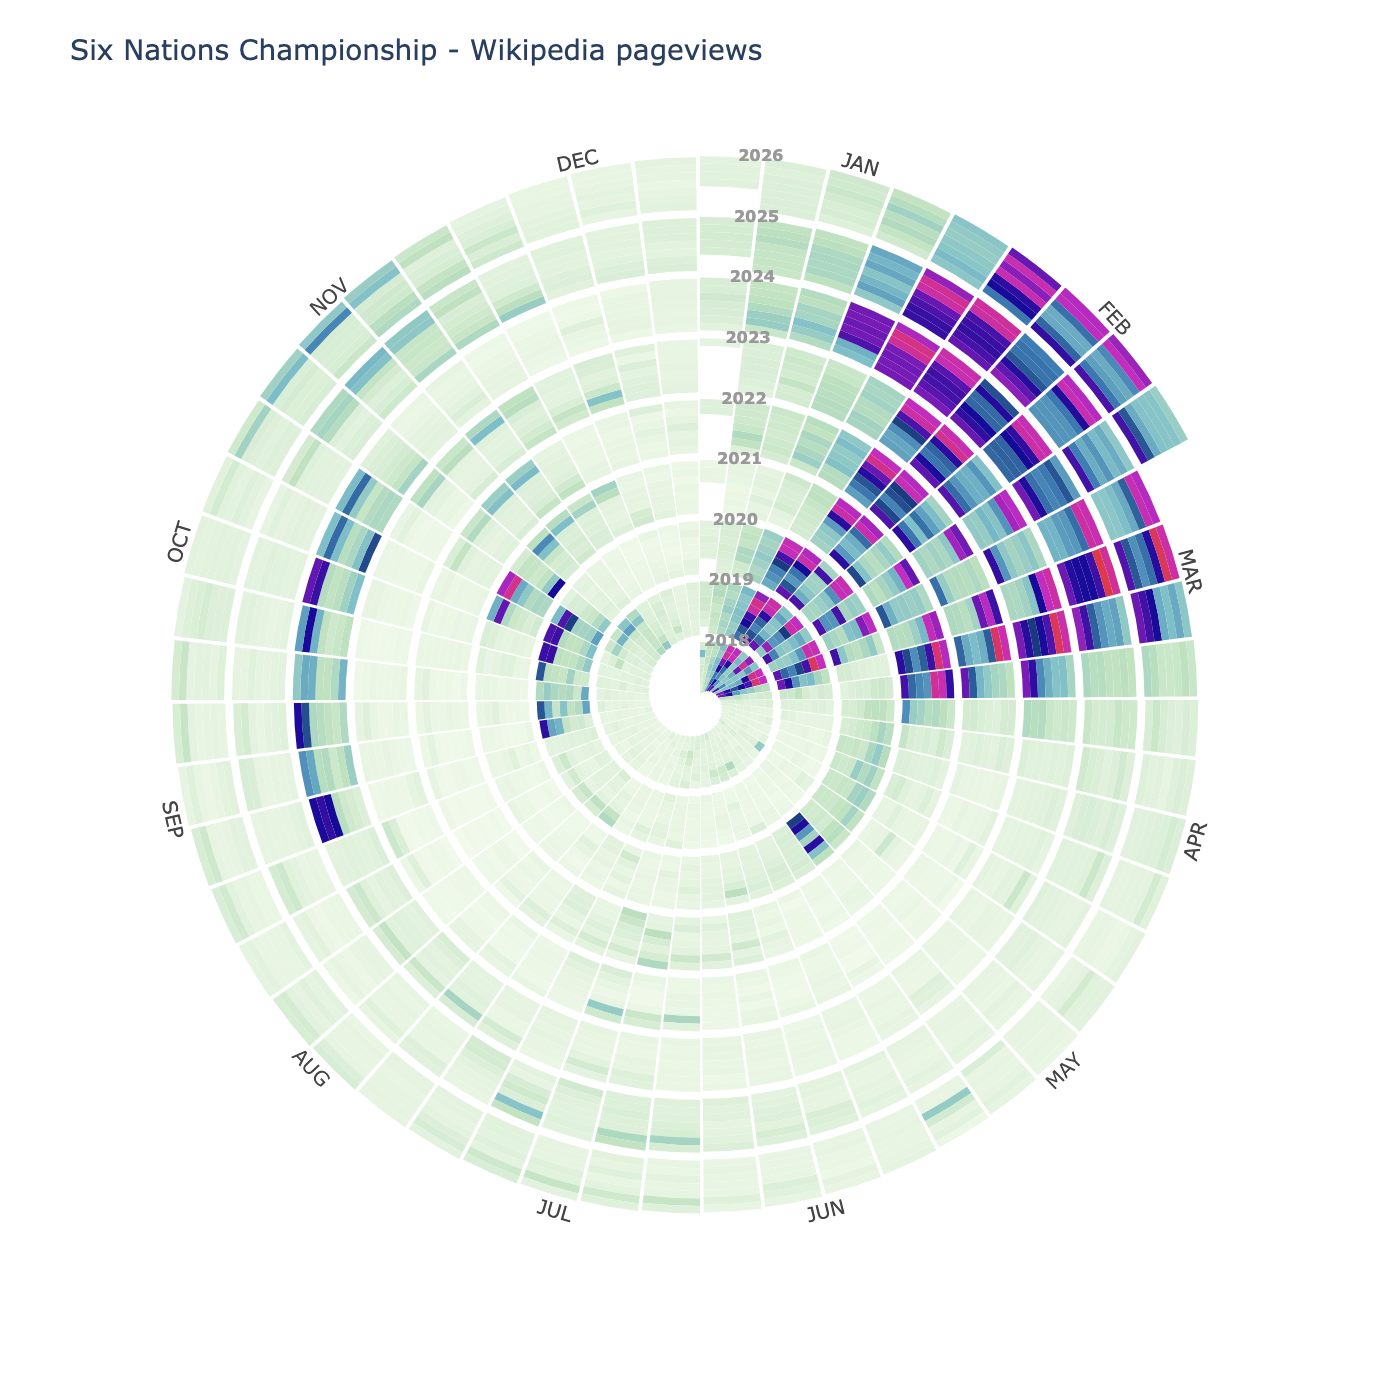
Each ring is one year. The angle is the time of year. The colour is the value. If your data has a seasonal pattern, it jumps out immediately. You can see it coiling around year after year.
Inspired by Wikipulse, which does this for Wikipedia pageview traffic.
Installation
uv add seasonal-spirals
Quick start
from seasonal_spirals import plot_spiral

fig = plot_spiral(data, title="My data")
fig.show()          # interactive in a notebook
fig.write_html("spiral.html")   # standalone HTML file
fig.write_image("spiral.png")   # static image (needs kaleido)
Fetch Wikipedia pageview data
The library includes a fetcher for Wikipedia traffic (no API key needed):
from seasonal_spirals import fetch_pageviews, plot_spiral

data = fetch_pageviews("Influenza", start="2015-01-01", end="2023-12-31")
fig = plot_spiral(data, title="Influenza Wikipedia pageviews")
fig.show()
Static charts with matplotlib
If you want a static output for saving or publication:
uv add seasonal-spirals[matplotlib]
from seasonal_spirals import plot_spiral_static

fig, ax = plot_spiral_static(data, title="My data", cmap="plasma")
fig.savefig("spiral.png", dpi=150, bbox_inches="tight")
API
plot_spiral(data, **kwargs)
Returns a Plotly Figure with hover tooltips. Call .show(), .write_html(), or .write_image() on it.
| Parameter | Default | Description |
|---|---|---|
colorscale |
auto | Plotly colorscale (string or list). Leave unset to use the default hybrid colour scheme |
inner_radius |
0.1 |
Size of the centre hole |
ring_width |
1.0 |
Radial growth per year |
start_month |
1 |
Month at 12 o'clock (1 = January) |
log_scale |
False |
Logarithmic colour normalisation |
vmin, vmax |
auto | Colour scale limits |
height, width |
700 |
Figure dimensions in pixels |
cutoff |
auto | Override the cutoff directly with a known value |
cutoff_fn |
auto | Custom cutoff rule as a callable (see below) |
plot_spiral_static(data, **kwargs) (requires [matplotlib])
Returns a (fig, ax) tuple.
| Parameter | Default | Description |
|---|---|---|
cmap |
auto | Matplotlib colourmap. Leave unset to use the default hybrid colour scheme |
inner_radius |
0.1 |
Size of the centre hole |
ring_width |
1.0 |
Radial growth per year |
start_month |
1 |
Month at 12 o'clock |
log_scale |
False |
Logarithmic colour normalisation |
vmin, vmax |
auto | Colour scale limits |
show_month_labels |
True |
Show month names around the edge |
show_year_labels |
True |
Show year numbers in the spiral |
cutoff |
auto | Override the cutoff directly with a known value |
cutoff_fn |
auto | Custom cutoff rule as a callable (see below) |
SeasonalSpiral(data, **kwargs) (requires [matplotlib])
Lower-level class if you want more control. Call .plot() to render.
fetch_pageviews(article, start, end)
Fetches daily Wikipedia pageview counts for one article. Returns a pd.Series with a DatetimeIndex.
fetch_multiple(articles, start, end)
Same, but for a list of articles. Returns a dict of pd.Series.
Colour scheme and the cutoff
The default colour scheme uses a hybrid linear-log scale. The data range is split at a threshold called the cutoff:
- Below the cutoff (ordinary days): linear scale, light green to dark navy. This is where most days sit, and the linear mapping preserves the relative differences between them.
- Above the cutoff (extraordinary spikes): log scale, deep blue through magenta to coral red. The log mapping spreads out the spikes so they don't all collapse to the same colour.
Both halves get equal visual weight regardless of where the cutoff falls numerically, so the choice of cutoff controls how much of the colour range is "spent" on ordinary variation versus spikes.
Default cutoff: Tukey IQR fence
The cutoff is computed automatically using the Tukey IQR fence:
cutoff = Q3 + 1.5 * IQR
This is the same rule used by standard boxplots to identify outliers. Its key property is robustness: a handful of extreme spike days have no effect on Q1, Q3, or the IQR, so the cutoff stays anchored to the bulk of the distribution regardless of how wild the outliers are.
Overriding the cutoff
If the default does not suit your data, there are two escape hatches:
# Supply a known value directly
plot_spiral(data, cutoff=50_000)

# Supply a custom rule as a callable that receives the raw value array
plot_spiral(data, cutoff_fn=lambda v: np.percentile(v, 90))
The cutoff_fn receives a 1-D NumPy array of all finite values in the data slice and must return a single float. The result is automatically clamped so that both colour segments always have some extent.
Some ready-to-use alternatives:
import numpy as np

# Hampel identifier (very robust, good when outliers are extreme but rare)
def mad_cutoff(values):
    median = np.median(values)
    mad = np.median(np.abs(values - median))
    return median + 3 * 1.4826 * mad

fig = plot_spiral(data, cutoff_fn=mad_cutoff)

# Log-normal fit (appropriate for web traffic and count data)
def lognormal_cutoff(values):
    log_v = np.log(np.maximum(values, 1.0))
    return float(np.exp(np.mean(log_v) + 2 * np.std(log_v)))

fig = plot_spiral(data, cutoff_fn=lognormal_cutoff)

# Fixed percentile (simple, predictable: top 5% of days always get spike colours)
fig = plot_spiral(data, cutoff_fn=lambda v: np.percentile(v, 95))
Pass cmap / colorscale to use a completely different colour scheme, which bypasses the cutoff logic entirely.
Licence
MIT
Project details
Verified details
These details have been verified by PyPIProject links
GitHub Statistics
Maintainers


Download files
Download the file for your platform. If you're not sure which to choose, learn more about installing packages.
Source Distribution
Built Distribution
Filter files by name, interpreter, ABI, and platform.
If you're not sure about the file name format, learn more about wheel file names.
Copy a direct link to the current filters
File details
Details for the file seasonal_spirals-0.3.1.tar.gz.
File metadata
- Download URL: seasonal_spirals-0.3.1.tar.gz
- Upload date:
- Size: 1.9 MB
- Tags: Source
- Uploaded using Trusted Publishing? Yes
- Uploaded via: uv/0.11.4 {"installer":{"name":"uv","version":"0.11.4","subcommand":["publish"]},"python":null,"implementation":{"name":null,"version":null},"distro":{"name":"Ubuntu","version":"24.04","id":"noble","libc":null},"system":{"name":null,"release":null},"cpu":null,"openssl_version":null,"setuptools_version":null,"rustc_version":null,"ci":true}
File hashes
| Algorithm | Hash digest | |
|---|---|---|
| SHA256 |
51e65cf0f97ce5c35f59d81c9f5a3c43c5a6fcdf09a7ec477772fc4e105c8564
|
|
| MD5 |
ec7ea2e4de6cb476dac58b3a87926d9d
|
|
| BLAKE2b-256 |
453c52ccc8ef6d7c2297d85fa6c91ee3ca7449e2ce1a8cb1476d7d5e0eef0a16
|
File details
Details for the file seasonal_spirals-0.3.1-py3-none-any.whl.
File metadata
- Download URL: seasonal_spirals-0.3.1-py3-none-any.whl
- Upload date:
- Size: 21.7 kB
- Tags: Python 3
- Uploaded using Trusted Publishing? Yes
- Uploaded via: uv/0.11.4 {"installer":{"name":"uv","version":"0.11.4","subcommand":["publish"]},"python":null,"implementation":{"name":null,"version":null},"distro":{"name":"Ubuntu","version":"24.04","id":"noble","libc":null},"system":{"name":null,"release":null},"cpu":null,"openssl_version":null,"setuptools_version":null,"rustc_version":null,"ci":true}
File hashes
| Algorithm | Hash digest | |
|---|---|---|
| SHA256 |
db22ae4b154b6d06ea9663954b421f218d52ad9418280f00ee1b19afd91d29a0
|
|
| MD5 |
7416c3eebb4c36050db2d2540f1646f9
|
|
| BLAKE2b-256 |
f5304ea4c16a3564b7d34bac5faffbb3cab08ebccd2f80db0775d8458ab1be05
|


