
seisplot
Plotting of seismic data using variable-density or variable-area wiggle displays. Plotting of amplitude and phase spectra. Creation of animations and crossplots using arbitrary trace header mnemonics.
Description
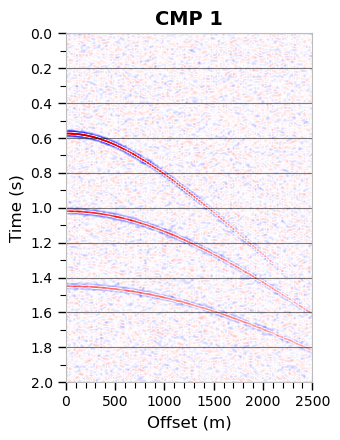
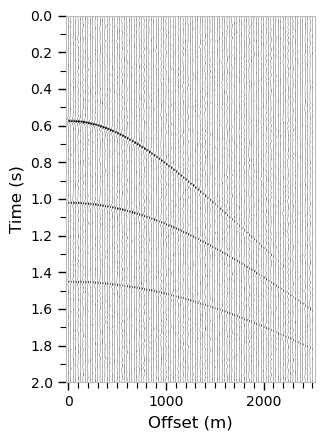
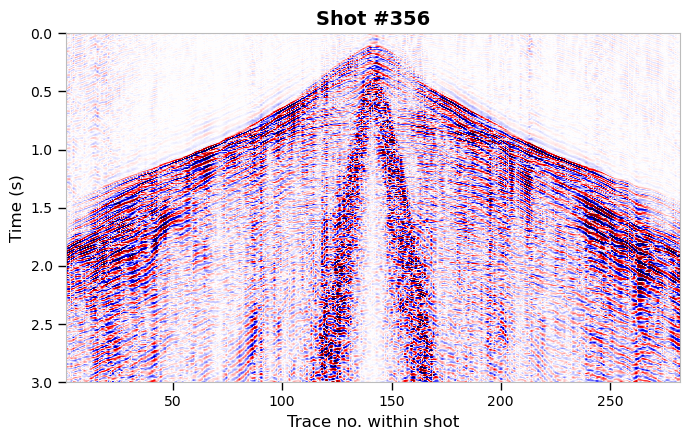


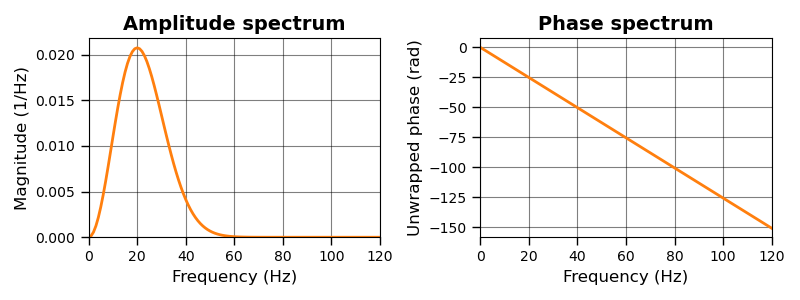
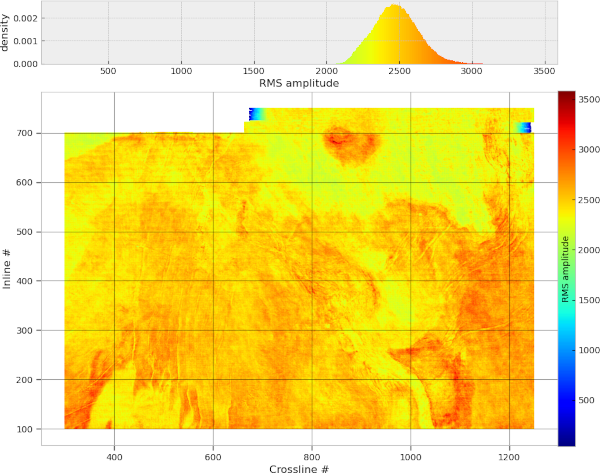
The seisplot module provides a single, highly flexible method plot() to display seismic data. Methods toggle() and wipe() can be used to create animations that can be saved as images or movies. Method spectrum() can be used to display amplitude and phase spectra of seismic data. Method crossplot() can be used to plot one trace header mnemonic against another one, possibly colored by a third mnemonic. All methods are highly flexible and displays can be easily adjusted via optional parameters.
The module was designed to get decent displays of seismic data in a way that is more convenient than going through many individual Matplotlib function calls explicitly. However, if required Matplotlib methods can also be called directly. The code is pure Python and kept deliberately simple to get students participating our Geophysics classes and exercises at university going with Python and seismic data.
Key features
- Variable-density image plots.
- Variable-area wiggle plots.
- Highly configurable settings like colors, line widths, colorbars, labels, axis ticks, grid lines, etc.
- Animated toggles between two or more seismic image plots.
- Animated wipes between two seismic image plots.
- Amplitude or phase spectrum plots.
- Crossplots of arbitrary trace header mnemonics, including histograms.
- Special colormaps.
Getting Started
Dependencies
Required: numpy, matplotlib
Optional: pandas (if trace headers for crossplots are stored in DataFrames), numba
Installation
Install from PyPI:
$> pip install seisplot
Install directly from gitlab:
$> pip install git+https://gitlab.kit.edu/thomas.hertweck/seisplot.git
Editable install from source:
This version is intended for experts who would like to test the latest version or make modifications. Normal users should prefer to install a stable version.
$> git clone https://gitlab.kit.edu/thomas.hertweck/seisplot.git
Once you acquired the source, you can install an editable version of seisplot with:
$> cd seisplot
$> pip install -e .
Brief tutorial
For a demonstration of various features and much more, please visit the "examples" folder in the repository where several Jupyter notebooks (tutorials) are available.
Plotting seismic data (for instance, read with our seisio package and therefore available as Numpy structured array including trace headers) can be as simple as:
import seisplot

fig, ax = seisplot.plot(data, haxis="offset", width=4, height=6,
                        vlabel="Time (s)", hlabel="Offset (m)",
                        vmajorticks=0.2, vminorticks=0.1,
                        hminorticks=500, vgrid="major")
The variables fig and ax are standard Matplotlib figure and axis handles that can be used to tweak the display further. You could also create those first using fig, ax = plt.subplots(1, 1) and pass them to the plot() method. In this way, it is possible to, for instance, create several seismic displays in one figure, or create displays that share the y-axis (usually "time").
A display toggle can, for instance, be produced in the following way:
ani, fig, ax = seisplot.toggle([data_1, data_2, data_diff],
                               interval=1000, repeat_delay=0,
                               hlabel="offset (m)", vlabel="time (s)")
The returned animation-artist object can be used to save an animated image or a movie.
An animated wipe can, for instance, be produced in the following way:
ani, fig, ax = seisplot.wipe(data_1, data_2, blit=True,
                             nwipe=30, wipecolor="blue",
                             interval=5, repeat_delay=0,
                             hlabel="offset (m)", vlabel="time (s)")
Again, the returned animation-artist object can be used to save an animated image or a movie.
Plotting an amplitude spectrum of seismic data (for instance, read with seisio) can be as simple as:
win = np.hamming
fig, ax = seisplot.spectrum(data, amplitude=True, window=win, scale="dB",
                            hlabel="Frequency (Hz)", vlabel="Magnitude (dB)",
                            vgrid="major", hgrid="major")
Here, a Hamming window is applied to the data before performing the Fourier transform, and the amplitude spectrum is converted to "dB" before being plotted. An unwrapped phase spectrum displayed in degrees could be obtained in the following way:
fig, ax = seisplot.spectrum(data, phase=True, unwrap=True, degree=True,
                            hlabel="Frequency (Hz)", vlabel="Phase (deg)",
                            linewidth=2, title="Unwrapped phase spectrum")
These methods produce similar results to Matplotlib's magnitude_spectrum(), phase_spectrum() and angle_spectrum() functions but have more options. In case of entire gathers, the spectrum is averaged over all traces.
The following shows an exemplary command to create a crossplot of inline vs. crossline colored by the total statics value of each trace stored in the trace header "tstat".
fig, ax = seisplot.crossplot(data, hkey="xline", vkey="iline",
                             color_by="header", ckey="tstat",
                             hlabel="Crossline #", vlabel="Inline #",
                             markersize=5, equal_axes=True, colorbar=True,
                             colorbarlabel="Total statics (ms)")
As can be seen, all methods of seisplot use a similar syntax, which makes using this module quite convenient. Under the hood the different methods actually share most of the code.
Main author
Dr. Thomas Hertweck, geophysics@email.de
Citation
If you use the "seisplot" module and you find it useful, getting some feedback would be very much appreciated. If you would like to cite this module, please use, for instance:
Hertweck, T. (2026). seisplot: A Python library for visualisation of seismic data. Version 1.4.2. url: https://gitlab.kit.edu/thomas.hertweck/seisplot/ (visited on 24/08/2026).
Adjust year, version and last visited date as required. Here's a BibTeX entry:
@software{seisplot,
  author  = {Hertweck, Thomas},
  year    = {2026},
  title   = {seisplot: A {P}ython library for visualisation of seismic data},
  url     = {https://gitlab.kit.edu/thomas.hertweck/seisplot/},
  urldate = {2026-08-24},
  version = {1.4.2}
}
License
This project is licensed under the LGPL v3.0 License - see the LICENSE.md file for details
1 maintainer

Metadata
1 maintainer
Release files for seisplot 1.4.2
For a detailed explanation of source distributions (sdists) and built distributions (wheels), please see the package formats documentation.
Source distribution (sdist)
| File | Size | Uploaded | |
|---|---|---|---|
| seisplot-1.4.2.tar.gz | 32.9 kB | Details |
Built distribution (wheel)
| File | Interpreter | ABI | Platform | Reset |
|---|---|---|---|---|
| seisplot-1.4.2-py3-none-any.whl | Python 3 | none | any | Details |
Total release size: 65.2 kB
Release files / seisplot-1.4.2.tar.gz
| Download URL | seisplot-1.4.2.tar.gz |
|---|---|
| Size | 32.9 kB |
| Tags | Source |
|
SHA-256 checksum How to use checksums |
18aaa135f5291d30e5ee51f3cfc58913017d0ba74471ae9a7df0e2ad7ee1a0d5
|
|
BLAKE2b-256 checksum How to use checksums |
398e3f62ed12ca75690f16f93526cffafb1a03bfac24fa8944f20d4e099d3195
|
| Upload date | |
|
Uploaded using Trusted Publishing? What is trusted publishing? |
No |
| Uploaded via |
twine/6.2.0 CPython/3.14.4
|
Release files / seisplot-1.4.2-py3-none-any.whl
| Download URL | seisplot-1.4.2-py3-none-any.whl |
|---|---|
| Size | 32.3 kB |
| Tags | Python 3 |
|
SHA-256 checksum How to use checksums |
ab3934cf747a6f8d4ce2b261bf341a3bb19e1f01bc3ae5ea18782d7caa09317c
|
|
BLAKE2b-256 checksum How to use checksums |
720f181e03579f909c2b69d81407b34beaa878dcfe4ce675a42af7572ef23e39
|
| Upload date | |
|
Uploaded using Trusted Publishing? What is trusted publishing? |
No |
| Uploaded via |
twine/6.2.0 CPython/3.14.4
|














