
seisview
Interactive seismic data visualization.
Description
The seisview package provides an interactive GUI for seismic data visualization, including velocity models. It can load 2D or 3D SEG-Y or SU data and present slices of data in an interactive way.
This little program is not meant to replace graphics workstations and commercial seismic software optimized to load and display large amounts of data. It's primarily meant to have a quick look at prestack/poststack 2D data or poststack 3D data (although it can also work with 3D prestack data) and was originally written to support lectures and exercises in an academic environment.
Key features
- Pure Python code based on tkinter, i.e., minimal external dependencies.
- Uses the seisio module for flexible I/O of seismic data.
- Data can be loaded in user-defined ways, independent on the sort order of the data on disk.
- GUI allows users to interactively change clips, axis labels, axis ticks, colormaps, and many more parameters.
- Tries to be OS-independent, i.e., should work on Linux, Windows, etc.
Getting Started
Dependencies
Required: matplotlib, numpy, seisio, tabulate, tkinter-tooltip, tkinter-icons[bootstrap]
The seisio packages requires: numba, numpy, pandas, tabulate
Installation
Install from PyPI:
$> pip install seisview
Afterwards, simply call
$> seisview
at the commandline. You can use option -v to obtain additional logging information or -vv to put all modules that use the standard logging facility into debug mode, including seisview itself.
Install directly from gitlab:
$> pip install git+https://gitlab.kit.edu/thomas.hertweck/seisview.git
Editable install from source:
This version is intended for experts who would like to test the latest version or make modifications. Normal users should prefer to install a stable version.
$> git clone https://gitlab.kit.edu/thomas.hertweck/seisview.git
Once you acquired the source, you can install an editable version of seisview with:
$> cd seisview
$> pip install -e .
An alternative location of the source is https://github.com/ThomasHertweck/seisview.
Overview
Here is a screenshot of the GUI with some explanations:
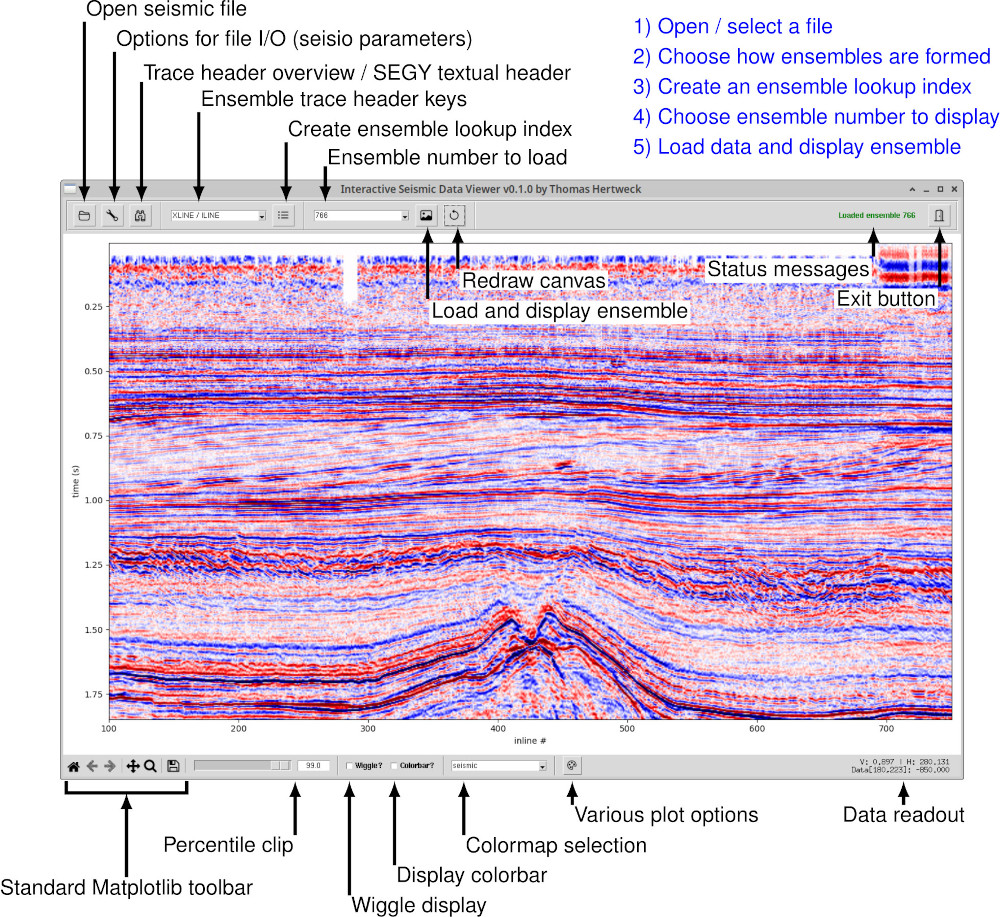
Note that, due to the nature of how matplotlib works, creating wiggle displays of seismic data (basically, lots of line plots) is slower than creating a variable-density plot (in principle a single imshow function call); seisview uses some tricks to speed up the wiggle displays but in particular for gathers with many traces, you may have to wait a few moments. Creating the seismic lookup index might also take some time, dependent on how large your input data set is and how fast your hardware. seisio usually is pretty fast reading data from local disk but keep in mind that possibly many trace headers have to be read in order to create the lookup index. The GUI will respond during this time as the indexing is handled as a separate CPU thread.
The entry fields (like the ensemble trace header keys, the percentile clip or the colormap selection) are writable, i.e., a user can enter his own ensemble sort order or any standard matplotlib colormap. Once the lookup index has been created, a list of ensembles will be presented in the selection box at the top of the GUI. Again, the user can type in numbers directly to narrow down the search, the combobox is filtered automatically as the user enters numbers.
A sort order of "XLINE / ILINE" means ensembles are formed by a common XLINE trace header, and within an ensemble traces are sorted by the ILINE trace header. Specifying a single key, e.g., "CDP", means that the entire data set is read and simply sorted by the specified trace header key. seisview uses the standard SEGY and SU trace header definitions provided by seisio. You can check the available trace header mnemonics for SEGY and SU data by running the following Python commands:
import seisio
seisio.log_sgy_default_thdef()
seisio.log_su_default_thdef()
Zoom functionality, panning etc. is provided by the standard matplotlib toolbar. You can also disply grid lines by using the 'g' and/or 'G' keys (for major and minor grid lines), or save the display to a file on disk in various different formats.
Testing
The current version of the seisview package has primarily been tested on Linux and Windows using Python 3.13 and 3.14.
Main author
Dr. Thomas Hertweck, geophysics@email.de
Citation
If you use the seisview package and you find it useful, getting some feedback would be very much appreciated. If you would like to cite this package, please use, for instance:
Hertweck, T. (2026). seisview: A Python GUI for interactive visualization of seismic data. Version 0.1. url: https://gitlab.kit.edu/thomas.hertweck/seisview/ (visited on 07/01/2026).
Adjust year, version and last visited date as required. Here's a BibTeX entry:
@software{seisview,
  author  = {Hertweck, Thomas},
  year    = {2026},
  title   = {seisview: A {P}ython {GUI} for interactive visualization of seismic data},
  url     = {https://gitlab.kit.edu/thomas.hertweck/seisview/},
  urldate = {2026-07-02},
  version = {0.1.0}
}
License
This project is licensed under the GPL v3.0 License - see the LICENSE.md file for details
1 maintainer

Metadata
1 maintainer
Release files for seisview 0.2.1
For a detailed explanation of source distributions (sdists) and built distributions (wheels), please see the package formats documentation.
Source distribution (sdist)
| File | Size | Uploaded | |
|---|---|---|---|
| seisview-0.2.1.tar.gz | 35.0 kB | Details |
Built distribution (wheel)
| File | Interpreter | ABI | Platform | Reset |
|---|---|---|---|---|
| seisview-0.2.1-py3-none-any.whl | Python 3 | none | any | Details |
Total release size: 68.4 kB
Release files / seisview-0.2.1.tar.gz
| Download URL | seisview-0.2.1.tar.gz |
|---|---|
| Size | 35.0 kB |
| Tags | Source |
|
SHA-256 checksum How to use checksums |
8f6efb8671f4a866fe636bed65037a5a3ceb0351567e58afb6425c781e1a7037
|
|
BLAKE2b-256 checksum How to use checksums |
078417f84d9fe10a8158e3984cbe4cc1243463c910e453b540666d691d822025
|
| Upload date | |
|
Uploaded using Trusted Publishing? What is trusted publishing? |
No |
| Uploaded via |
twine/6.2.0 CPython/3.14.4
|
Release files / seisview-0.2.1-py3-none-any.whl
| Download URL | seisview-0.2.1-py3-none-any.whl |
|---|---|
| Size | 33.4 kB |
| Tags | Python 3 |
|
SHA-256 checksum How to use checksums |
a1d4de1d51c2a7abbf8caf50177dae60c7706fae13c74469dd98b5414cbac0af
|
|
BLAKE2b-256 checksum How to use checksums |
2ccf96026f1f4cb4ee602fcfb70304b87a7ea256693177105d6ae566c24c1cfb
|
| Upload date | |
|
Uploaded using Trusted Publishing? What is trusted publishing? |
No |
| Uploaded via |
twine/6.2.0 CPython/3.14.4
|














