
sgmean for Python
Descriptive and robust statistics compatible with Statgraphics.
Core function: the proportional trimmed mean sgmean().
Resolves the integer truncation problem of scipy.stats.trim_mean.
Installation
pip install sgmean
The problem
scipy.stats.trim_mean computes the trimmed mean via integer
truncation: it calculates k = proportiontocut * n and silently
reduces it to the nearest integer below. This generates two types
of silent distortion:
- Type A (k < 1): returns the arithmetic mean without any trimming
- Type B (k > 1, non-integer): trims fewer observations than requested
The solution
sgmean applies a fractional discount (1 - delta) to boundary
observations, where delta = k - floor(k):
from sgmean import sgmean
import numpy as np

x = np.array([850, 920, 980, 1050, 1120, 1180, 1250,
              1320, 1400, 1480, 1550, 1700, 1850, 2100, 8500])

# Type A distortion (k = 0.05 * 15 = 0.75)
from scipy import stats
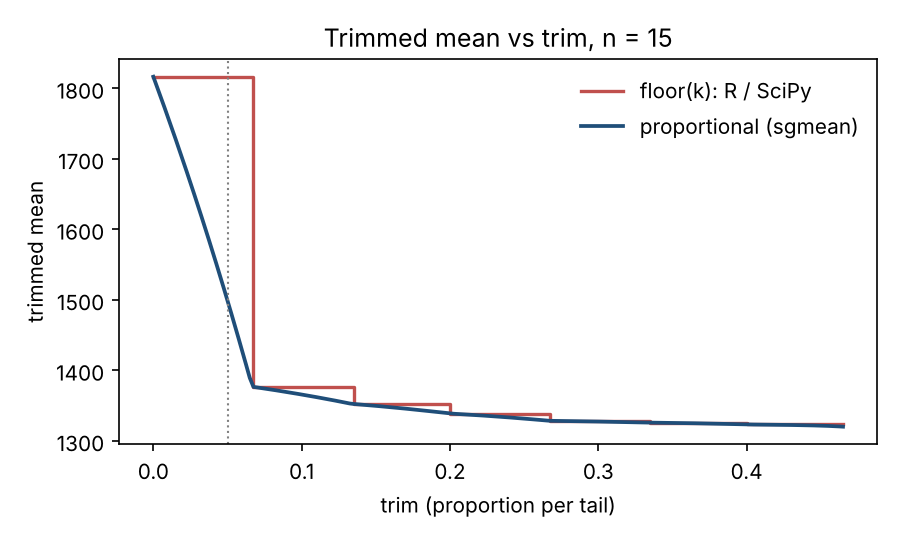
stats.trim_mean(x, 0.05)  # 1816.667 — no trimming applied
sgmean(x, trim=0.05)      # 1499.074 — correct proportional discount

# Type B distortion (k = 0.10 * 15 = 1.50)
stats.trim_mean(x, 0.10)  # 1376.923 — 33% trimming loss
sgmean(x, trim=0.10)      # 1365.833 — matches Statgraphics exactly
Does the truncation matter? Monte Carlo evidence
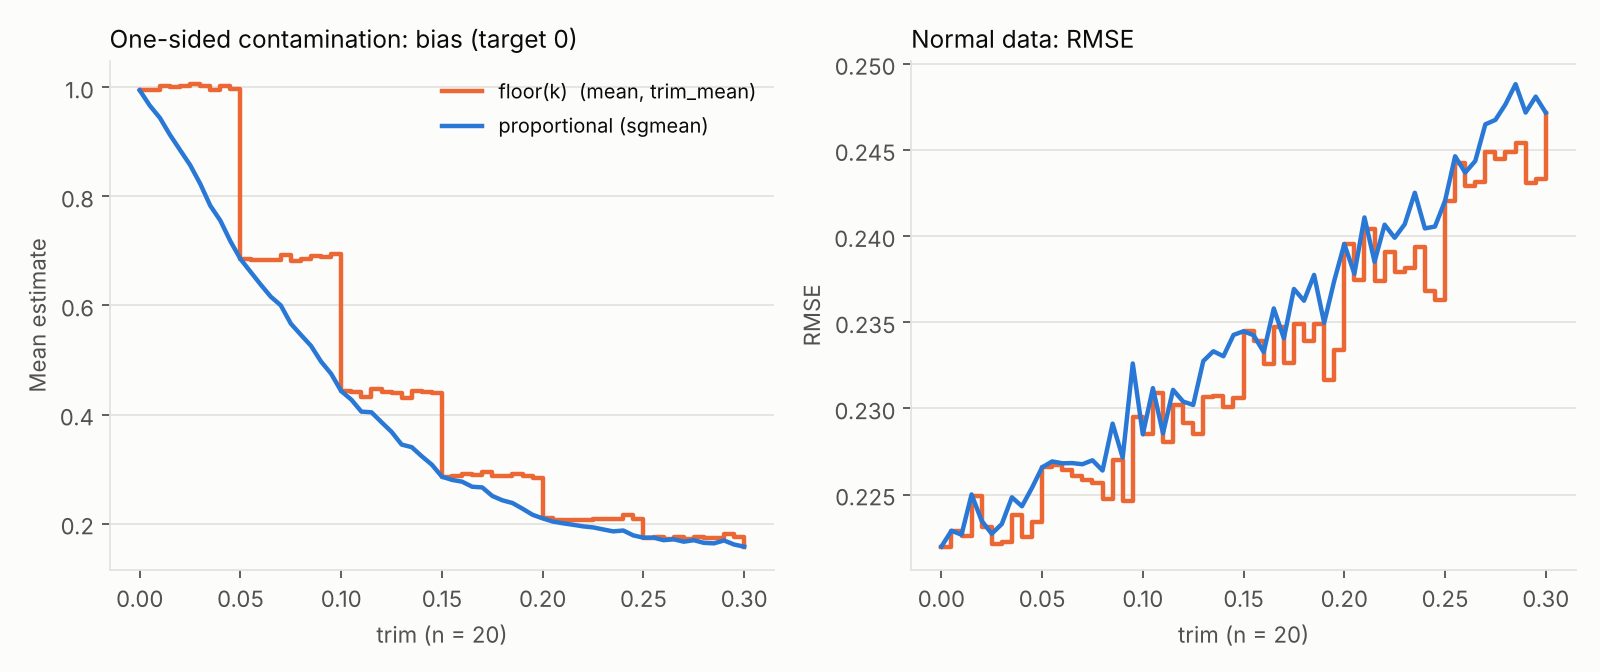
scripts/monte_carlo_truncation.py compares floor(k) trimming (R mean(trim=),
scipy.stats.trim_mean) with the proportional trimmed mean of this package on the same
simulated samples (20,000 replications, seed 20261021, n = 10, 15, 20, 25, 30, 50, 100;
trim = 5, 10, 20 %; target 0). When k = trim * n is an integer both are identical.
Ratio of mean squared errors, floor(k) over proportional (above 1 means the proportional
version is better), averaged over the cells where k is not an integer:
| Data | k < 1 |
k > 1 |
|---|---|---|
| Normal | 0.99 | 0.99 |
| Student t, 3 df | 1.38 | 1.05 |
| 90 % N(0,1) + 10 % N(0,9²) | 1.99 | 1.24 |
| 90 % N(0,1) + 10 % N(10,1) | 1.41 | 1.22 |
With clean normal data floor(k) is marginally better (it trims less and loses less
efficiency). With heavy tails or contamination the proportional version has lower bias and
RMSE. For n = 15, trim = 10 % (k = 1.5) and one-sided contamination the bias drops from 0.614
to 0.499 and the RMSE from 0.980 to 0.850. The figure shows the other point: floor(k) is a
step function of the trim, the proportional version is continuous.
Quantiles compatible with Statgraphics
sgmean also provides sample quantiles with the nine Hyndman & Fan (1996)
definitions, using type 2 by default. In every case tested, type 2
reproduces the quartiles, sextiles and percentiles reported by
Statgraphics Centurion (Summary Statistics and Percentiles tables). R and
NumPy default to type 7, which gives different values:
from sgmean import quartiles, quantile, iqr

x = [2, 5, 7, 11, 13, 20, 24, 31, 45, 80]
quartiles(x)            # (7.0, 16.5, 31.0)  -> Statgraphics
quartiles(x, type=7)    # (8.0, 16.5, 29.25) -> R / NumPy default
quantile(x, [1/6, 5/6]) # sextiles: [5.0, 45.0]
iqr(x)                  # 24.0
Position rule for type 2: pos = n*p + 1/2. If pos is an integer take
x[pos]; if it ends in .5 average the two neighbours; otherwise take the
nearest observation. For quartiles this is (n*Q + 2)/4, for sextiles
(n*S + 3)/6, for deciles (n*D + 5)/10. The constant is half the
denominator, so it is not the same for every division. See the docstring of
sgmean.quantile for worked examples.
Verified against Statgraphics Centurion (Summary Statistics and Percentiles tables) on seven data sets (n = 8 to 20). Other Statgraphics procedures and versions were not tested.
Winsorized mean and sigma (Statgraphics-compatible)
from sgmean import winsorized_mean, winsorized_sigma
winsorized_mean(x, trim=0.10)    # k = floor(0.10*n) values replaced at each tail
winsorized_sigma(x, trim=0.10)   # sd(ddof=1) * sqrt((n-1)/(n-2k-1))
Note: Statgraphics' winsorized mean truncates k to an integer, whereas its
trimmed mean applies the fractional discount that sgmean implements.
Descriptive statistics (Statgraphics Summary Statistics)
from sgmean import summary
s = summary(x, trim=0.05)   # 29 results, same as Statgraphics 'Summary Statistics'
print(s)                    # aligned table (English labels by default)
s["sbi"]                    # values are accessed by key, as in any dict
summary(x, lang="es")       # Spanish labels and decimal comma, as Statgraphics
Language of the printed labels (never of the keys or function names): the lang argument
("en", "es" or "auto", which follows the system locale) has the highest priority, then
sgmean.set_language("es"), then the SGMEAN_LANG environment variable, and finally English.
Also available individually: geometric_mean, dam (median absolute deviation, unscaled),
sbi (Tukey biweight scale, c = 9), skewness and kurtosis (adjusted, with
standardized=True), cv, std_error and mode. Together with the trimmed, winsorized
and quantile functions above, summary() reproduces the 29 results of the Statgraphics
table; all were checked against its output for seven data sets (n = 8 to 20).
Validation against Statgraphics Centurion
summary() was compared with the "Summary Statistics" output of Statgraphics Centurion
(Spanish interface, trim = 5 %) on seven data sets (n = 8, 9, 10, 11, 12, 14, 20; includes
ties, a mode, and decimal data), plus n = 3 and special cases in the test suite. Each data
set gives 29 results: 203 cells in total (197 numbers and 6 blanks, where
Statgraphics shows no value, such as the mode without a unique value). All 203 agree:
the largest relative difference is 4.4e-6, which is the rounding of Statgraphics to six
significant digits. The full comparison is in docs/validation_statgraphics.csv
(tests/test_descriptive.py repeats it on every run).
This verifies the cases above, not every possible input: for example winsorizing with a
fractional k such as 7.5 and n = 2 have not been compared with Statgraphics. sgmean is
not affiliated with Statgraphics; "compatible" means that it reproduces these results.
Disclaimer
sgmean is an independent project. It is not affiliated with, endorsed by or
sponsored by Statgraphics Technologies, Inc. "Statgraphics" is mentioned only to state
that the results of this package were checked against that program's output.
Reference
Gaviria-Chaverra, J.C. (2026). sgmean: A Proportional Trimmed Mean for R Compatible with Statgraphics. The R Journal. DOI: 10.32614/CRAN.package.sgmean
License
MIT License. Copyright (c) 2026 Juan C. Gaviria-Chaverra. See LICENSE for the full text.
(Version 0.1.1 on PyPI was published under GPL-3.0-or-later; from 0.3.0 on the package is MIT,
the same licence as the R package on CRAN.)
Inference for the trimmed mean (0.3.0, experimental)
from sgmean import sgmean, se_trimmed, ci_trimmed, ttest_trimmed
se_trimmed(x, 0.05)            # standard error
ci_trimmed(x, 0.05, conf=0.95) # (lower, upper)
ttest_trimmed(x, mu0=1000, trim=0.05)  # statistic, pvalue, df, estimate, se
When trim*n is an integer the SE is the classical Tukey-McLaughlin one
(sqrt(SSW/(h(h-1))), t with h-1 df). For fractional k it interpolates
linearly between the SEs of the winsorized samples with floor(k) and
floor(k)+1 values per tail. This interpolation is a heuristic validated
only by pilot simulations; it is not a proven result. Requires SciPy.
Results print as tables (English or Spanish, like summary()):
>>> ttest_trimmed(x, mu0=1000, trim=0.05)
Trimmed-mean t test (proportional trimming)
-------------------------------------------
Sample size                              15
Trim per tail                 5% (k = 0.75)
Trimmed mean                        1499.07
Hypothesized mean                      1000
Standard error                      221.497
Degrees of freedom                     12.5
t statistic                         2.25319
P-value (two-sided)                  0.0429
95% confidence interval  (1018.61, 1979.54)
They still unpack like tuples: lo, hi = ci_trimmed(x, 0.05).
Two samples, diagnostic and plot (0.3.0, experimental)
from sgmean import ttest_ind_trimmed, diagnose_truncation, plot_trim_profile
ttest_ind_trimmed(x, y, trim=0.05)    # Yuen-type test + CI for the difference
diagnose_truncation(x, 0.05)          # how much floor(k) differs from sgmean
plot_trim_profile(x, trim=0.05)       # step (floor) vs smooth (sgmean); needs matplotlib
ttest_ind_trimmed reduces to Yuen's test when k is an integer in both
samples. In a simulation (20000 replications per cell, see docs/sim_power_twosample.csv) its type I error
at alpha = 0.05 was between 0.024 and 0.052 for normal, t3, lognormal,
exponential and contaminated-normal data. Power is close to Welch for normal data (about 1 point lower) and much higher under heavy tails (power was measured for two-sided tests only).
What's new in 0.4.0
import pandas as pd
from sgmean import summary, ttest_trimmed, ttest_ind_trimmed, ttest_rel_trimmed, effect_size_trimmed

df = pd.read_excel("datos.xlsx")               # any DataFrame
summary(df, trim=0.05)                         # one column per numeric variable
summary(df, trim=0.05, lang="es", nan_policy="omit")

ttest_trimmed(df["ventas"], mu0=1000, alternative="greater", nan_policy="omit")
ttest_ind_trimmed(df["a"], df["b"], alternative="less")   # result includes a robust effect size
ttest_rel_trimmed(df["antes"], df["despues"])             # paired
effect_size_trimmed(df["a"], df["b"], trim=0.1)
nan_policy:"raise"(default),"omit";sgmeanalso"propagate"(default there, like R'smean).alternative:"two-sided"(default),"less","greater".- A warning is issued when
n - 2k < 8. - Paired test and effect size were also studied by simulation (
docs/SIMULACION_PAREADO_EFECTO.md, in Spanish): the paired test is practically equivalent to thefloor(k)rule in size and power (both far better than the mean-t under heavy tails or skew), so the advantage of the proportional rule is consistency, not performance; the robust effect size is inflated by about 12 % at n = 10 and 2 % at n = 40. - Public functions have type annotations (
py.typed); the package is not yet fully clean undermypy. - The effect size and the paired test use the same fractional-k conventions as the rest of the inference (heuristic for non-integer k; exact classical results when k is an integer).
1 maintainer

Metadata
1 maintainer
Release files for sgmean 0.4.0
For a detailed explanation of source distributions (sdists) and built distributions (wheels), please see the package formats documentation.
Source distribution (sdist)
| File | Size | Uploaded | Provenance | |
|---|---|---|---|---|
| sgmean-0.4.0.tar.gz | 223.9 kB | Without provenance | Details |
Built distribution (wheel)
| File | Interpreter | ABI | Platform | Reset |
|---|---|---|---|---|
| sgmean-0.4.0-py3-none-any.whl | Python 3 | none | any | Details |
Total release size: 250.6 kB
Release files / sgmean-0.4.0.tar.gz
| Download URL | sgmean-0.4.0.tar.gz |
|---|---|
| Size | 223.9 kB |
| Tags | Source |
|
SHA-256 checksum How to use checksums |
cb2a0ef0814df3b022579fa167ed42f93c90eadd9d844cb967a1f6ed2530a978
|
|
BLAKE2b-256 checksum How to use checksums |
399f0c83e8b1e2b81c270b1e2a813b2b159a700815602509c76b6858b058e39e
|
| Upload date | |
|
Uploaded using Trusted Publishing? What is trusted publishing? |
No |
| Uploaded via |
twine/7.0.0 CPython/3.14.6
|
Release files / sgmean-0.4.0-py3-none-any.whl
| Download URL | sgmean-0.4.0-py3-none-any.whl |
|---|---|
| Size | 26.6 kB |
| Tags | Python 3 |
|
SHA-256 checksum How to use checksums |
6470e60ebe35071484dad68a25e85ad882a679e507587e66efc43f033bd50cf4
|
|
BLAKE2b-256 checksum How to use checksums |
3fc521e6e7bf18dc789bbb546afc16271fbec1c96520e5d8ce7e583c73a8e3d2
|
| Upload date | |
|
Uploaded using Trusted Publishing? What is trusted publishing? |
No |
| Uploaded via |
twine/7.0.0 CPython/3.14.6
|
Security for sgmean 0.4.0
Provenance
Provenance describes where a file came from. On PyPI, provenance is shared via attestations, which provide a verifiable record of the build or publishing details. View details, limitations and caveats.
No provenance found
None of the files in this release were uploaded with provenance metadata.
A note on package security
PyPI is a repository for distributing packages, not a service for auditing them. While third-party security researchers and our staff do their best to detect and remove malicious packages, PyPI cannot guarantee the quality, security or suitability of any given package.
To learn more about protecting yourself from malicious actors, visit our package security documentation.














