
SHAP Prism
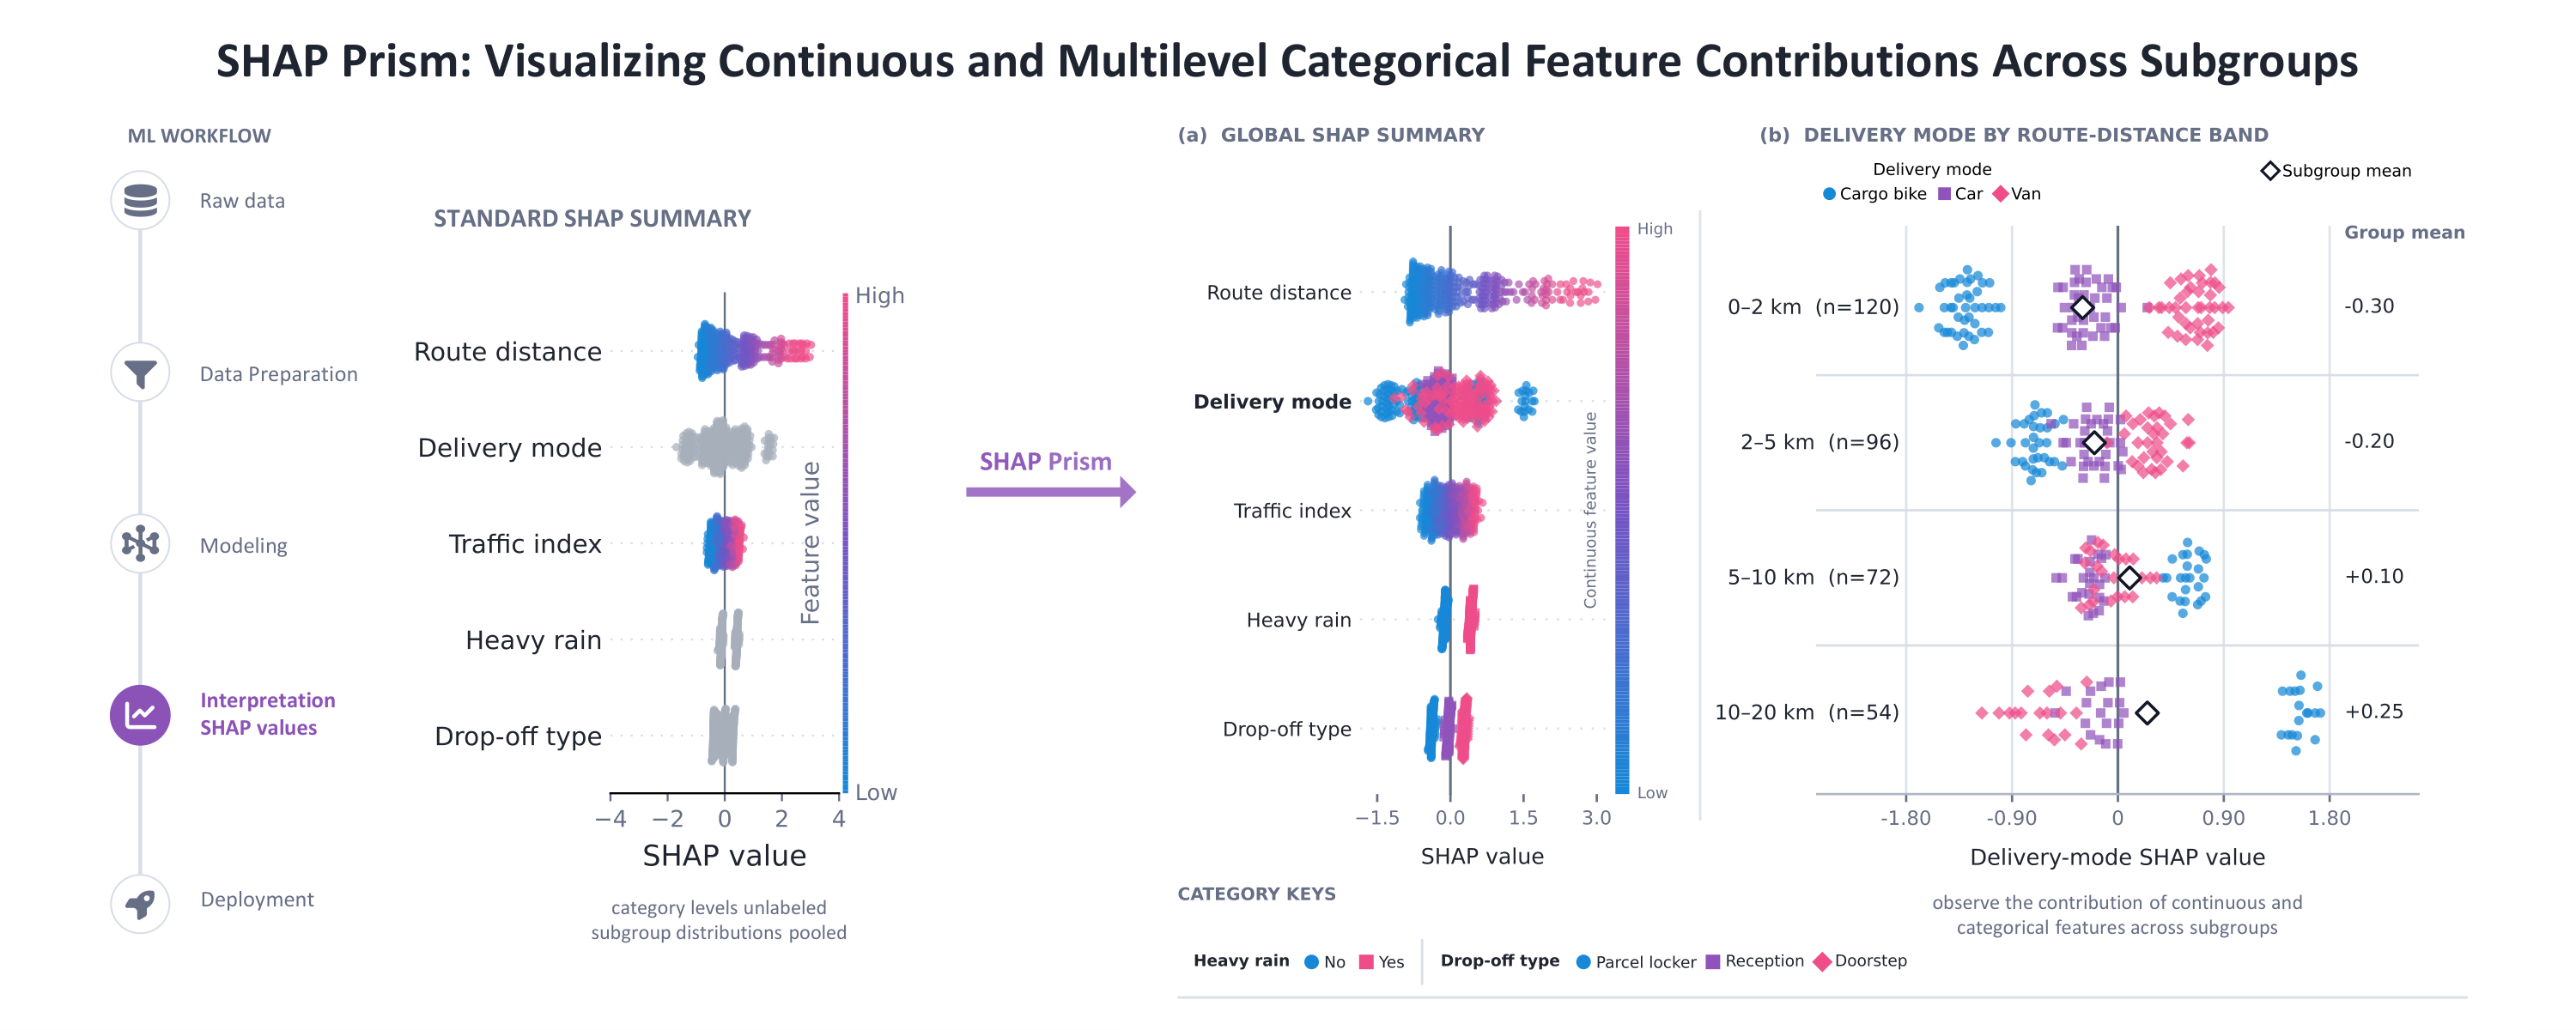
SHAP Prism visualizes an aligned matrix of precomputed SHAP values in two complementary views:
plot_summaryis a categorical-aware global beeswarm. Continuous features use a blue-purple-pink value scale by default; categorical features use discrete colors, markers, and feature-specific keys.plot_prismadds a shared-scale comparison of one focal feature across two to six declared subgroups.
Here, a multilevel categorical feature is a single-valued feature with three or more observed nonmissing levels. Binary categorical features use the same encoding.
Both functions describe one model output. They expect a finite two-dimensional SHAP matrix aligned row-for-row and column-for-column with the supplied feature table. The package does not fit models, compute SHAP values, choose subgroups, or perform causal or fairness inference.
Install
Install the published release from PyPI:
python -m pip install "shap-prism==0.4.5"
For development from a source checkout, use editable mode instead:
python -m pip install -e .
SHAP Prism requires Python 3.12 or later. Continuous integration tests both
the pinned publication stack and the latest dependency versions permitted by
pyproject.toml. SHAP itself
is not a runtime dependency because the plotting functions consume
explanations that have already been computed. No empirical data or explanation
table is bundled; deterministic synthetic values drive the quick start and
tests.

The fully synthetic quick-start notebook
starts with !pip install shap-prism, then demonstrates plot_summary and
plot_prism by recreating the graphical abstract's synthetic delivery
scenario entirely in memory.
Quick start
Object, string, Boolean, and pandas categorical columns are detected automatically. Convert numeric category codes to a categorical dtype before plotting. Supply mixed numeric and categorical data as a pandas DataFrame with explicit column dtypes; a NumPy object array cannot preserve that distinction reliably and is rejected.
import json
from pathlib import Path

import numpy as np
import pandas as pd
from shap_prism import plot_prism, plot_summary

rng = np.random.default_rng(42)
n = 240
X = pd.DataFrame({
    "severity_band": pd.Categorical(
        np.tile(["low", "moderate", "high", "critical"], n // 4),
        categories=["low", "moderate", "high", "critical"],
        ordered=True,
    ),
    "device": np.tile(["A", "B", "C"], n // 3),
    "flag": np.tile([False, True], n // 2),
    "temperature": rng.normal(20, 4, n),
})

# Replace this illustrative matrix with values returned by your SHAP explainer.
phi = np.column_stack([
    X["severity_band"].cat.codes.to_numpy() - 1.5,
    np.select([X["device"].eq("A"), X["device"].eq("C")], [-0.5, 0.6], 0),
    np.where(X["flag"], 0.35, -0.35),
    0.08 * (X["temperature"] - 20),
])

summary = plot_summary(phi, X, output="categorical_summary")

site = np.repeat(["North", "Central", "South"], n // 3)
prism = plot_prism(
    phi,
    X,
    site,
    "severity_band",
    group_order=["North", "Central", "South"],
    output="severity_by_site",
)

Path("severity_by_site.json").write_text(
    json.dumps(prism.summary, indent=2),
    encoding="utf-8",
)
Each suffix-free output stem writes both PNG and PDF. An explicit .png or
.pdf suffix writes only that format. The returned PrismResult exposes the
Matplotlib figure, named axes, and a JSON-safe summary; the JSON file in
the example is written explicitly.
Standalone category-key placement
plot_summary offers three placements without changing feature order, colors,
markers, or SHAP values:
| Value | Placement |
|---|---|
row_aligned |
Beside the plot, aligned with each categorical feature row (default) |
bottom |
Adaptively packed below one wide global panel |
right_stacked |
Compact feature-key blocks from the upper right downward |
plot_summary(phi, X, category_key_placement="bottom")
plot_summary(phi, X, category_key_placement="right_stacked")
The bottom dock packs at most two adjacent feature blocks on one line when their measured labels fit. The right-stacked layout follows the displayed global feature order rather than the original DataFrame column order.
Color schemes and custom colors
The original Prism palette remains the default. The opt-in Okabe-Ito preset
uses Okabe-Ito colors plus redundant marker shapes for categorical values and
the perceptually ordered cividis map for continuous values:
plot_summary(phi, X, color_scheme="okabe_ito")
plot_prism(phi, X, site, "severity_band", color_scheme="okabe_ito")
Okabe-Ito is qualitative: in severity mode, the key order conveys severity;
the hues identify categories. It is an accessibility-oriented option rather
than a guarantee under every display or form of color-vision deficiency.
Custom categorical and continuous colors can be supplied independently:
plot_summary(
    phi,
    X,
    category_palette=["#22577A", "#38A3A5", "#C8553D", "#7B2CBF"],
    continuous_cmap=["#102A43", "#F6C85F", "#D1495B"],
)

plot_prism(
    phi,
    X,
    site,
    "severity_band",
    category_palette={
        "low": "#22577A",
        "moderate": "#38A3A5",
        "high": "#C8553D",
        "critical": "#7B2CBF",
    },
    global_category_palette=["#22577A", "#38A3A5", "#C8553D", "#7B2CBF"],
)
For plot_summary, the custom categorical sequence restarts for each feature
after its category order has been resolved. In plot_prism,
category_palette controls the focal feature and
global_category_palette controls other categorical rows. Explicit channel
overrides take precedence over color_scheme. Missing values remain a gray
X. When a categorical feature has more than eight observed nonmissing
levels, the same eight-entry encoding is used for seven retained levels plus a
final Others level.
Category order and color
category_order_mode supports three display rules:
| Mode | Order |
|---|---|
data |
Declared order for an ordered pandas categorical; otherwise first appearance |
alphabetical |
Case-insensitive label order |
severity |
Category-level mean signed SHAP value |
For an unpooled categorical feature in severity mode under the default Prism scheme,
severity_direction="higher" places categories associated with lower model
output at the blue end and higher output at the pink end. Under Okabe-Ito or
custom colors, the ordered key rather than a hue progression carries this
meaning. Use "lower" when lower output is the more severe direction. For a
categorical focal feature in plot_prism, category_order can instead provide
the complete exact order. An explicit order replaces the selected ordering
mode; above eight levels, however, it controls display order and frequency-tie
resolution rather than overriding frequency-based retention. The returned
summary records the source and resolved order used in the figure.
The built-in palettes support eight nonmissing display entries. Marker shapes
provide a redundant cue. If more than eight raw levels are observed, SHAP
Prism retains seven raw levels by decreasing full-data frequency, breaking
ties by the resolved category order, and pools every remaining row into a final
Others entry. Retained levels keep their resolved display order; Others is
always last. A literal raw category named Others, if present, is always
absorbed into that pooled entry so that the key remains unambiguous. This rule uses all aligned
rows rather than the display sample and applies to plot_summary, the global
panel of plot_prism, and a categorical focal feature in plot_prism.
Color position never encodes numerical distance between category means; in
data and alphabetical modes, colors are identifiers only. In severity
mode, the retained levels follow category-level mean signed SHAP order, while
the forced-final pooled Others color is an identifier rather than a severity
endpoint. Missing values use a gray X.
When a literal raw category named Missing coexists with actual missing cells,
the raw category keeps its categorical encoding and the gray-X entry is labeled
Missing (NA) so the legend and returned summary remain unambiguous.
Outputs and reproducibility
Feature ranking, axis limits, category means, subgroup counts, and optional
subgroup means use all aligned rows. max_points changes only the displayed
dots. Sampling and vertical packing are deterministic for a fixed
random_state.
The summary records, among other fields:
- global feature order and the displayed rows;
- category levels, colors, markers, and category-level mean signed SHAP values;
- retained and collapsed high-cardinality levels and their all-row counts;
- the resolved missing-value label when actual missing cells are present;
- the source and resolved form of each categorical order;
- subgroup order, full group counts, means, and shared SHAP limits;
- display-sampling settings and written output paths.
This reporting contract makes it possible to inspect a figure without extracting values from rendered pixels.
Supported inputs and limits
shap_valuesandfeaturesmust have identical two-dimensional shapes with at least two rows and one feature.- Array inputs require
feature_names. DataFrame and Series indices are checked when both sides provide them. plot_prismrequires two to six nonmissing groups and one focal feature.max_featuresandmax_global_featuresaccept 1 to 15;max_pointsmust be at least 20.- Categorical features use at most eight nonmissing display entries: seven
separately encoded levels plus
Otherswhen more than eight raw levels are observed.
The detailed parameter, return, and error contracts live in the public function docstrings:
help(plot_summary)
help(plot_prism)
Interpretation
Horizontal position is the SHAP contribution on the declared model-output
scale. Color or marker identifies the observed feature value, not subgroup
membership. In plot_prism, compare groups only along their common horizontal
scale; vertical spread is point packing, not a probability-density axis. The
hollow diamond, when enabled, is the signed all-row subgroup mean.
Differences between groups can reflect model interactions, feature composition, dependence, data quality, model error, or chance. SHAP Prism displays these patterns. Study design and statistical inference remain separate.
Examples and verification
python examples/continuous_demo.py
python examples/categorical_demo.py
python examples/color_schemes_demo.py
python -m unittest discover -s tests -v
python scripts/render_visual_gallery.py --output visual_checks
The optional Palmer Penguins upstream builder requires user-acquired data kept
outside the repository and the reproduction extra:
python -m pip install ".[reproduction]"
python examples/palmer_penguins_global_categories.py --help
See ARTICLE_DATA_ACQUISITION.md for official
source links, external schemas, and the no-redistribution boundary. The
repository does not claim one-command empirical article reproduction.
The automated suite covers 30 to 2,000 rows, 3 to 20 features, two to six groups, unequal groups, missing values, ordinary and high-cardinality categorical features, every ordering mode, deterministic sampling, and journal-size PNG/PDF output.
The repository also contains:
DEVELOPMENT.md: local development and verification;COMPATIBILITY.md: verified environment;DATA_LICENSES.md: the data-free release boundary;ARTICLE_DATA_ACQUISITION.md: external article inputs and official source locations;LICENSE_SCOPE.md: exact software, data, and third-party licensing boundaries.
Encoded columns
The package plots one supplied attribution column per displayed feature. If several encoded columns represent one source feature, aggregate them before plotting and verify that local additivity is preserved:
encoded_columns = [2, 3, 4]
concept_phi = shap_values[:, encoded_columns].sum(axis=1)
remaining = np.delete(shap_values, encoded_columns, axis=1)
display_phi = np.column_stack([remaining, concept_phi])

np.testing.assert_allclose(
    display_phi.sum(axis=1),
    shap_values.sum(axis=1),
)
This sum is a grouped encoded contribution, not automatically the Shapley or Owen value of the unencoded feature. Record the column mapping.
Citation and license
Use CITATION.cff for the current software citation. The original Python
source, examples, tests, and project documentation are MIT-licensed, with
copyright held jointly by József Pintér and Servando Sibón Muñoz. Third-party
and data boundaries are stated in LICENSE_SCOPE.md and
THIRD_PARTY_NOTICES.md.
1 maintainer

Release files for shap-prism 0.4.5
For a detailed explanation of source distributions (sdists) and built distributions (wheels), please see the package formats documentation.
Source distribution (sdist)
| File | Size | Uploaded | |
|---|---|---|---|
| shap_prism-0.4.5.tar.gz | 46.2 kB | Details |
Built distribution (wheel)
| File | Interpreter | ABI | Platform | Reset |
|---|---|---|---|---|
| shap_prism-0.4.5-py3-none-any.whl | Python 3 | none | any | Details |
Total release size: 87.1 kB
Release files / shap_prism-0.4.5.tar.gz
| Download URL | shap_prism-0.4.5.tar.gz |
|---|---|
| Size | 46.2 kB |
| Tags | Source |
|
SHA-256 checksum How to use checksums |
453a9bb4bc16720b3b908239cf8c6534ad8e910128d2e7e0a03e5d68dc1d7ac6
|
|
BLAKE2b-256 checksum How to use checksums |
49f79ffa6657e801416bfe186567284be9b5051a1f5c2342df16330ad1f95a99
|
| Upload date | |
|
Uploaded using Trusted Publishing? What is trusted publishing? |
Yes |
| Uploaded via |
twine/7.0.0 CPython/3.13.14
|
Provenance
Provenance describes where a file came from. On PyPI, provenance is shared via attestations, which provide a verifiable record of the build or publishing details. View details, limitations and caveats.


PyPI Publish Attestation
PyPI verified that this artifact, at this checksum, originated from the publisher listed below.
Signed by GitHub Actions, verified by PyPI on Sep 25, 2026.
Transparency logRelease files / shap_prism-0.4.5-py3-none-any.whl
| Download URL | shap_prism-0.4.5-py3-none-any.whl |
|---|---|
| Size | 40.9 kB |
| Tags | Python 3 |
|
SHA-256 checksum How to use checksums |
ccbba5045c5989d9c399b04d4354f248445578cafa4ace4ffec6035900ac2c05
|
|
BLAKE2b-256 checksum How to use checksums |
48211a93b8c221b14bb134db192b8accdedb349a78b8b9c271c0c4533cbf0600
|
| Upload date | |
|
Uploaded using Trusted Publishing? What is trusted publishing? |
Yes |
| Uploaded via |
twine/7.0.0 CPython/3.13.14
|
Provenance
Provenance describes where a file came from. On PyPI, provenance is shared via attestations, which provide a verifiable record of the build or publishing details. View details, limitations and caveats.
PyPI Publish Attestation
PyPI verified that this artifact, at this checksum, originated from the publisher listed below.
Signed by GitHub Actions, verified by PyPI on Sep 25, 2026.
Transparency log













