A simple python package for rendering a Pandas DataFrames and matplotlib/plotly plots in a browser.

Project description
show_in_browser
A simple python package to display pandas dataframes and matplotlib/plotly graphs in a browser. This package is intended to be used from the command line, for better visualisation of dataframes than viewing within the terminal. (E.g. to allow viewing of the entire dataframe, scrolling etc). In addition, plots appear sequentially as separate browser tabs, so they can be viewed in a deliberate sequence.
To install use: pip install show-in-browser
The following code shows some example uses (in an ipython session):
# import the show_in_browser functions as on the line below:
# (alternatively you can use `import show_in_browser as sib` and then access the functions
# with `sib.show_df()` etc.)
from show_in_browser import show_df, show_plt_plot, show_px_plot
# other imports for the demo script
import pandas as pd
import numpy as np
import matplotlib.pyplot as plt
import plotly.express as px
# ==============================================================================
# SHOW DATAFRAMES IN THE BROWSER
# this section shows how to use the `show_df()` function to display a dataframe
# in the browser
# create dataframe
df = pd.DataFrame({'score_1': np.random.normal(100, 10, 100),
'score_2': np.random.normal(1000, 2, 100),
'score_3': np.random.normal(10, 2, 100)})
# show a DataFrame in a browser
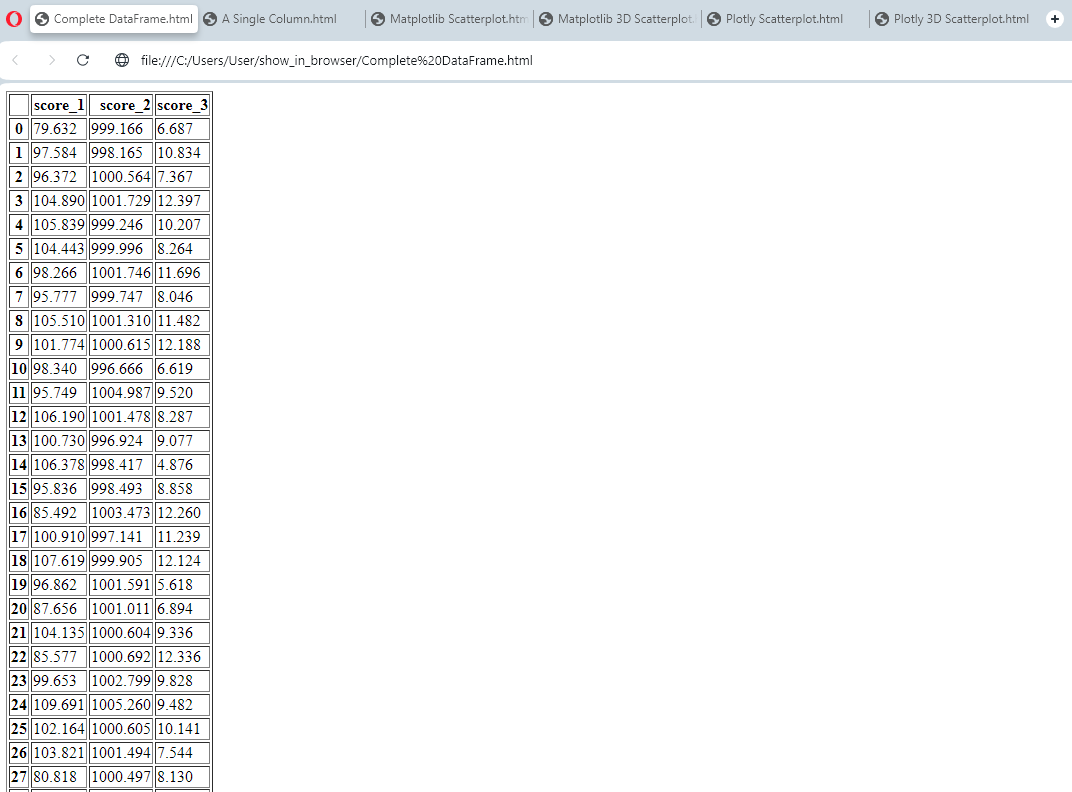
show_df(df, name='Complete DataFrame') # name is optional
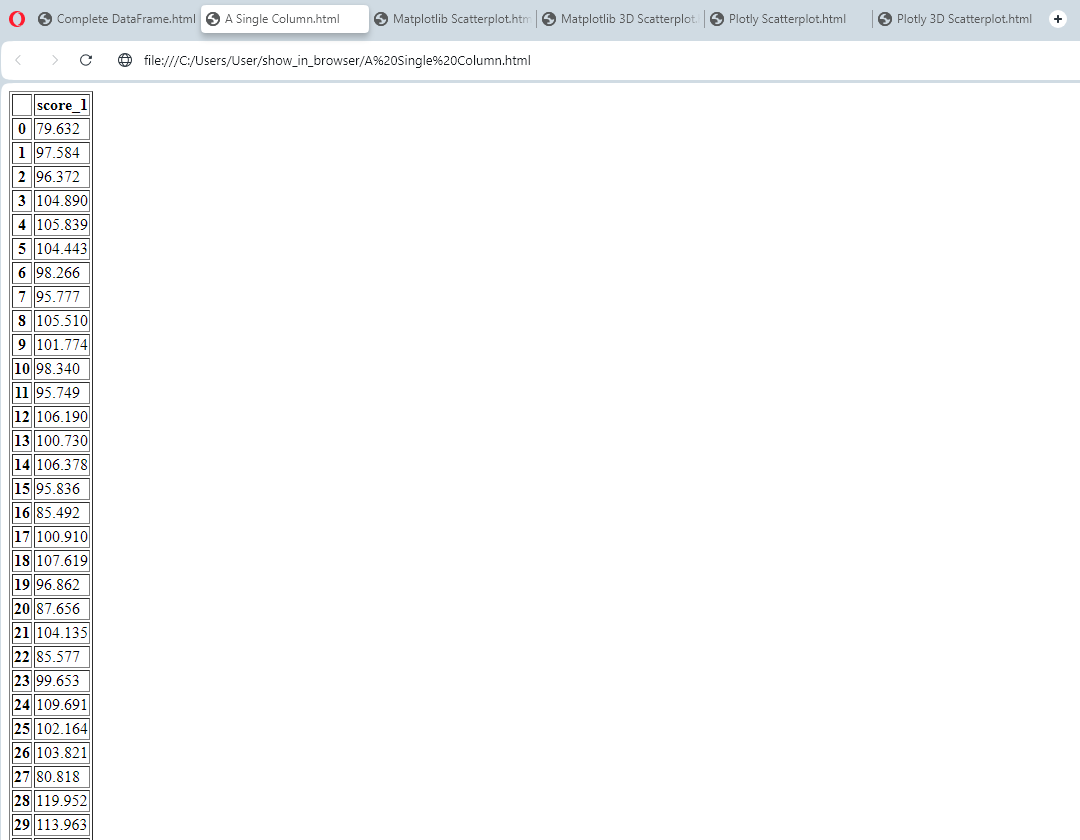
# show a Series derived from the DataFrame in a browser
show_df(df['score_1'], name='A Single Column') # name is optional
# ==============================================================================
# SHOW MATPLOTLIB PLOTS IN THE BROWSER
# this section shows how to use the `show_plt_plot()` function to display a
# matplotlib plots in the browser
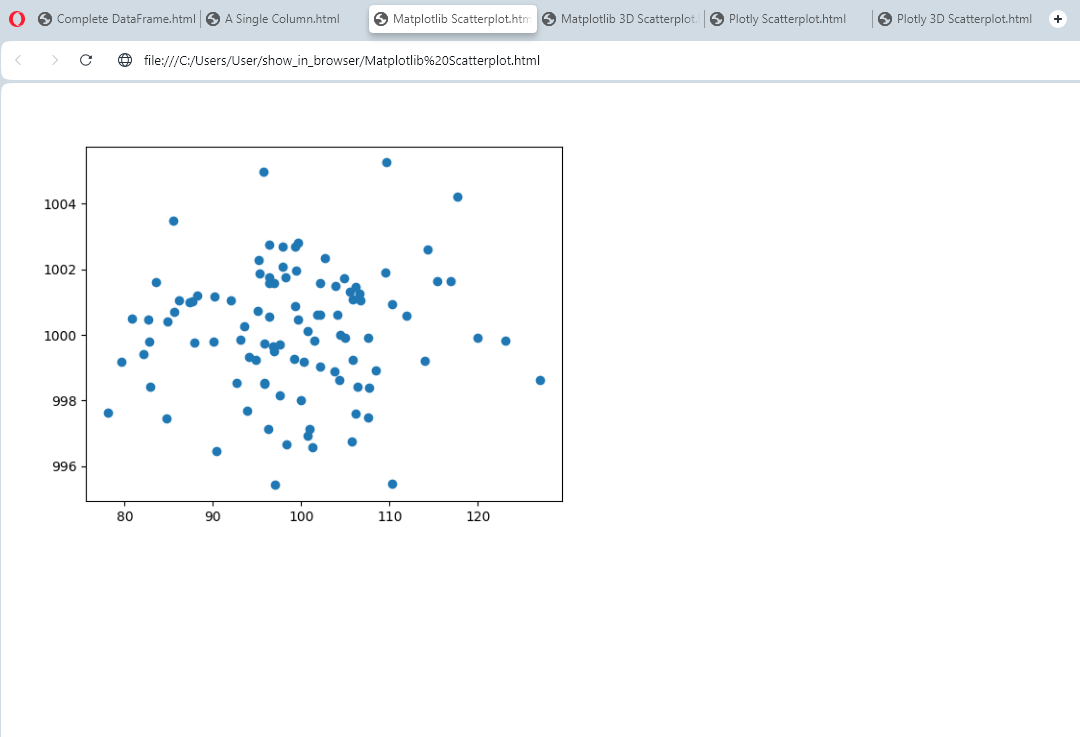
# 2D matplotlib plot
plt.figure()
plt.scatter(df['score_1'], df['score_2'])
show_plt_plot(name='Matplotlib Scatterplot') # name is optional
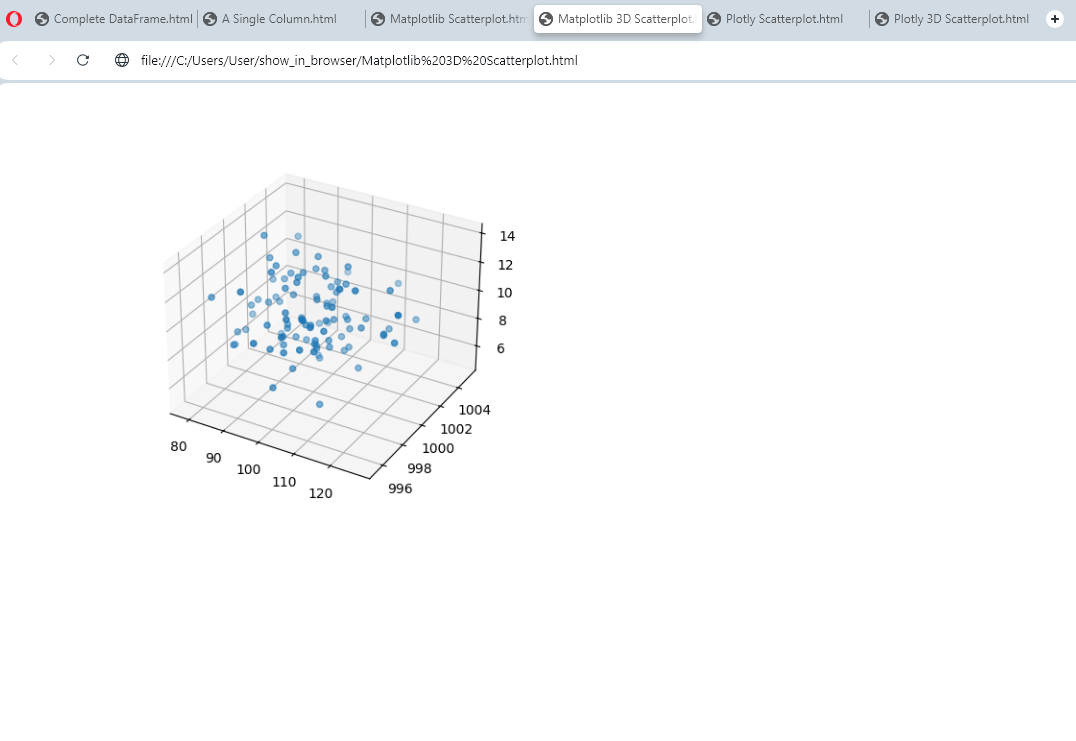
# 3D matplotlib plot
fig = plt.figure()
ax = fig.add_subplot(111, projection='3d')
ax.scatter(df['score_1'], df['score_2'], df['score_3'])
show_plt_plot(name='Matplotlib 3D Scatterplot') # name is optional
# ==============================================================================
# SHOW PLOTLY PLOTS IN THE BROWSER
# this section shows how to use the `show_px_plot()` function to display a
# matplotlib plots in the browser
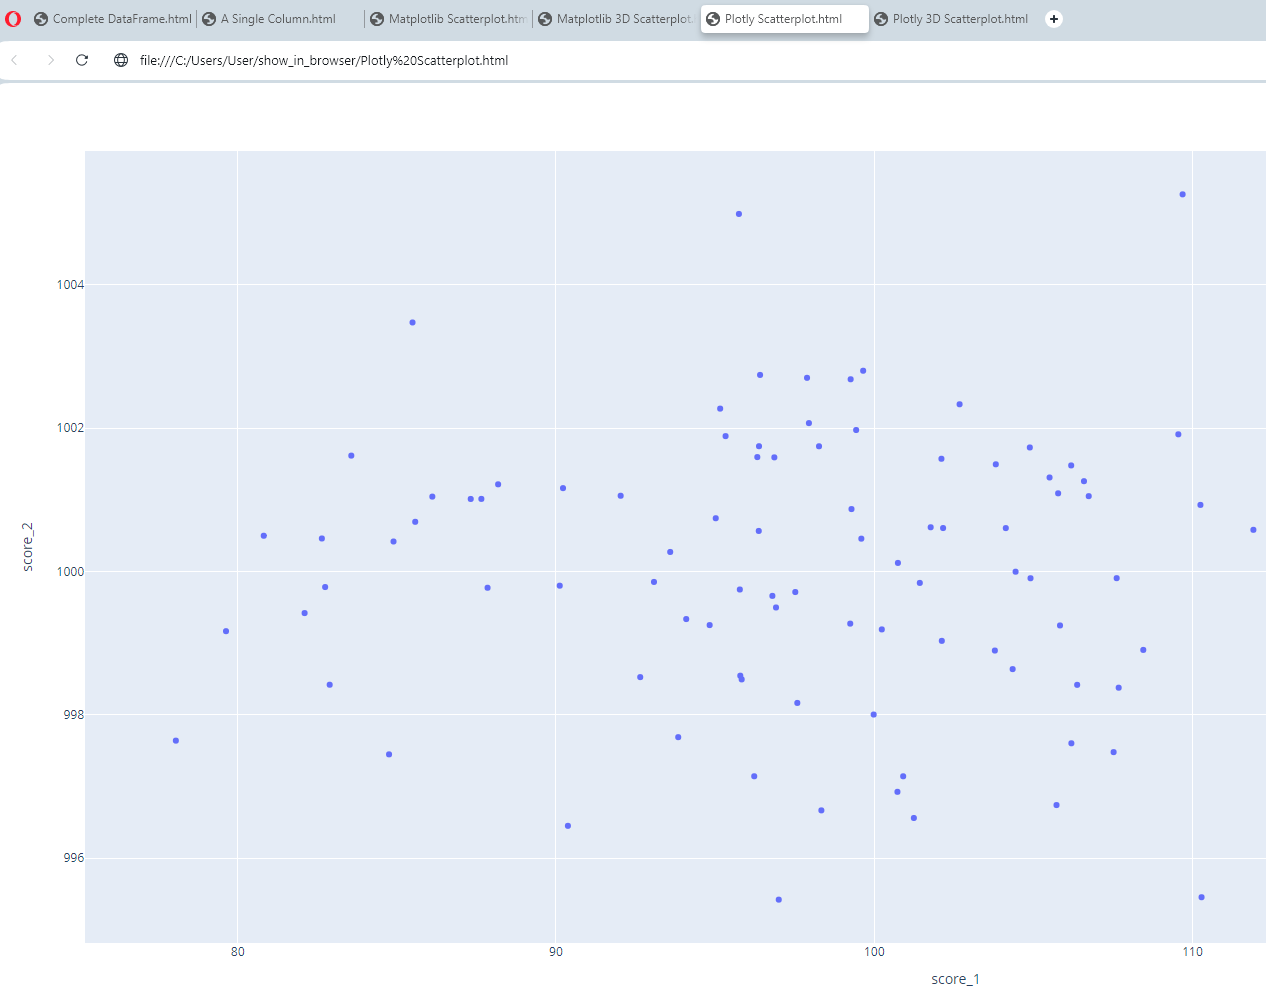
# 2D plotly plot
fig = px.scatter(df, x='score_1', y='score_2')
show_px_plot(fig, name='Plotly Scatterplot') # name is optional
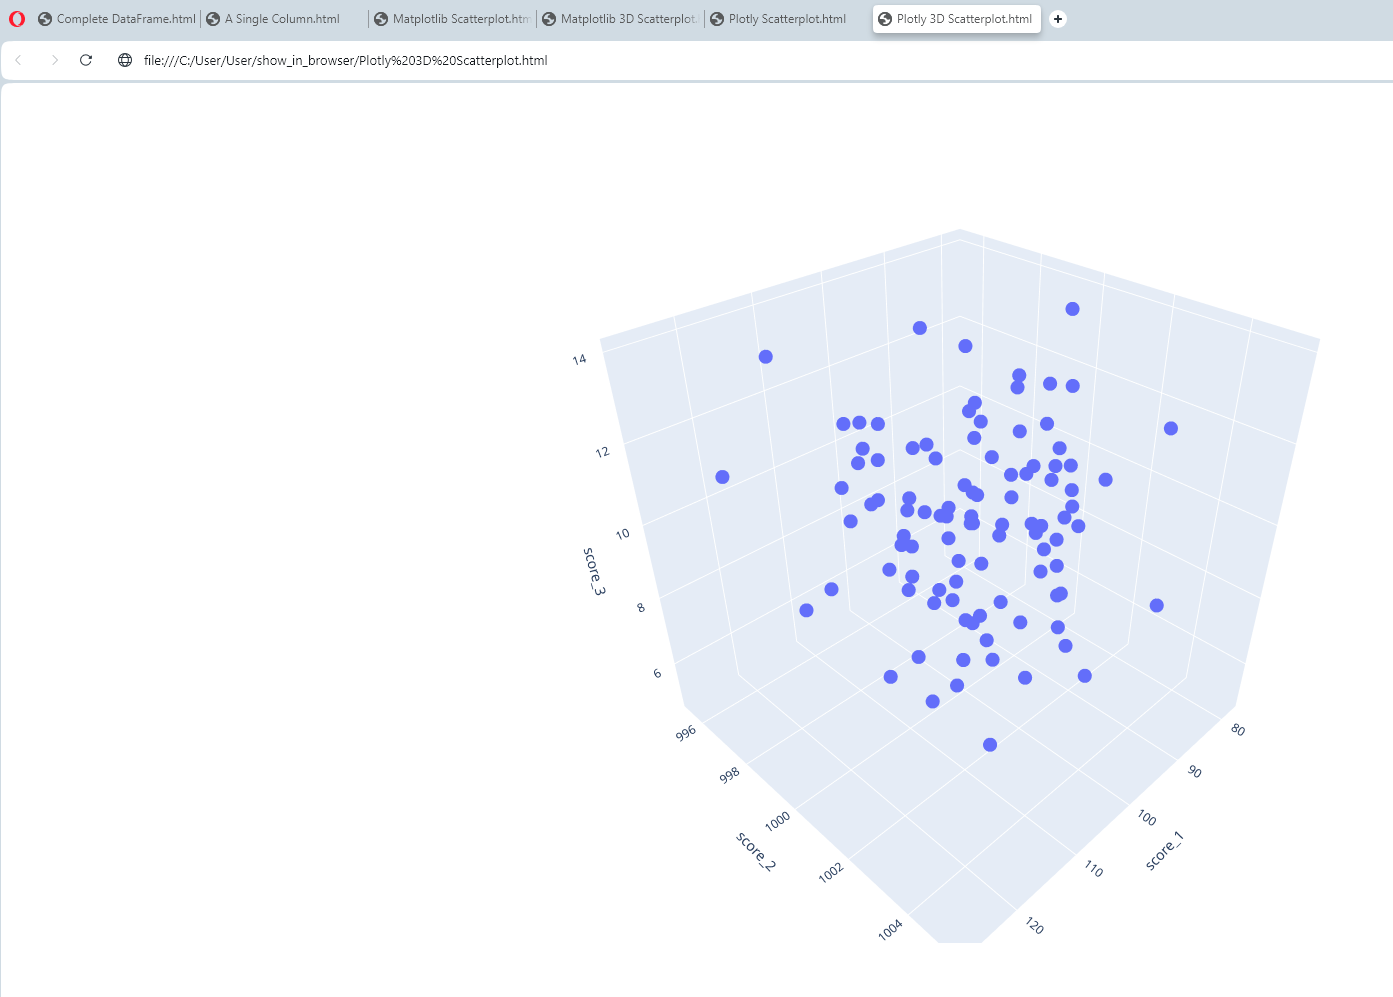
# 3D plotly plot
fig = px.scatter_3d(df, x='score_1', y='score_2', z='score_3')
show_px_plot(fig, name='Plotly 3D Scatterplot') # name is optional
This code will give you output of the following form, in your default browser. Each dataframe or plot that you have selected will show in separate tabs in your default browser. The dataframes and plots will appear in the order in which you ran the commands:


Download files
Download the file for your platform. If you're not sure which to choose, learn more about installing packages.
Source Distribution
Built Distribution
Filter files by name, interpreter, ABI, and platform.
If you're not sure about the file name format, learn more about wheel file names.
Copy a direct link to the current filters
File details
Details for the file show_in_browser-0.1.6.tar.gz.
File metadata
- Download URL: show_in_browser-0.1.6.tar.gz
- Upload date:
- Size: 6.8 kB
- Tags: Source
- Uploaded using Trusted Publishing? No
- Uploaded via: twine/4.0.2 CPython/3.11.3
File hashes
| Algorithm | Hash digest | |
|---|---|---|
| SHA256 |
8cfb25233d97401a046e05487f4ed765ba953d69610704bdf8b8beef95d76eed
|
|
| MD5 |
c18c48db4cbfb7e42fd91acea76229d3
|
|
| BLAKE2b-256 |
3e3f7ea5ebcf311d6afce5d1a184bdf1835abecce92a1dc5d27e5ad8d756d684
|
File details
Details for the file show_in_browser-0.1.6-py3-none-any.whl.
File metadata
- Download URL: show_in_browser-0.1.6-py3-none-any.whl
- Upload date:
- Size: 6.4 kB
- Tags: Python 3
- Uploaded using Trusted Publishing? No
- Uploaded via: twine/4.0.2 CPython/3.11.3
File hashes
| Algorithm | Hash digest | |
|---|---|---|
| SHA256 |
2dab9a15b04bc8390da5dfb29a2beef0a666c105a2573533d417dc0c70f39364
|
|
| MD5 |
3df553f58ffb8b6dc08f9274a30bf5da
|
|
| BLAKE2b-256 |
64b545e433bab5386dce422414e0eb9c0eb17810050b15d01a4b8322415c6fe9
|


