
Sightglass
Live dashboards for a running program, a microcontroller, or anything that can make an HTTP request. Send values by name and they appear in the browser (or the terminal) as they change: a window onto a running system, like the sight glass on a tank.
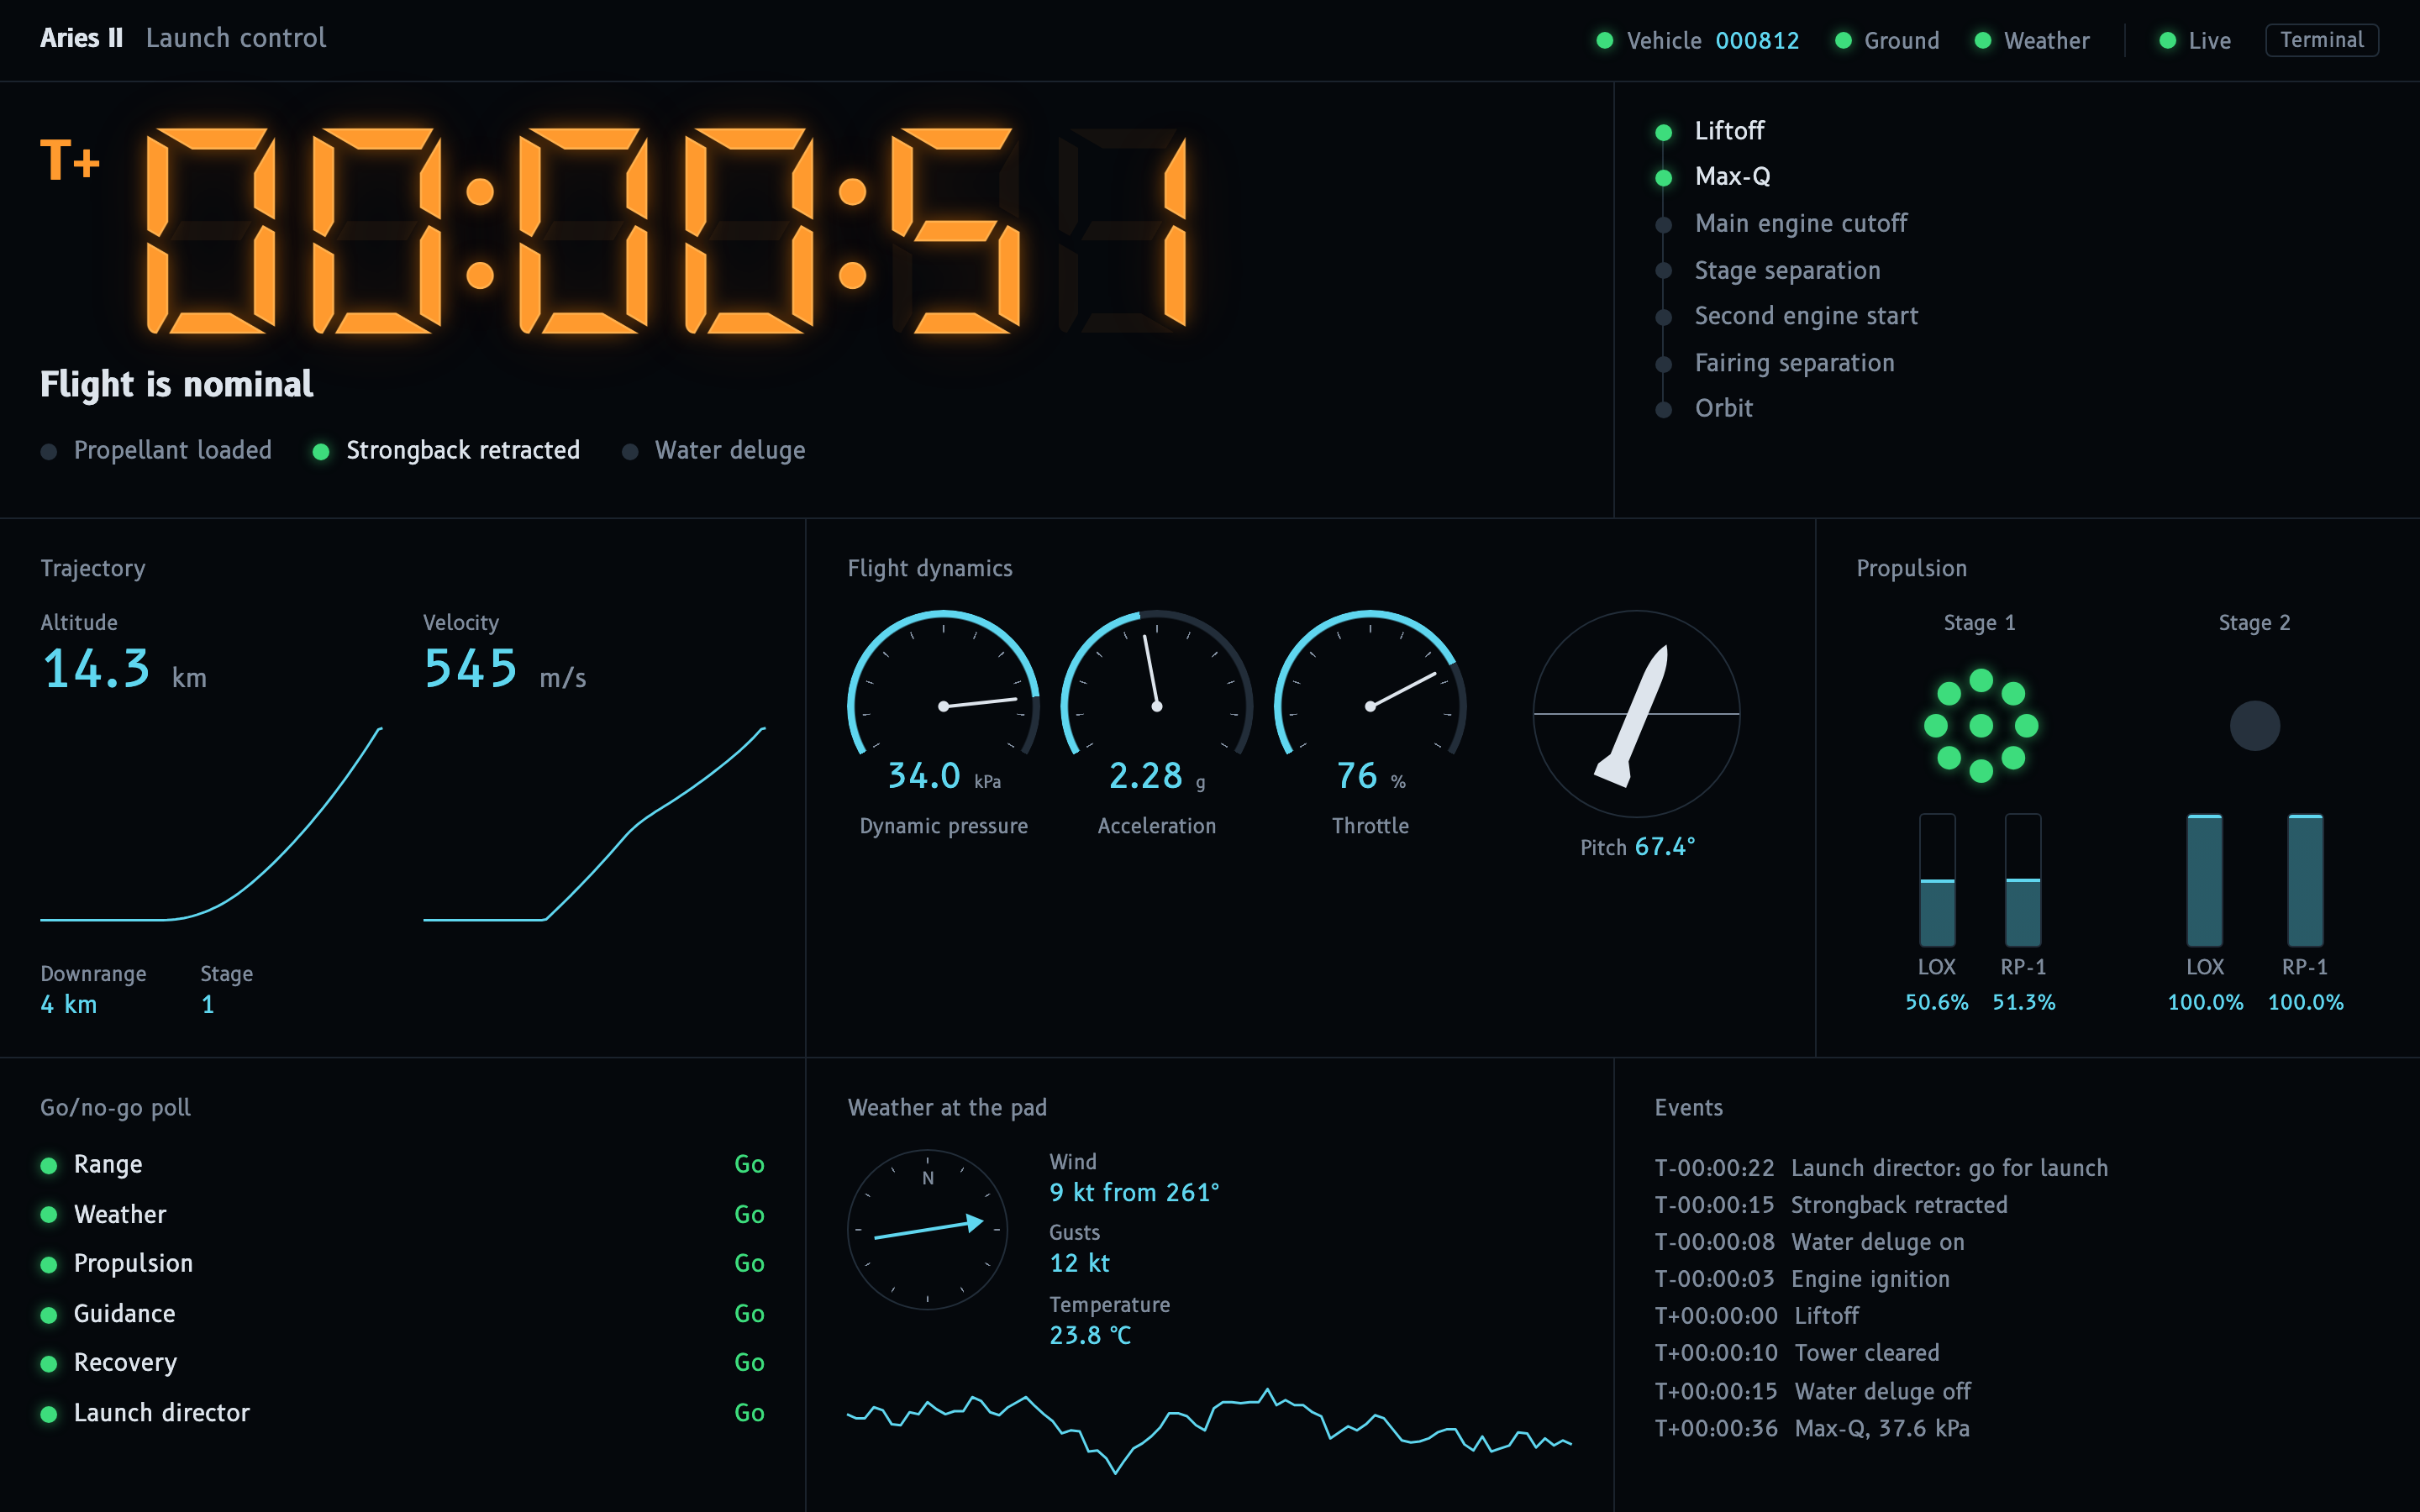
That's the launch control demo; run it with one command:
uvx --from "sightglass[web]" sightglass --demo launch --open
It's a plain HTML page fed live by three separate programs: an in-process
source, another process using Client, and plain HTTP posts. Its gauges,
tanks and lamps are drawn by CSS from the values; the page has no JavaScript
of its own. The source is in src/sightglass/launch/.
Add --theme terminal for a phosphor-terminal look (themes), or
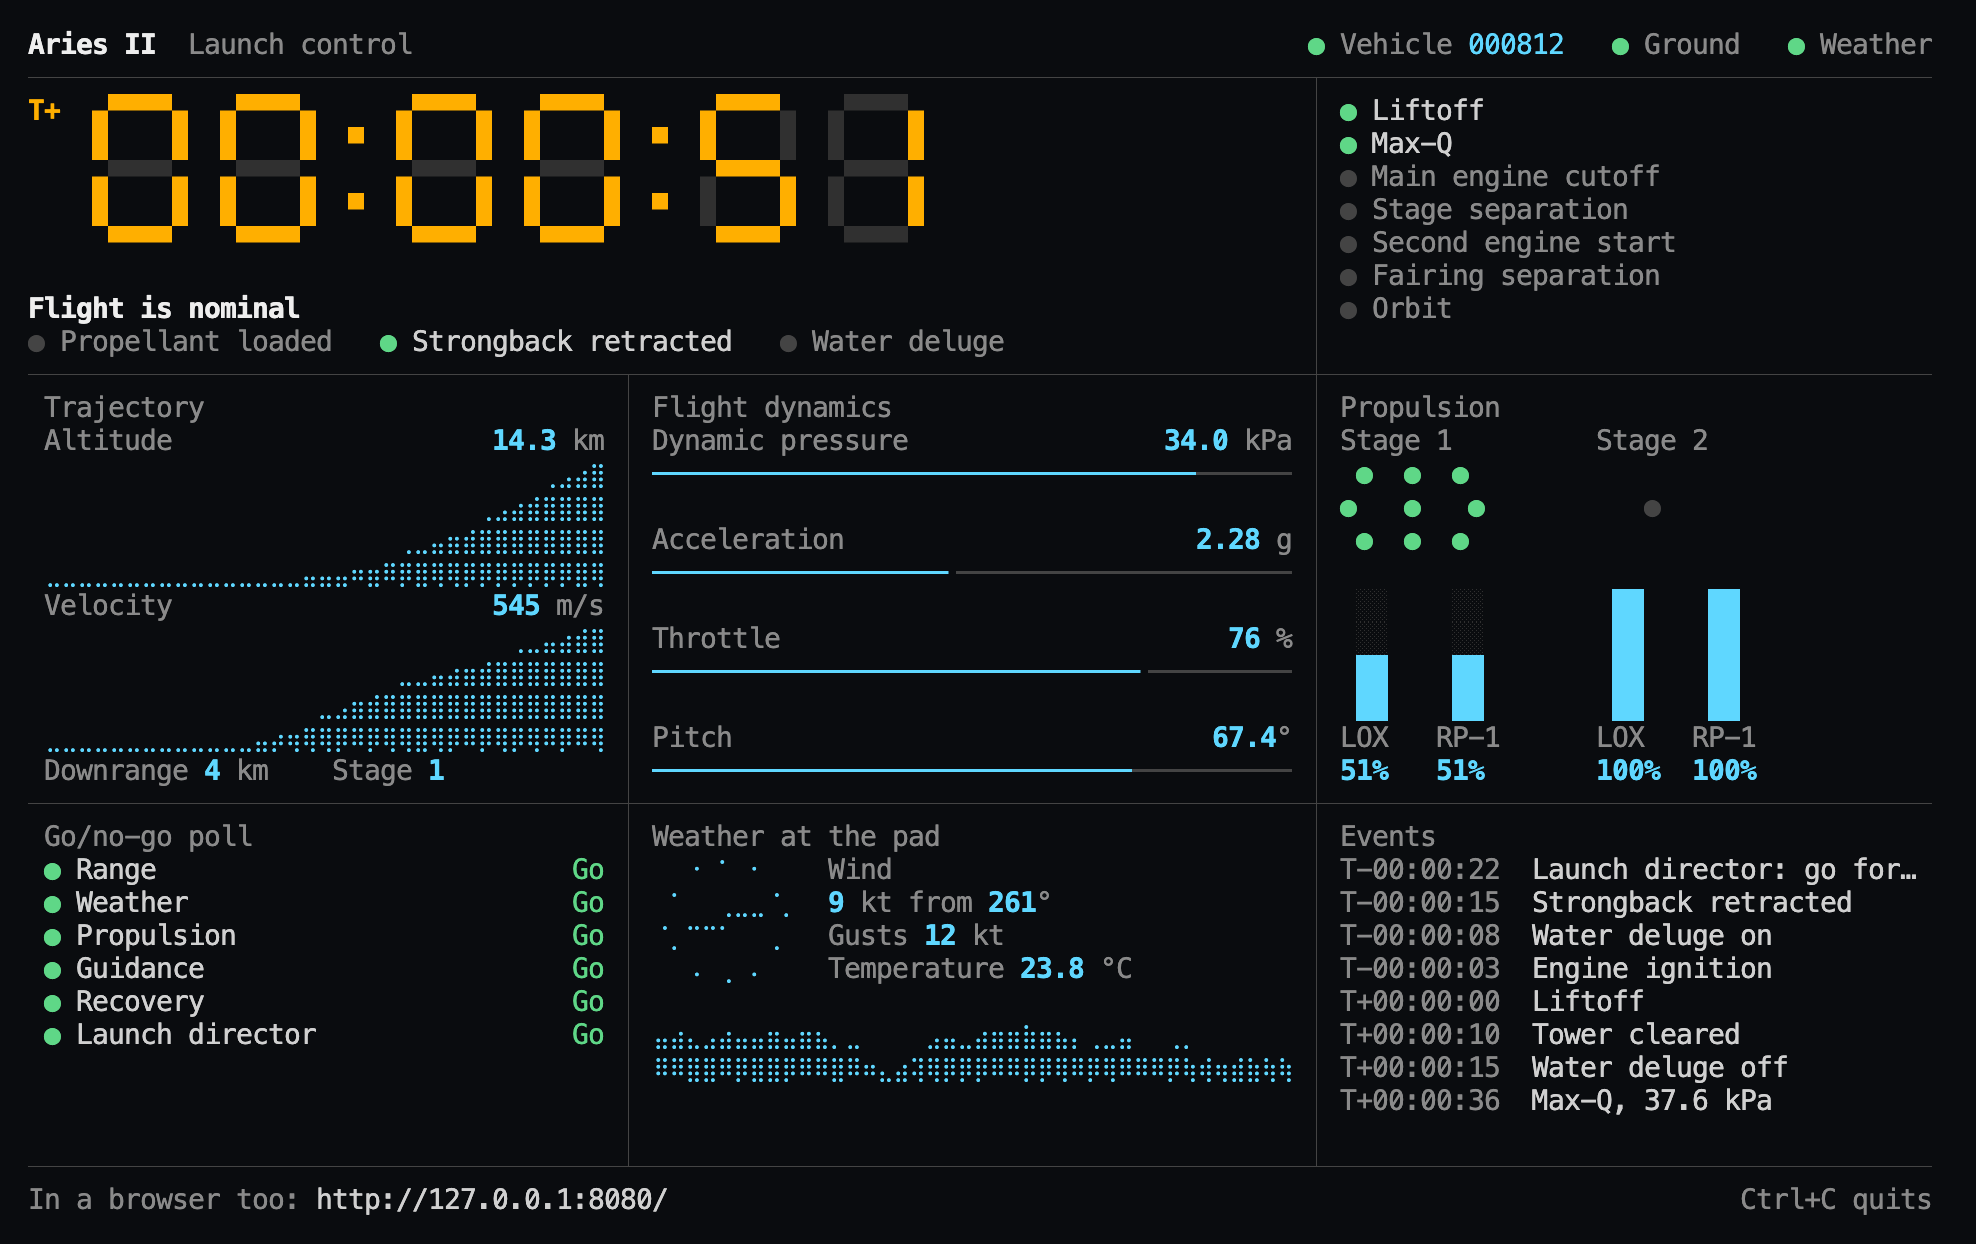
--terminal and the same launch is drawn in the terminal as well, laid out by
a screen function of its own (screen.py):
- One line to start.
start()serves a dashboard in the background and prints its address;monitor.set("progress", 5)works from any thread, and elements appear the first time you use them. - No code needed. Pipe a program into
sightglass,curlvalues to it, or point it at a serial port, a ZeroMQ socket or a Beckhoff PLC. - Any language.
POST /updatewith JSON orkey=valuelines. - Keeps up with fast devices. Serial and ZeroMQ are read on background threads and drained completely, so the display never falls behind and a stalled device can't freeze it.
- Honest about staleness. Pages reconnect by themselves, show how old the data is, and dim values while disconnected or (optionally) when a source goes quiet; a page fed by several sources can show which one stopped.
- Plain HTML dashboards. Mark any element
data-bind="<id>"and it stays live; CSS can turn values into gauges, levels and lamps, like the panel above. Otherwise a clean generic page is generated. - See what actually arrives. Press
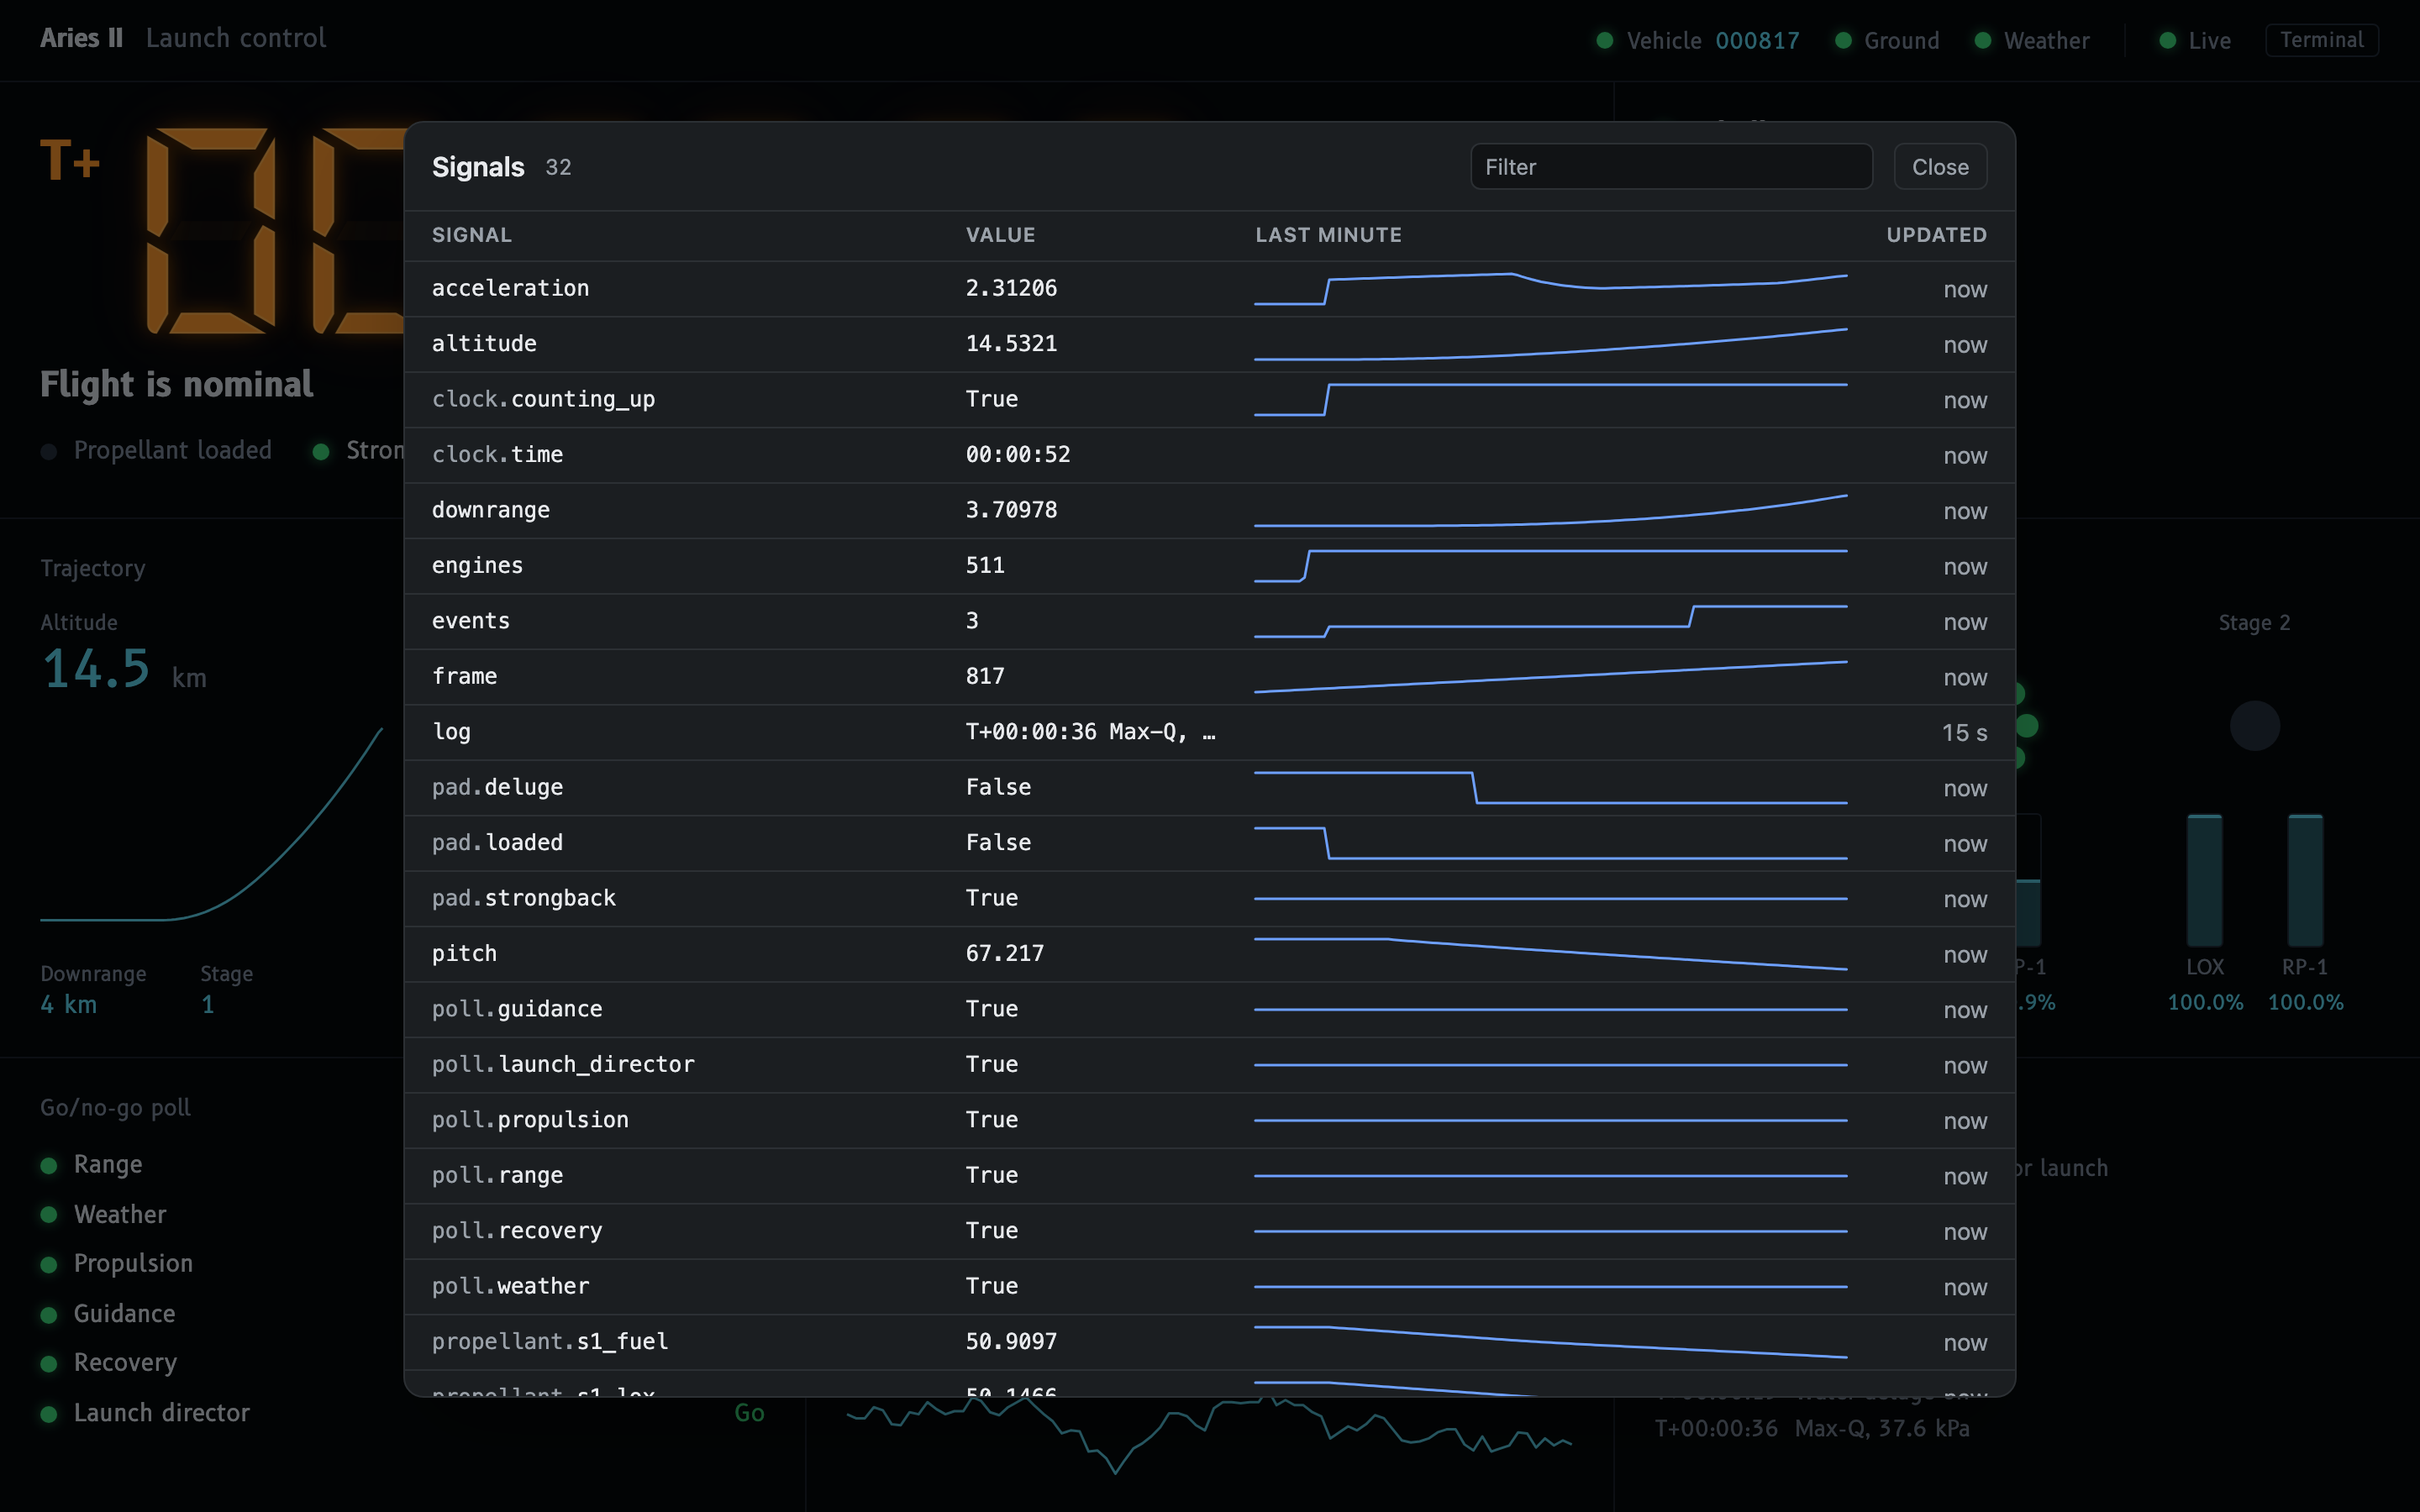
`on any dashboard page for the signals panel: every id received, its value as sent and a chart of its last minute, so a misspelt id or a feed that stopped is obvious.
Install
Requires Python 3.11+.
pip install "sightglass[web]" # add serial, zmq, ads, or use [all]
Try it: sightglass --demo launch --open runs the page above;
sightglass --demo --open shows every kind of display on the generic page.
Quick start
From inside a Python program
import time

from sightglass import start

monitor = start()  # prints "Dashboard: http://127.0.0.1:8080/"

for i in range(1, 101):
    time.sleep(0.1)  # your work
    monitor.set("progress", i)
    monitor.set("status", "running" if i < 100 else "done")
set() returns immediately and is safe from any thread. Each new id becomes
an element (a lamp for True/False, text otherwise; ids like "job.rate"
are grouped under job). Long floats are shortened to 6 significant digits.
The dashboard stops when your program exits, or call monitor.stop().
Without writing code
# Pipe a program: lines like "progress=5 status=running" or JSON objects
# become values; everything else is printed as usual.
my_program | sightglass

# Push values from anything: shell scripts, cron jobs, other languages.
sightglass &
curl -d 'temperature=21.5 status=ok' http://127.0.0.1:8080/update
curl -d '{"job": {"progress": 5}}' http://127.0.0.1:8080/update
curl http://127.0.0.1:8080/values     # what the dashboard shows, as JSON

# Read a device.
sightglass --serial auto --csv temperature,humidity
sightglass --zmq tcp://localhost:5556
sightglass --ads 5.12.34.56.1.1 --vars 'MAIN.*'    # a Beckhoff PLC
sightglass --help lists every option, including --terminal to draw in the
terminal instead of the browser (its log messages then go to
sightglass.log).
From a separate Python program
The client uses only the standard library, so the program sending values doesn't need the dashboard's dependencies:
from sightglass import Client

dashboard = Client()  # http://127.0.0.1:8080
dashboard.set("progress", 5)
dashboard.update({"rate": 18.6, "status": "running"})
Updates are sent in order in the background. If the dashboard isn't running
yet they're kept and retried, and anything pending is sent when your program
exits, so even a two-line script's values arrive. Pass token= if the
dashboard was given one. For one message,
from sightglass.client import send and send({"status": "done"}).
Choosing how values look
Declare elements for bars, charts, units and number formats. Anything you don't declare still appears as text.
from sightglass import Monitor, ProgressBar, Sparkline, TextFormat

monitor = Monitor()
monitor.add(
    ProgressBar("progress", total=500, label="Progress"),
    Sparkline("rate", label="Items/s", format=TextFormat(precision=1)),
)
monitor.start()
| Element | Shows | Update with |
|---|---|---|
TextElement |
a value, optionally scaled and number-formatted | any value |
Sparkline |
a number and a chart of its recent history (interval=1: one point a second, for longer spans of fast values) |
a number |
ProgressBar |
a filling bar from 0 to total |
a number |
RangeBar |
a marker on a min to max track | a number |
IndicatorLamp |
on/off | True/False, 1/0, on/off |
MachineState |
named on/off states packed into one integer | an integer (bit 0 = first state) |
Coordinate |
a multi-axis position | a list, or per axis: "<id>.x" |
Table |
a grid of cells | per cell: "<id>.<row>.<column>" |
LogMonitor |
the latest messages | a string |
Multi-part elements take updates to a field, addressed as "<id>.<field>".
monitor.add_group("X", [...]) adds copies of elements under a heading with
ids X.<id>, so one list can serve several axes.
TextFormat(width, precision, force_sign, padding) formats numbers:
TextFormat(width=10, precision=3, force_sign=True, padding="0") turns 27.31
into +00027.310. Style(fg, bg, bold, dim) adds colour in the terminal:
a colour name, or one of xterm's 256 colour numbers (Style(fg=214) is amber).
For a fixed, curated dashboard use Monitor(strict=True): unknown ids are
then rejected and logged (once per id) instead of creating elements.
max_elements (default 500) stops a noisy link creating elements without end.
Running
| Call | Runs |
|---|---|
monitor.start(sources=..., outputs=...) |
in a background thread; returns once the dashboard is up (setup errors such as a busy port are raised here) |
monitor.serve(sources=..., outputs=...) |
in the foreground until Ctrl+C, then returns quietly |
await monitor.run(sources=..., outputs=...) |
inside your own asyncio program |
outputs defaults to a WebDashboard() for start() and serve(). The
monitor can also be used as a context manager: with monitor.start(): ....
Devices and other sources
from sightglass import CsvDecoder, Monitor, SerialSource

monitor = Monitor()
# The device prints one line per sample: "21.5,48,OK"
device = SerialSource(
    "auto", 115200, decoder=CsvDecoder(["temperature", "humidity", "status"])
)
monitor.serve(sources=[device])
| Source | Reads |
|---|---|
SerialSource(port, baudrate, decoder=...) |
a serial port ("auto" picks the first USB device); waits for it and reconnects |
ZmqSource(endpoint, pattern="sub") |
ZeroMQ PUB/SUB (a publisher that binds endpoint) |
ZmqSource(endpoint, pattern="pull") |
ZeroMQ PUSH/PULL: binds endpoint; unlike PUB/SUB, nothing sent before the monitor starts is lost |
AdsSource(target, variables) |
a Beckhoff TwinCAT PLC over ADS (below); can also write to it |
StdinSource() |
piped standard input, as sightglass does |
SimulatedSource(fn, rate) |
fn(seconds) called rate times a second, for demos and tests |
| Decoder | Wire format |
|---|---|
KeyValueDecoder() |
X.velocity 1.5, or key=value pairs: progress=5 status="two words" |
CsvDecoder(keys) |
1.5,-2.0,OK, values in the order of keys |
JsonDecoder() |
{"X": {"velocity": 1.5}} per line; nesting addresses groups and fields |
BinaryFrameDecoder(names, scale=1000) |
the binary frame protocol below |
Binary frame protocol
For firmware where text is too slow or too large:
0xAA | id | type | value | n | param_1 ... param_n | 0xFF
type 0x01:valueis a little-endian int32, divided byscale(1000 by default).type 0x02:valueis a NUL-terminated UTF-8 string (up to 255 bytes).idand the params are single bytes, translated throughnames({1: "X", 10: "velocity"}). The update key is the id's name followed by the params' names, so idXwith paramvelocityupdates"X.velocity".
Corrupt frames are skipped and decoding resumes at the next 0xAA.
Beckhoff TwinCAT PLCs (ADS)
Install the ads extra (pip install "sightglass[web,ads]"), then give
sightglass the PLC's AMS net id and the variables to show; * matches any
characters:
sightglass --ads 5.12.34.56.1.1 --vars 'MAIN.*,GVL.fTemperature'
All the variables are read in one ADS request every 0.1 s and shown under
their PLC names. Structs and arrays become one value per member
(MAIN.stAxis.fPosition, GVL.aTemps[1]), BOOLs become lamps, and the
variables are looked up again whenever a new program is downloaded.
For a lasting dashboard, describe the PLC in an interface file, with the types pasted from the PLC project (examples/plc.toml is a commented one):
target = "5.12.34.56.1.1:851"
types = """
TYPE ST_Axis :
STRUCT
    fPosition : LREAL;
    bEnabled  : BOOL;
END_STRUCT
END_TYPE
"""

[variables]
"MAIN.stAxis1" = "ST_Axis"           # one value per member
"GVL.fTemperature" = {}              # the PLC says what it is
"MAIN.*" = {}                        # every plain top-level variable in MAIN
"GVL.nSetpoint" = { write = true }   # may be written: see below
sightglass --ads plc.toml reads it. types takes struct, enum and alias
declarations as TwinCAT writes them, comments, initial values and
{attribute 'pack_mode' := '1'} included. Structs are laid out in memory as
TwinCAT 3 does, and each variable's size is checked against the PLC's, so a
declaration that doesn't match is reported rather than shown as wrong values.
Declared enums are shown by name. From Python:
from sightglass import AdsSource, Monitor

plc = AdsSource("5.12.34.56.1.1", ["MAIN.*", "GVL.fTemperature"])
# or AdsSource.from_file("plc.toml")
Monitor().serve(sources=[plc])
Writing. Values sent to a variable marked write = true (with curl,
Client or monitor.set) are written to the PLC, and the dashboard shows
what the PLC reads back. Nothing is written unless all of these hold:
- the variable is marked
write = true; sightglasswas started with--allow-writes(allow_writes=True);- the environment variable
SIGHTGLASS_ALLOW_WRITESis1; - the request has the dashboard's token: values for a PLC are refused over
HTTP from a dashboard without
--token.
export SIGHTGLASS_ALLOW_WRITES=1
sightglass --ads plc.toml --allow-writes --token change-me
curl -H 'Authorization: Bearer change-me' -d 'GVL.nSetpoint=75' http://127.0.0.1:8080/update
Each value is checked against its type, then against the type the PLC itself gives the variable, and a request is all or nothing. A write that is refused gets 403 (not allowed), 400 (doesn't fit) or 409 (the PLC refused it or isn't connected), and is never retried, so a setpoint can't arrive late.
Connecting. On Linux and macOS, pyads talks to the PLC directly, and the
PLC needs a static route back to this machine: its IP address, and an AMS net
id of that address followed by .1.1 (sightglass prints both if the PLC
doesn't answer). Add it in TwinCAT, or with pyads' add_route_to_plc. On
Windows, pyads goes through TwinCAT's own ADS router: install TwinCAT (XAE,
XAR or the TC1000 ADS setup) and add the route there.
Outputs
WebDashboard(page=None, static_dir=None, host="127.0.0.1", port=8080, title="Monitor", theme="classic", token=None, stale_after=None)
serves page (or the generic page), streams values over a WebSocket, accepts
POST /update and returns the current values as JSON from GET /values. stale_after=2 dims values when no data has arrived
for 2 seconds, for sources that should update continuously. theme sets the
pages' look until a viewer switches (themes). Your own page
loads /_sightglass/sightglass.js and marks up elements:
<link rel="stylesheet" href="/_sightglass/panel.css">

<span data-bind="temperature"></span>                                  <!-- text -->
<div class="led" data-bind="machine.estop" data-mode="state"></div>    <!-- data-state="on"/"off" -->
<div class="bar" data-bind="X.velocity.ratio" data-mode="width"></div> <!-- width: 0-100% -->
<div data-bind="rate.values" data-mode="sparkline"></div>              <!-- line chart -->
<div class="dial" data-bind="pressure.ratio" data-mode="var"></div>    <!-- CSS variable --value -->
<span data-bind="wind" data-stale-after="3"></span>                    <!-- data-stale="true" once quiet -->

<!-- A segment display: data-ghost draws the unlit segments. -->
<div class="lcd">
  <span class="lcd-field" data-ghost="~~~~~~.~~~"><span data-bind="position_x"></span></span>
</div>

<script src="/_sightglass/sightglass.js"></script>
data-mode="var" sets the CSS variable --value to the number, so CSS alone
can draw a needle (rotate: calc(var(--value) * 270deg)) or a fill level
(height: calc(var(--value) * 100%)). data-stale-after="<seconds>" marks an
element data-stale="true" while its value hasn't arrived for that long, so a
page fed by several sources can show which one has gone quiet
(stale_after does this for the page as a whole).
Object values are flattened, so a RangeBar binds as <id>.text and
<id>.ratio, a Sparkline as <id>.text and <id>.values, and a
MachineState as <id>.<state>. panel.css provides the segment display
(.lcd, .lcd-field) and LED (.led, .led-red, .led-amber) styles.
Files in static_dir are served under /static/.
Signals panel
Every page that loads sightglass.js (the generic page, the launch demo,
yours) has a panel for checking what a feed sends: press ` (or click
Signals on the generic page, or an element of yours marked
data-signals-open). It lists every id the dashboard has accepted, its latest
value as sent (before an element scales or formats it), how long ago it
arrived, and a chart of its last minute. The charts share one time axis, so
what changed together lines up; the line reaches the lowest and highest value
of each half second, so a fast swing isn't lost, and booleans and on/off chart
as steps. Type to filter by id; ` or Escape closes it. It streams over a
WebSocket of its own (/ws/signals) only while open.
Themes
The generic page and the launch demo come in two themes: classic, and terminal, a phosphor-green terminal whose instruments borrow from an early glass cockpit's CRTs: gauges with filled sectors, caution bands and red limits, boxed readouts, scales, and a red X over anything whose data has stopped. Its CRT effects, on a switch of their own, are still (glow, scanlines, the tube's rounded corners and glass) and moving (a power-on that draws each panel and types its name, the refresh rolling down the screen, a faint flicker); the moving ones are left out for anyone whose system asks for reduced motion.
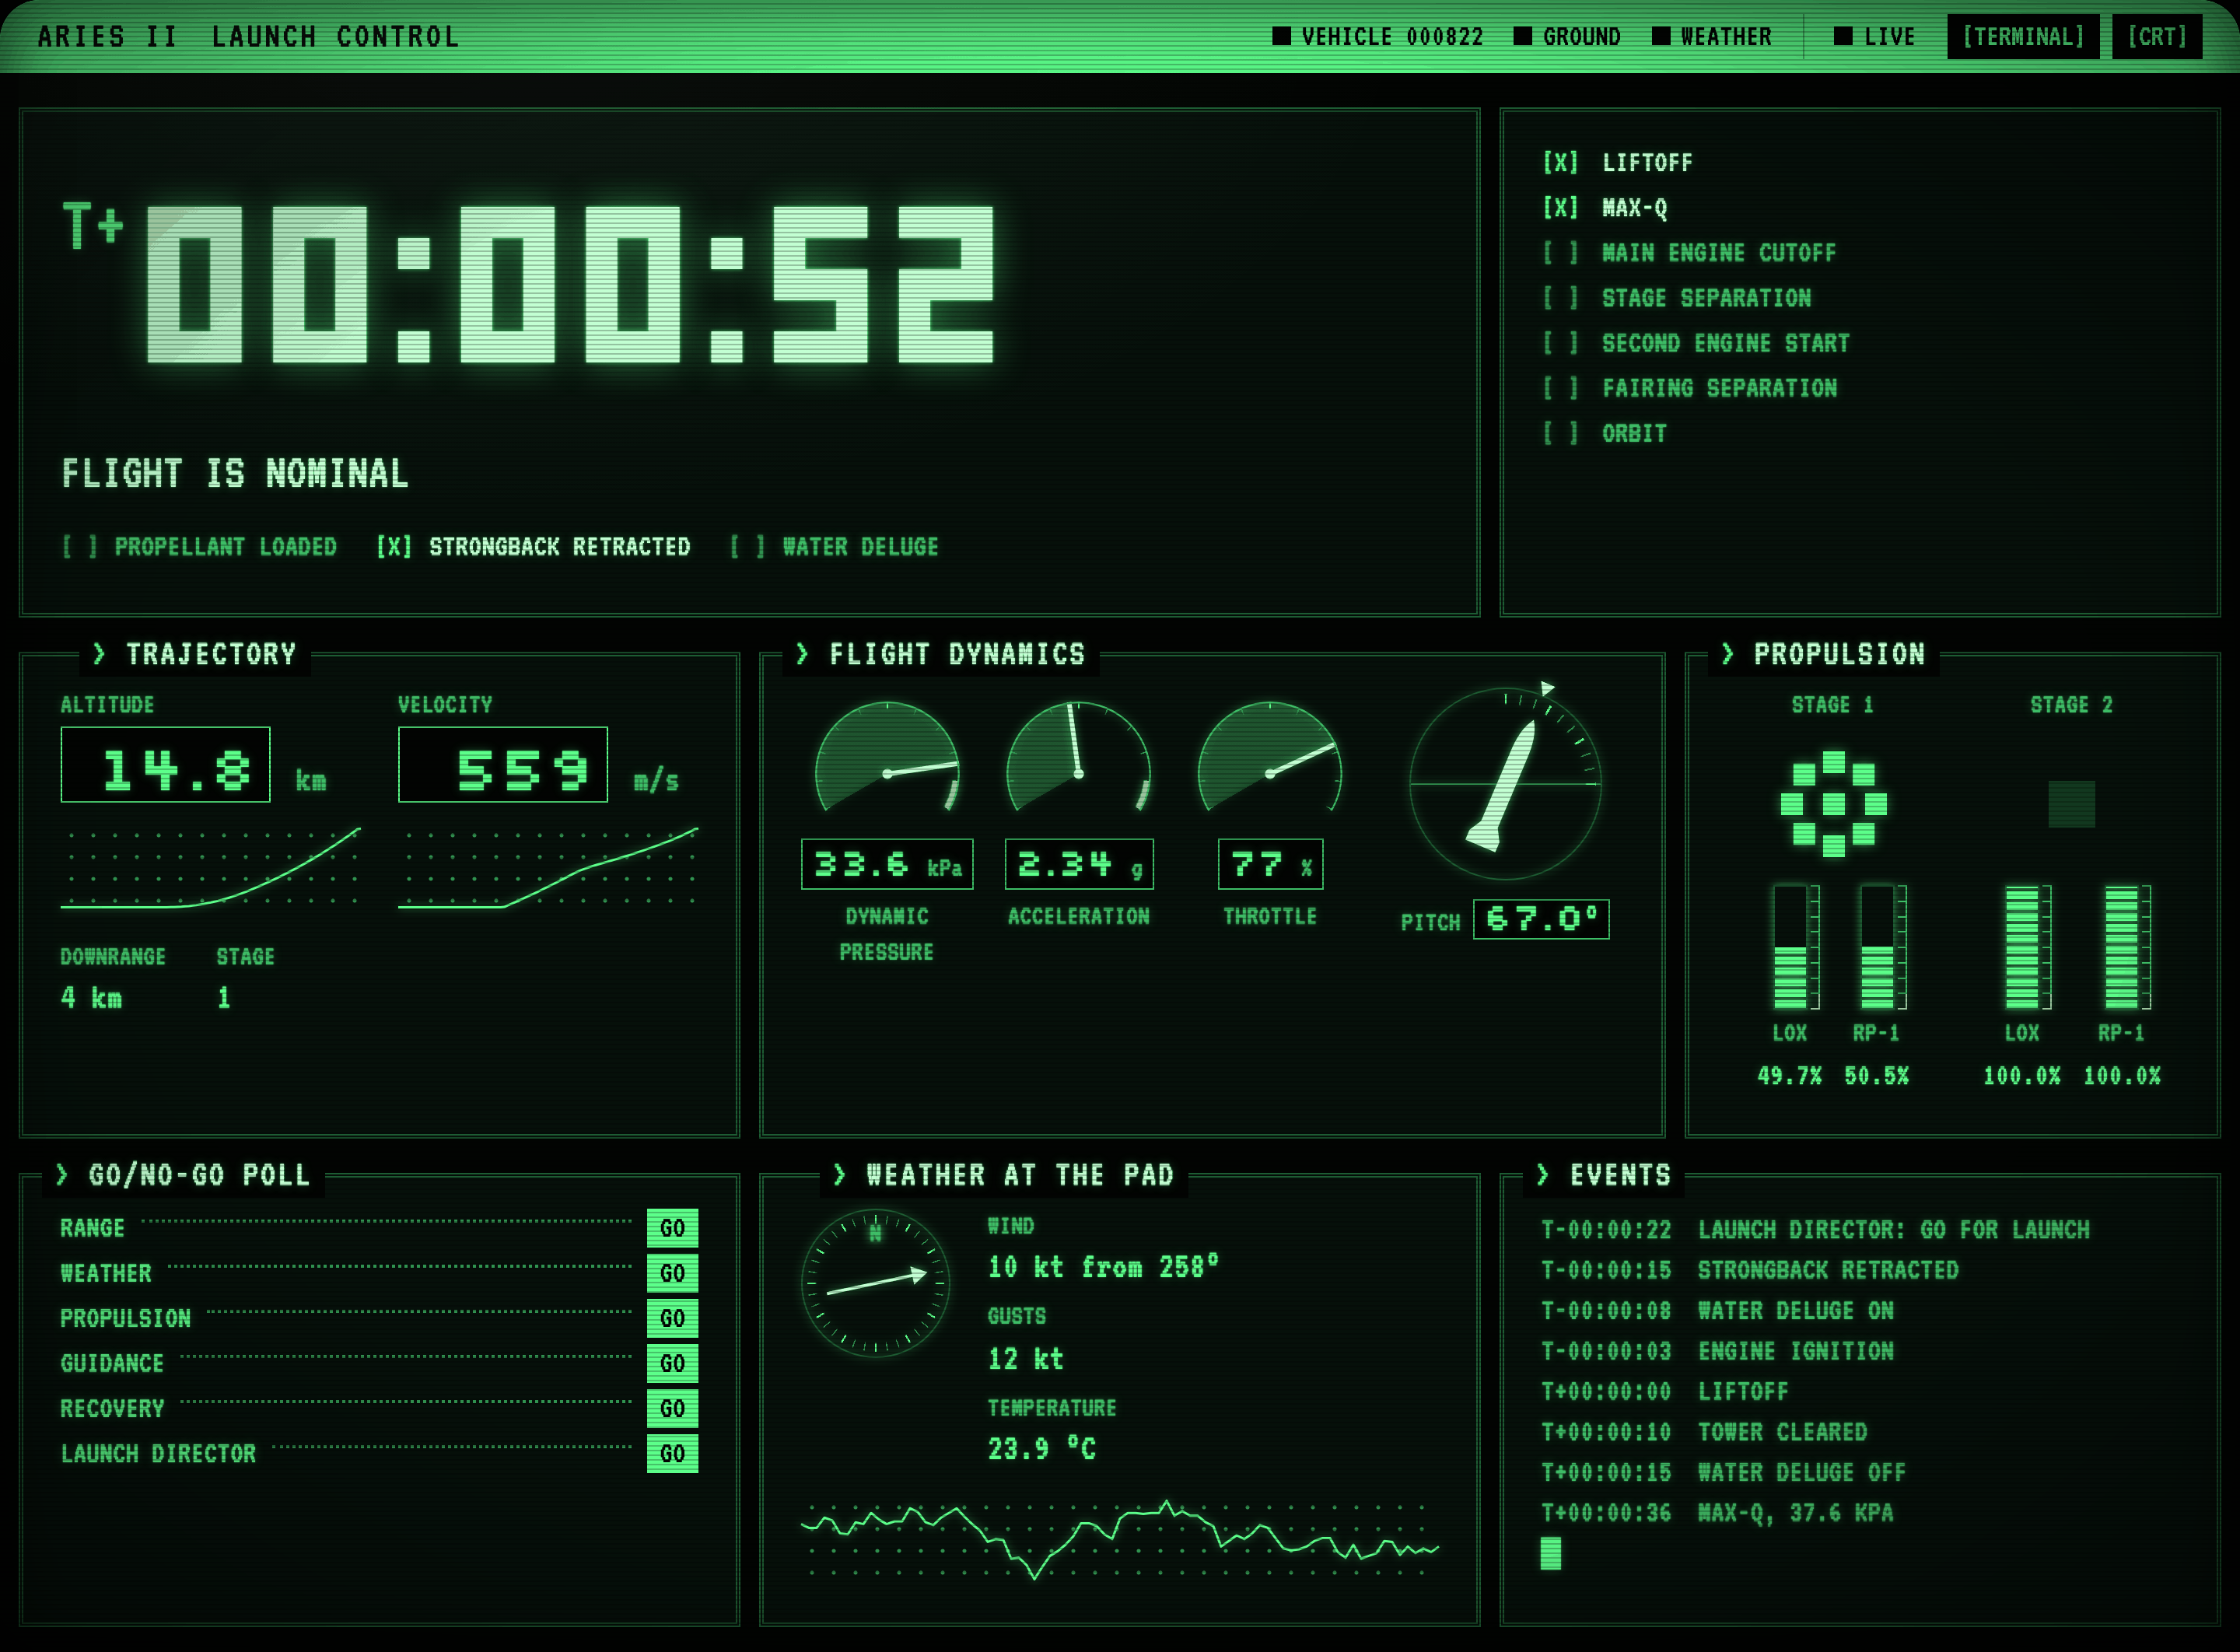
--theme terminal or WebDashboard(theme="terminal") sets the default; a
switch on the page lets each viewer change it, and their browser remembers.
Your own page can offer both:
<head>
  <script src="/_sightglass/theme.js"></script>          <!-- html[data-theme], html[data-crt] -->
  <link rel="stylesheet" href="/_sightglass/terminal.css"> <!-- fonts, --crt-* colours, CRT effects -->
</head>

<button data-theme-switch>Terminal</button>  <!-- aria-pressed while the terminal theme is on -->
<button data-crt-switch>CRT</button>
then style it under html[data-theme="terminal"] with the --crt-* colours
(--crt-fg, --crt-dim, --crt-bright, --crt-amber, ...) and fonts:
--crt-font (VT323) for text, and two pixel fonts for numbers,
--crt-display-font (Micro 5) for a big display like a clock and
--crt-readout-font (Silkscreen) for readings. Pixel fonts are sharp only at
whole pixels: give Micro 5 multiples of 11px and Silkscreen multiples of 8px.
terminal.css draws the CRT effects over any page; for the power-on, give
your panels its keyframes, crt-draw (drawn top to bottom, with steps())
and crt-type (typed in), inside
@media (prefers-reduced-motion: no-preference). theme.js sets the theme
before anything is drawn, so the page never flashes the other one.
TerminalDisplay(width=60, fps=30, screen=None) draws a full-screen view
in the terminal's alternate screen. Log to a file while it runs; anything
printed to the terminal gets drawn over. By default it lists every element;
for a layout of your own, the terminal's counterpart of a custom page, pass
screen: a function of (monitor, width, height) that returns the whole
frame for a terminal that size, reading values from the elements
(monitor["rate"].text) and colouring them with Style. A screen is redrawn
at least once a second, so it can show how old values are
(monitor.ages()). The launch demo's screen.py is a full example.
Network access and security
The dashboard listens on 127.0.0.1 by default, so only the same machine can
see it. With host="0.0.0.0" (or --host 0.0.0.0) anyone who can reach the
port can view the values and, unless you set token, post updates. Viewing
has no authentication and traffic is not encrypted: on untrusted networks,
reach the dashboard through an SSH tunnel or a reverse proxy with TLS and
authentication.
Values for a device (a PLC variable marked write = true) are only accepted
from programs that send the token. The token crosses the network as plain
text unless the dashboard is behind TLS, so a dashboard that can write to a
PLC from other machines needs the tunnel or proxy too.
Examples
examples/ is a gallery where each example shows one way to feed a dashboard and runs with a single command, with nothing to clone or install beyond uv:
| Example | Shows | |
|---|---|---|
| Demo | every kind of display | uvx --from "sightglass[web]" sightglass --demo --open |
| Launch control | the page above: a custom panel fed by three programs | run |
| 1. Hello | a Python program with start() and set() |
run |
| 2. System monitor | this computer, live: charts, bars, a table | run |
| 3. From the shell | any language, over HTTP with curl | run |
| 4. Pipe | a program's printed output | run |
| 5. Many processes | several programs, one dashboard, with Client |
run |
| 6. Docker | deployed as a service, fed over the network | run |
| 7. Terminal | drawn in the terminal | run |
| 8. Custom panel | a segment-display panel, over serial | run |
| 9. Beckhoff PLC | a TwinCAT PLC over ADS, from an interface file | run |
Extending
- Element: subclass
Elementand implementupdate(value),to_json()(what the browser receives) andrender(width)(terminal text). Overrideupdate_fieldto accept"<id>.<field>"updates. - Wire format: subclass
LineDecoderand implementdecode_line(line) -> {id: value}, raisingDecodeErrorfor bad input; or subclassDecoderfor binary formats. - Source: any object with an async generator method
updates()that yields lists of{id: value}mappings. A source that can also write to its device addsclaims(id)(true for its ids) andasync def write(update), raisingWriteError; values sent to its ids then go towrite()(seeSourceinmonitor.py). - Output: any object with
async def run(monitor), and optionallyasync def start(monitor)for setup that can fail andasync def flush(monitor)to deliver the last values beforeMonitor.stop()shuts down. Useawait monitor.wait_for_change(version)andmonitor.changes_since(version)to react to new data, andmonitor.ages()for how long ago each element was updated.
For AI coding agents
sightglass --guide prints a concise, recipe-first guide to building and
deploying monitors, written for coding agents (it is also imported by this
repository's CLAUDE.md). To make it discoverable in another project, add a
line like this to that project's CLAUDE.md or AGENTS.md:
- Live dashboards for this project: `sightglass`; run `sightglass --guide` before building one.
See CONTRIBUTING.md for development and releases.
License
MIT. The bundled DSEG fonts are © keshikan, licensed under the SIL Open Font
License 1.1 (src/sightglass/web/static/fonts/DSEG-LICENSE.txt). The launch
control example's B612 fonts are © The B612 Project Authors, under the same
license (src/sightglass/launch/static/fonts/B612-LICENSE.txt), as are the
terminal theme's VT323, © The VT323 Project Authors, Micro 5, © The Soft Type
Project Authors, and Silkscreen, © The Silkscreen Project Authors
(VT323-LICENSE.txt, Micro5-LICENSE.txt and Silkscreen-LICENSE.txt in
src/sightglass/web/static/fonts/).
1 maintainer

Metadata
1 maintainer
Release files for sightglass 0.2.0
For a detailed explanation of source distributions (sdists) and built distributions (wheels), please see the package formats documentation.
Source distribution (sdist)
| File | Size | Uploaded | |
|---|---|---|---|
| sightglass-0.2.0.tar.gz | 237.7 kB | Details |
Built distribution (wheel)
| File | Interpreter | ABI | Platform | Reset |
|---|---|---|---|---|
| sightglass-0.2.0-py3-none-any.whl | Python 3 | none | any | Details |
Total release size: 462.1 kB
Release files / sightglass-0.2.0.tar.gz
| Download URL | sightglass-0.2.0.tar.gz |
|---|---|
| Size | 237.7 kB |
| Tags | Source |
|
SHA-256 checksum How to use checksums |
c2d6b5a0b0d17008b33d5bd1766edd373d8da6dc2fd2b653b27c229f16f2558f
|
|
BLAKE2b-256 checksum How to use checksums |
93a8c29c859a0e8bd687fa5f7459b3844b69e9c60064c82d8e50d1949f5c5ad3
|
| Upload date | |
|
Uploaded using Trusted Publishing? What is trusted publishing? |
Yes |
| Uploaded via |
twine/7.0.0 CPython/3.13.14
|
Provenance
Provenance describes where a file came from. On PyPI, provenance is shared via attestations, which provide a verifiable record of the build or publishing details. View details, limitations and caveats.


PyPI Publish Attestation
PyPI verified that this artifact, at this checksum, originated from the publisher listed below.
Signed by GitHub Actions, verified by PyPI on Oct 1, 2026.
Transparency logRelease files / sightglass-0.2.0-py3-none-any.whl
| Download URL | sightglass-0.2.0-py3-none-any.whl |
|---|---|
| Size | 224.4 kB |
| Tags | Python 3 |
|
SHA-256 checksum How to use checksums |
368b4f19cd8e8366a39009516b52c9b144fa4fc5de44f128b2a5325c6543830b
|
|
BLAKE2b-256 checksum How to use checksums |
35c126b876489e199e45f42e8188ce49715589927b5ce45428339768cc2cd0a6
|
| Upload date | |
|
Uploaded using Trusted Publishing? What is trusted publishing? |
Yes |
| Uploaded via |
twine/7.0.0 CPython/3.13.14
|
Provenance
Provenance describes where a file came from. On PyPI, provenance is shared via attestations, which provide a verifiable record of the build or publishing details. View details, limitations and caveats.
PyPI Publish Attestation
PyPI verified that this artifact, at this checksum, originated from the publisher listed below.
Signed by GitHub Actions, verified by PyPI on Oct 1, 2026.
Transparency log












