Quantify the difference between two arbitrary curves in space

Project description
similaritymeasures


Quantify the difference between two arbitrary curves
Curves in this case are:
- discretized by inidviudal data points
- ordered from a beginning to an ending
Consider the following two curves. We want to quantify how different the Numerical curve is from the Experimental curve. Notice how there are no concurrent Stress or Strain values in the two curves. Additionally one curve has more data points than the other curves.
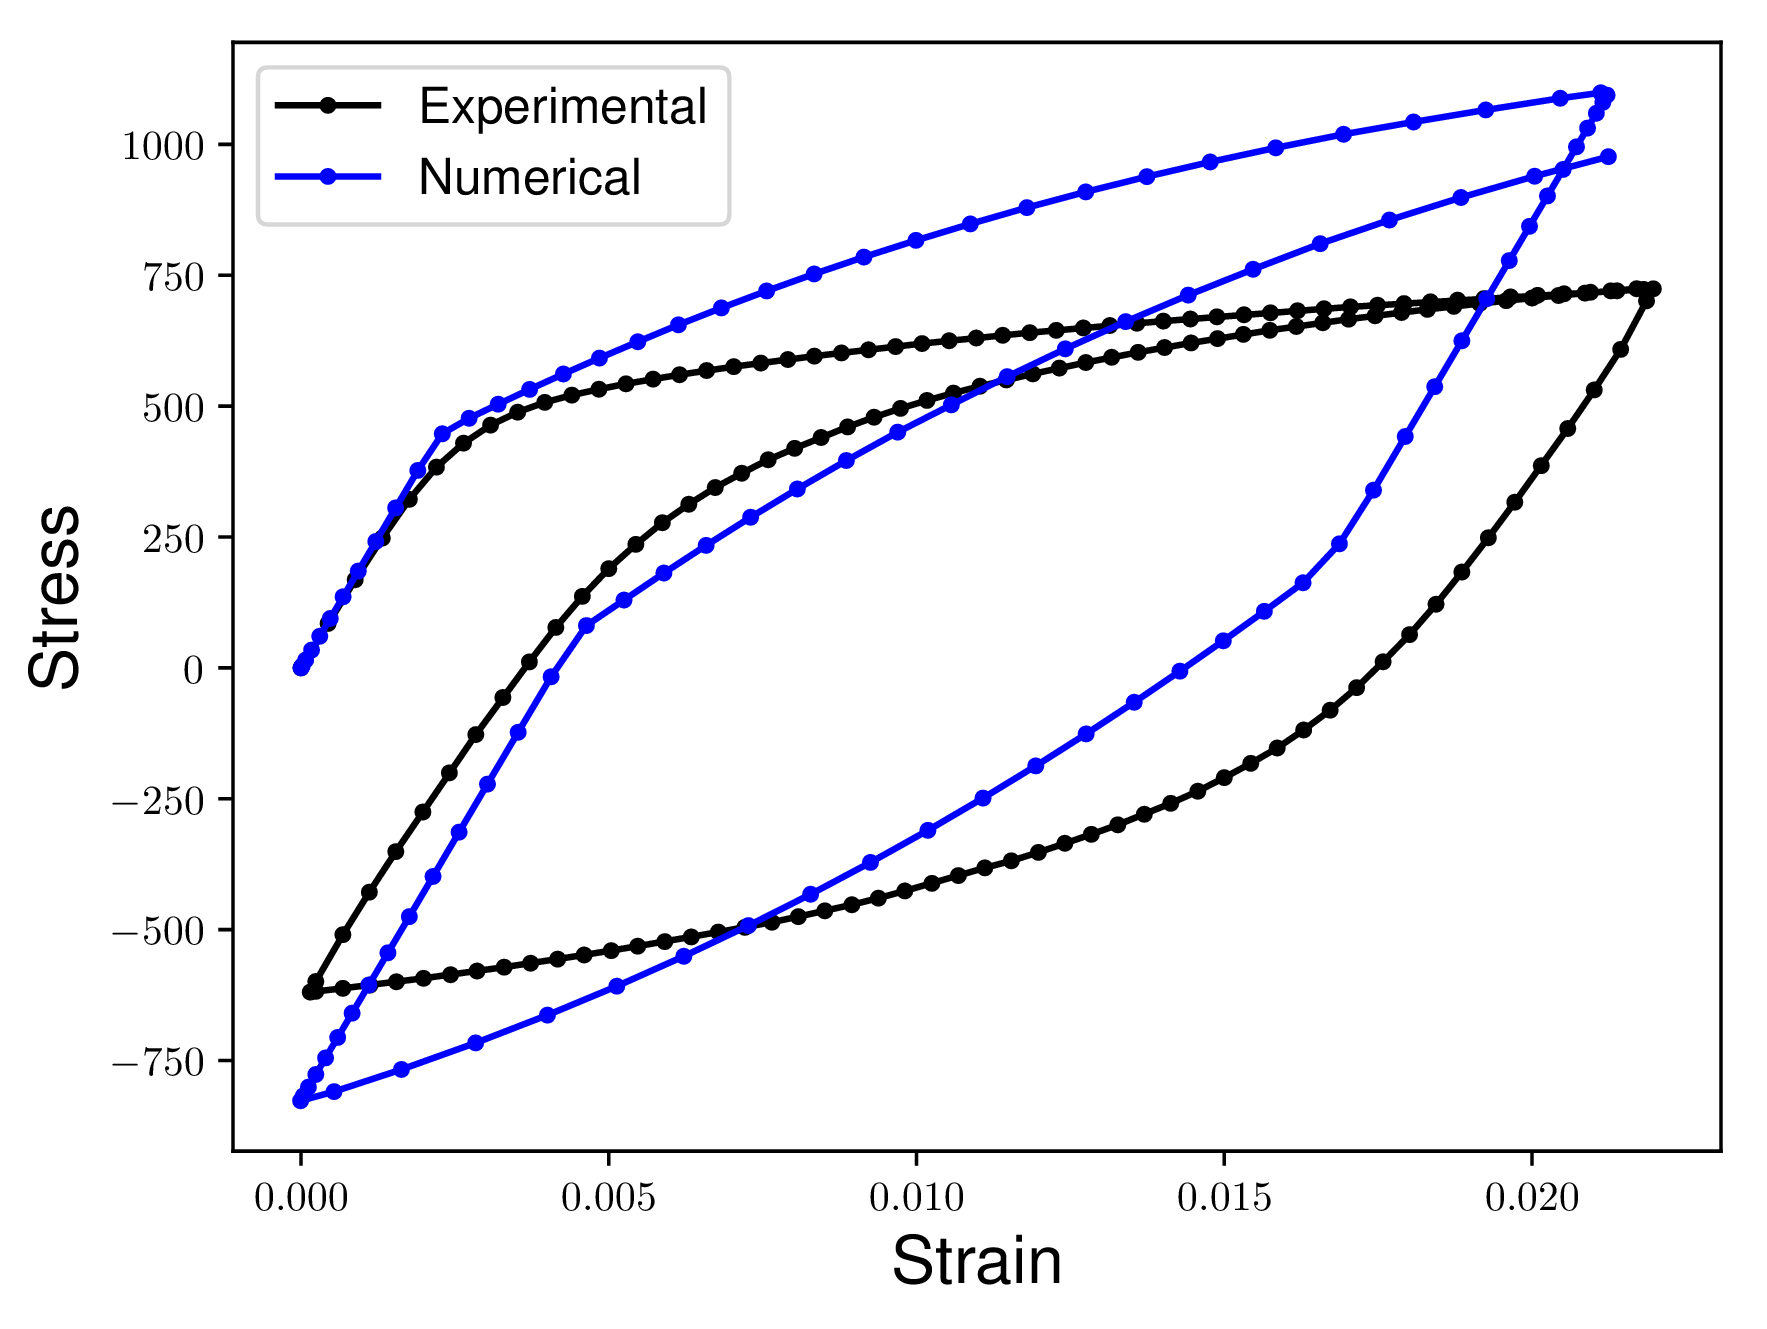
In the ideal case the Numerical curve would match the Experimental curve exactly. This means that the two curves would appear directly on top of each other. Our measures of similarity would return a zero distance between two curves that were on top of each other.
Methods covered
This library includes the following methods to quantify the difference (or similarity) between two curves:
- Partial Curve Mappingx (PCM) method: Matches the area of a subset between the two curves [1]
- Area methodx: An algorithm for calculating the Area between two curves in 2D space [2]
- Discrete Frechet distancey: The shortest distance in-between two curves, where you are allowed to very the speed at which you travel along each curve independently (walking dog problem) [3, 4, 5, 6, 7, 8]
- Curve Lengthx method: Assumes that the only true independent variable of the curves is the arc-length distance along the curve from the origin [9, 10]
- Dynamic Time Warpingy (DTW): A non-metric distance between two time-series curves that has been proven useful for a variety of applications [11, 12, 13, 14, 15, 16]
- Mean absolute errory,z (MAE): A L1 error that requires curves to have the same number of data points and dimensions. See this wiki page.
- Mean squared errory,z (MSE): A L2 error that requires curves to have the same number of data points and dimensions. See this wiki page.
x denotes methods created specifically for material parameter identification
y denotes that the method implemented in this library supports N-D data!
z denotes that the method requires each curve to have the same number of data points
Installation
Install with pip
python -m pip install similaritymeasures
or clone and install from source.
git clone https://github.com/cjekel/similarity_measures
python -m pip install ./similarity_measures
Example usage
This shows you how to compute the various similarity measures
import numpy as np
import similaritymeasures
import matplotlib.pyplot as plt

# Generate random experimental data
x = np.random.random(100)
y = np.random.random(100)
exp_data = np.zeros((100, 2))
exp_data[:, 0] = x
exp_data[:, 1] = y

# Generate random numerical data
x = np.random.random(100)
y = np.random.random(100)
num_data = np.zeros((100, 2))
num_data[:, 0] = x
num_data[:, 1] = y

# quantify the difference between the two curves using PCM
pcm = similaritymeasures.pcm(exp_data, num_data)

# quantify the difference between the two curves using
# Discrete Frechet distance
df = similaritymeasures.frechet_dist(exp_data, num_data)

# quantify the difference between the two curves using
# area between two curves
area = similaritymeasures.area_between_two_curves(exp_data, num_data)

# quantify the difference between the two curves using
# Curve Length based similarity measure
cl = similaritymeasures.curve_length_measure(exp_data, num_data)

# quantify the difference between the two curves using
# Dynamic Time Warping distance
dtw, d = similaritymeasures.dtw(exp_data, num_data)

# mean absolute error
mae = similaritymeasures.mae(exp_data, num_data)

# mean squared error
mse = similaritymeasures.mse(exp_data, num_data)

# print the results
print(pcm, df, area, cl, dtw, mae, mse)

# plot the data
plt.figure()
plt.plot(exp_data[:, 0], exp_data[:, 1])
plt.plot(num_data[:, 0], num_data[:, 1])
plt.show()
If you are interested in setting up an optimization problem using these measures, check out this Jupyter Notebook which replicates Section 3.2 from [2].
Changelog
Version 0.3.0: Frechet distance now supports N-D data! See CHANGELOG.md for full details.
Documenation
Each function includes a descriptive docstring, which you can view online here.
References
[1] Katharina Witowski and Nielen Stander. Parameter Identification of Hysteretic Models Using Partial Curve Mapping. 12th AIAA Aviation Technology, Integration, and Op- erations (ATIO) Conference and 14th AIAA/ISSMO Multidisciplinary Analysis and Optimization Conference, sep 2012. doi: doi:10.2514/6.2012-5580.
[2] Jekel, C. F., Venter, G., Venter, M. P., Stander, N., & Haftka, R. T. (2018). Similarity measures for identifying material parameters from hysteresis loops using inverse analysis. International Journal of Material Forming. https://doi.org/10.1007/s12289-018-1421-8
[3] M Maurice Frechet. Sur quelques points du calcul fonctionnel. Rendiconti del Circol Matematico di Palermo (1884-1940), 22(1):1–72, 1906.
[4] Thomas Eiter and Heikki Mannila. Computing discrete Frechet distance. Technical report, 1994.
[5] Anne Driemel, Sariel Har-Peled, and Carola Wenk. Approximating the Frechet Distance for Realistic Curves in Near Linear Time. Discrete & Computational Geometry, 48(1): 94–127, 2012. ISSN 1432-0444. doi: 10.1007/s00454-012-9402-z. URL http://dx.doi.org/10.1007/s00454-012-9402-z.
[6] K Bringmann. Why Walking the Dog Takes Time: Frechet Distance Has No Strongly Subquadratic Algorithms Unless SETH Fails, 2014.
[7] Sean L Seyler, Avishek Kumar, M F Thorpe, and Oliver Beckstein. Path Similarity Analysis: A Method for Quantifying Macromolecular Pathways. PLOS Computational Biology, 11(10):1–37, 2015. doi: 10.1371/journal.pcbi.1004568. URL https://doi.org/10.1371/journal.pcbi.1004568.
[8] Helmut Alt and Michael Godau. Computing the Frechet Distance Between Two Polyg- onal Curves. International Journal of Computational Geometry & Applications, 05 (01n02):75–91, 1995. doi: 10.1142/S0218195995000064.
[9] A Andrade-Campos, R De-Carvalho, and R A F Valente. Novel criteria for determina- tion of material model parameters. International Journal of Mechanical Sciences, 54 (1):294–305, 2012. ISSN 0020-7403. doi: https://doi.org/10.1016/j.ijmecsci.2011.11.010. URL http://www.sciencedirect.com/science/article/pii/S0020740311002451.
[10] J Cao and J Lin. A study on formulation of objective functions for determin- ing material models. International Journal of Mechanical Sciences, 50(2):193–204, 2008. ISSN 0020-7403. doi: https://doi.org/10.1016/j.ijmecsci.2007.07.003. URL http://www.sciencedirect.com/science/article/pii/S0020740307001178.
[11] Donald J Berndt and James Clifford. Using Dynamic Time Warping to Find Pat- terns in Time Series. In Proceedings of the 3rd International Conference on Knowledge Discovery and Data Mining, AAAIWS’94, pages 359–370. AAAI Press, 1994. URL http://dl.acm.org/citation.cfm?id=3000850.3000887.
[12] François Petitjean, Alain Ketterlin, and Pierre Gançarski. A global averaging method for dynamic time warping, with applications to clustering. Pattern Recognition, 44 (3):678–693, 2011. ISSN 0031-3203. doi: https://doi.org/10.1016/j.patcog.2010.09.013. URL http://www.sciencedirect.com/science/article/pii/S003132031000453X.
[13] Toni Giorgino. Computing and Visualizing Dynamic Time Warping Alignments in R: The dtw Package. Journal of Statistical Software; Vol 1, Issue 7 (2009), aug 2009. URL http://dx.doi.org/10.18637/jss.v031.i07.
[14] Stan Salvador and Philip Chan. Toward Accurate Dynamic Time Warping in Linear Time and Space. Intell. Data Anal., 11(5):561–580, oct 2007. ISSN 1088-467X. URL http://dl.acm.org/citation.cfm?id=1367985.1367993.
[15] Paolo Tormene, Toni Giorgino, Silvana Quaglini, and Mario Stefanelli. Matching incomplete time series with dynamic time warping: an algorithm and an applica- tion to post-stroke rehabilitation. Artificial Intelligence in Medicine, 45(1):11–34, 2009. ISSN 0933-3657. doi: https://doi.org/10.1016/j.artmed.2008.11.007. URL http://www.sciencedirect.com/science/article/pii/S0933365708001772.
[16] Senin, P., 2008. Dynamic time warping algorithm review. Information and Computer Science Department University of Hawaii at Manoa Honolulu, USA, 855, pp.1-23. http://seninp.github.io/assets/pubs/senin_dtw_litreview_2008.pdf
Contributions welcome!
This is by no means a complete list of all possible similarity measures. For instance the SciPy Hausdorff distance is an alternative similarity measure useful if you don't know the beginning and ending of each curve. There are many more possible functions out there. Feel free to send PRs for other functions in literature!
Requirements for adding new method to this library:
- all methods should be able to quantify the difference between two curves
- method must support the case where each curve may have a different number of data points
- follow the style of existing functions
- reference to method details, or descriptive docstring of the method
- include test(s) for your new method
- minimum Python dependencies (try to stick to SciPy/numpy functions if possible)
Please cite
If you've found this information or library helpful please cite the following paper. You should also cite the papers of any methods that you have used.
Jekel, C. F., Venter, G., Venter, M. P., Stander, N., & Haftka, R. T. (2018). Similarity measures for identifying material parameters from hysteresis loops using inverse analysis. International Journal of Material Forming. https://doi.org/10.1007/s12289-018-1421-8
@article{Jekel2019,
author = {Jekel, Charles F and Venter, Gerhard and Venter, Martin P and Stander, Nielen and Haftka, Raphael T},
doi = {10.1007/s12289-018-1421-8},
issn = {1960-6214},
journal = {International Journal of Material Forming},
month = {may},
title = {{Similarity measures for identifying material parameters from hysteresis loops using inverse analysis}},
url = {https://doi.org/10.1007/s12289-018-1421-8},
year = {2019}
}
Release history Release notifications | RSS feed


Download files
Download the file for your platform. If you're not sure which to choose, learn more about installing packages.
Source Distribution
Built Distribution
Filter files by name, interpreter, ABI, and platform.
If you're not sure about the file name format, learn more about wheel file names.
Copy a direct link to the current filters
File details
Details for the file similaritymeasures-1.4.0.tar.gz.
File metadata
- Download URL: similaritymeasures-1.4.0.tar.gz
- Upload date:
- Size: 400.4 kB
- Tags: Source
- Uploaded using Trusted Publishing? No
- Uploaded via: twine/6.1.0 CPython/3.12.4
File hashes
| Algorithm | Hash digest | |
|---|---|---|
| SHA256 |
52032dd11ea3c0f94158e17df16f8d512101d6de0d31a2db42193f1434720572
|
|
| MD5 |
24a47a4413333b3f0423cb0120e33ef8
|
|
| BLAKE2b-256 |
54c8c6847432ef7bc6ad65cd58577bb28c01e86680a45cdd29ab157d98374bc3
|
File details
Details for the file similaritymeasures-1.4.0-py3-none-any.whl.
File metadata
- Download URL: similaritymeasures-1.4.0-py3-none-any.whl
- Upload date:
- Size: 15.5 kB
- Tags: Python 3
- Uploaded using Trusted Publishing? No
- Uploaded via: twine/6.1.0 CPython/3.12.4
File hashes
| Algorithm | Hash digest | |
|---|---|---|
| SHA256 |
4beae86c93a202cbbd8451f8b0d7163d54ba7562563af56f62a47f3491efe00f
|
|
| MD5 |
1f528adbf07fcc5dc40d4ebfea3ddf0a
|
|
| BLAKE2b-256 |
79dabcaed2d3b13f69cf7a2c2ec6c64e1008a7bd07e7ace4703ab2aeaf892852
|


