
Lightweight, modular Python library for creating real-time interactive dashboards in the web browser.

Project description
SimplePyDash
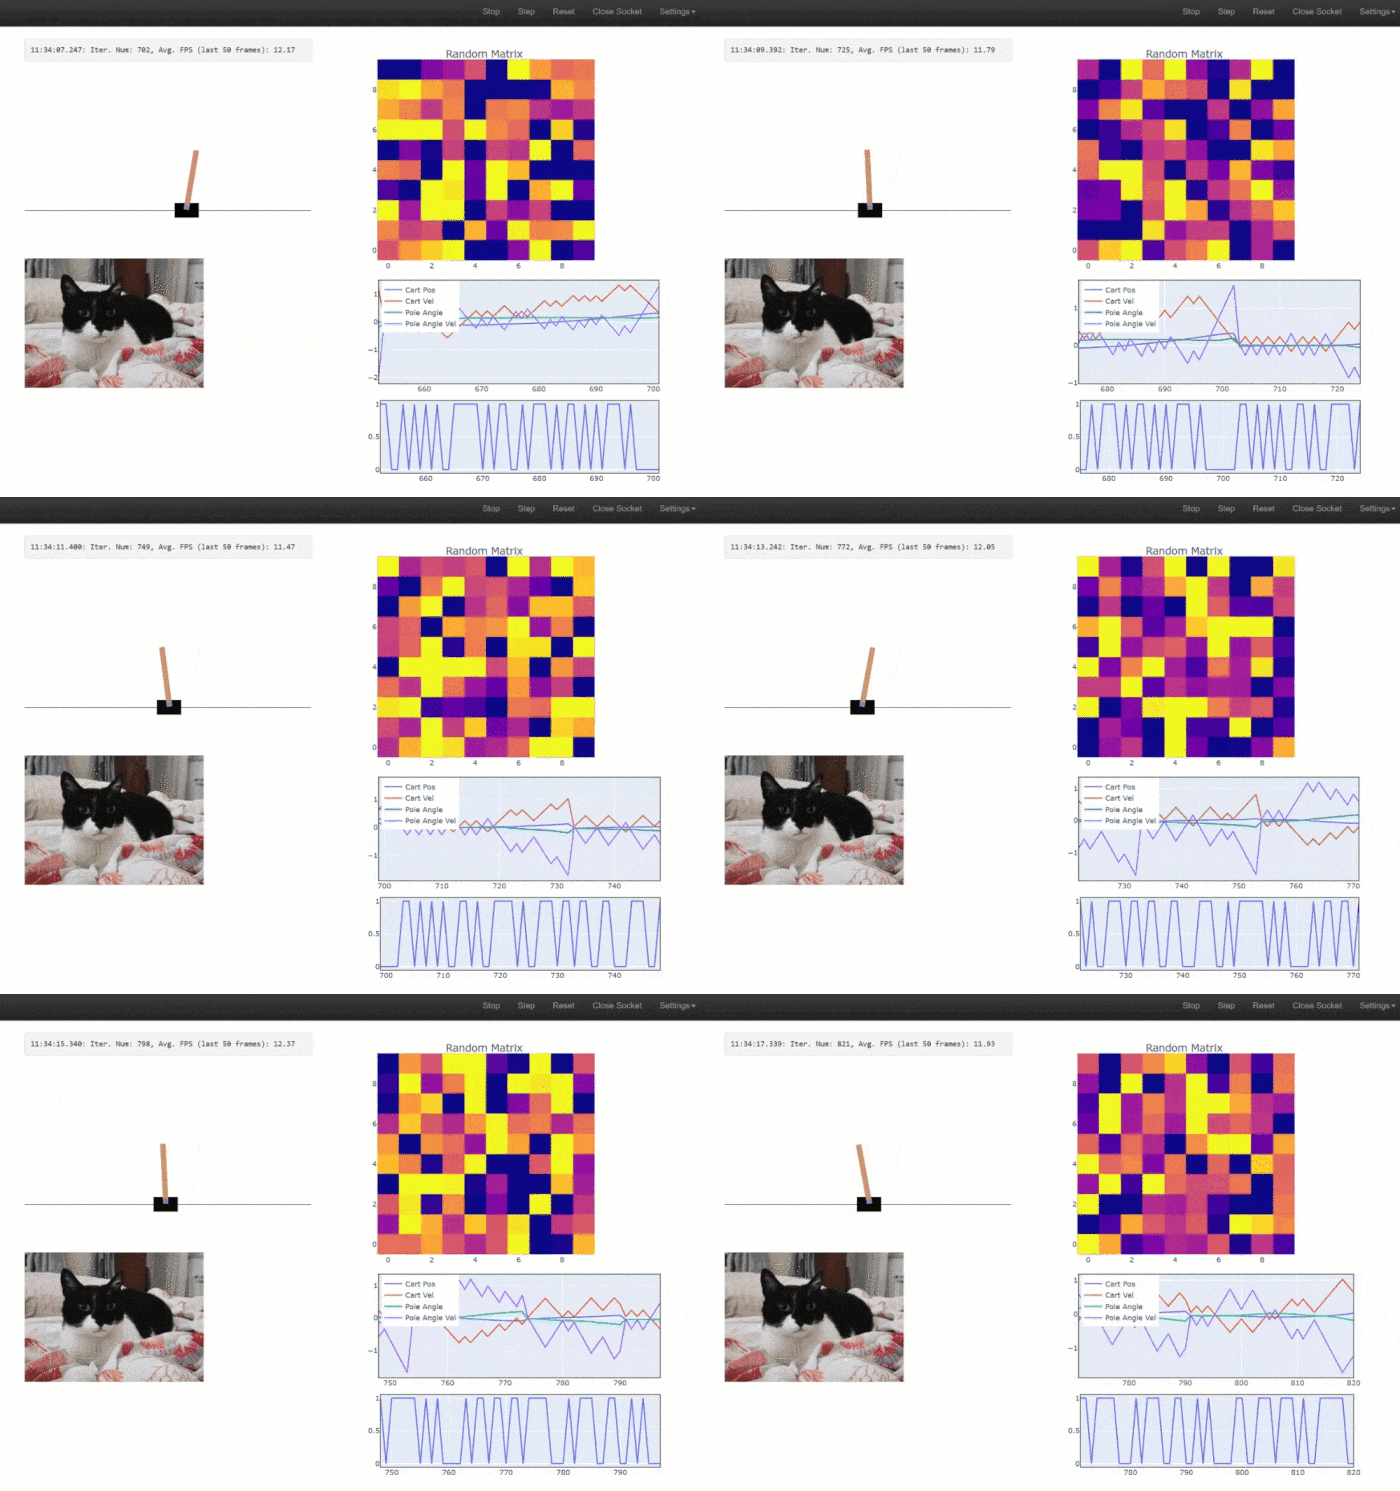
SimplePyDash is a versatile, browser-based dashboard designed for real-time data plotting. With a focus on simplicity, it allows Python developers to easily visualize data streams without complex setup or dependencies.
Although originally developed to facilitate real-time plotting of OpenAI Gym environments for observing agent behavior, the versatility of SimplePyDash extends its utility beyond this use case, making it an excellent tool for many other data visualization scenarios.
Under the hood, SimplePyDash leverages the FastAPI web framework and uses WebSocket for bidirectional communication.
Requirements:
Use the following command to install necessary dependencies:
pip install fastapi "uvicorn[standard]"
For working with OpenAI Gym environments, install the gym library using the command:
pip install gym
Note: This library is only needed for running the examples/openai_gym.py example and is otherwise not mandatory.
Installation
To install SimplePyDash, you can either:
- Install directly from the repository:
pip install git+https://github.com/ValerioB88/browser-dashboard.git
OR
- Clone/fork the repository, and install in editable mode (recommended if you plan to modify the code):
pip install -e {path_to_cloned_folder}
Examples
The best way to get started is to explore the examples provided. examples/openai_gym.py demonstrates plotting a gym environment (requires the gym library), while examples/generic.py is a more general use case.
To run an example, navigate to the repository folder and execute the Python module:
cd {path_to_repo_folder}
python -m examples.gym
The script will try to use the first available port starting at 8000. Open your browser and visit localhost:8000 (or another port if indicated in the console output).
If you are running the script on a server, port forwarding will be necessary. Open a new terminal on your local machine and type:
ssh -L {portnum}:localhost:{portnum} {username}@{machinename}
For example:
ssh -L 8000:localhost:8000 val@titan.it
Then, open your browser and visit localhost:8000 to view the dashboard.
Quick Start
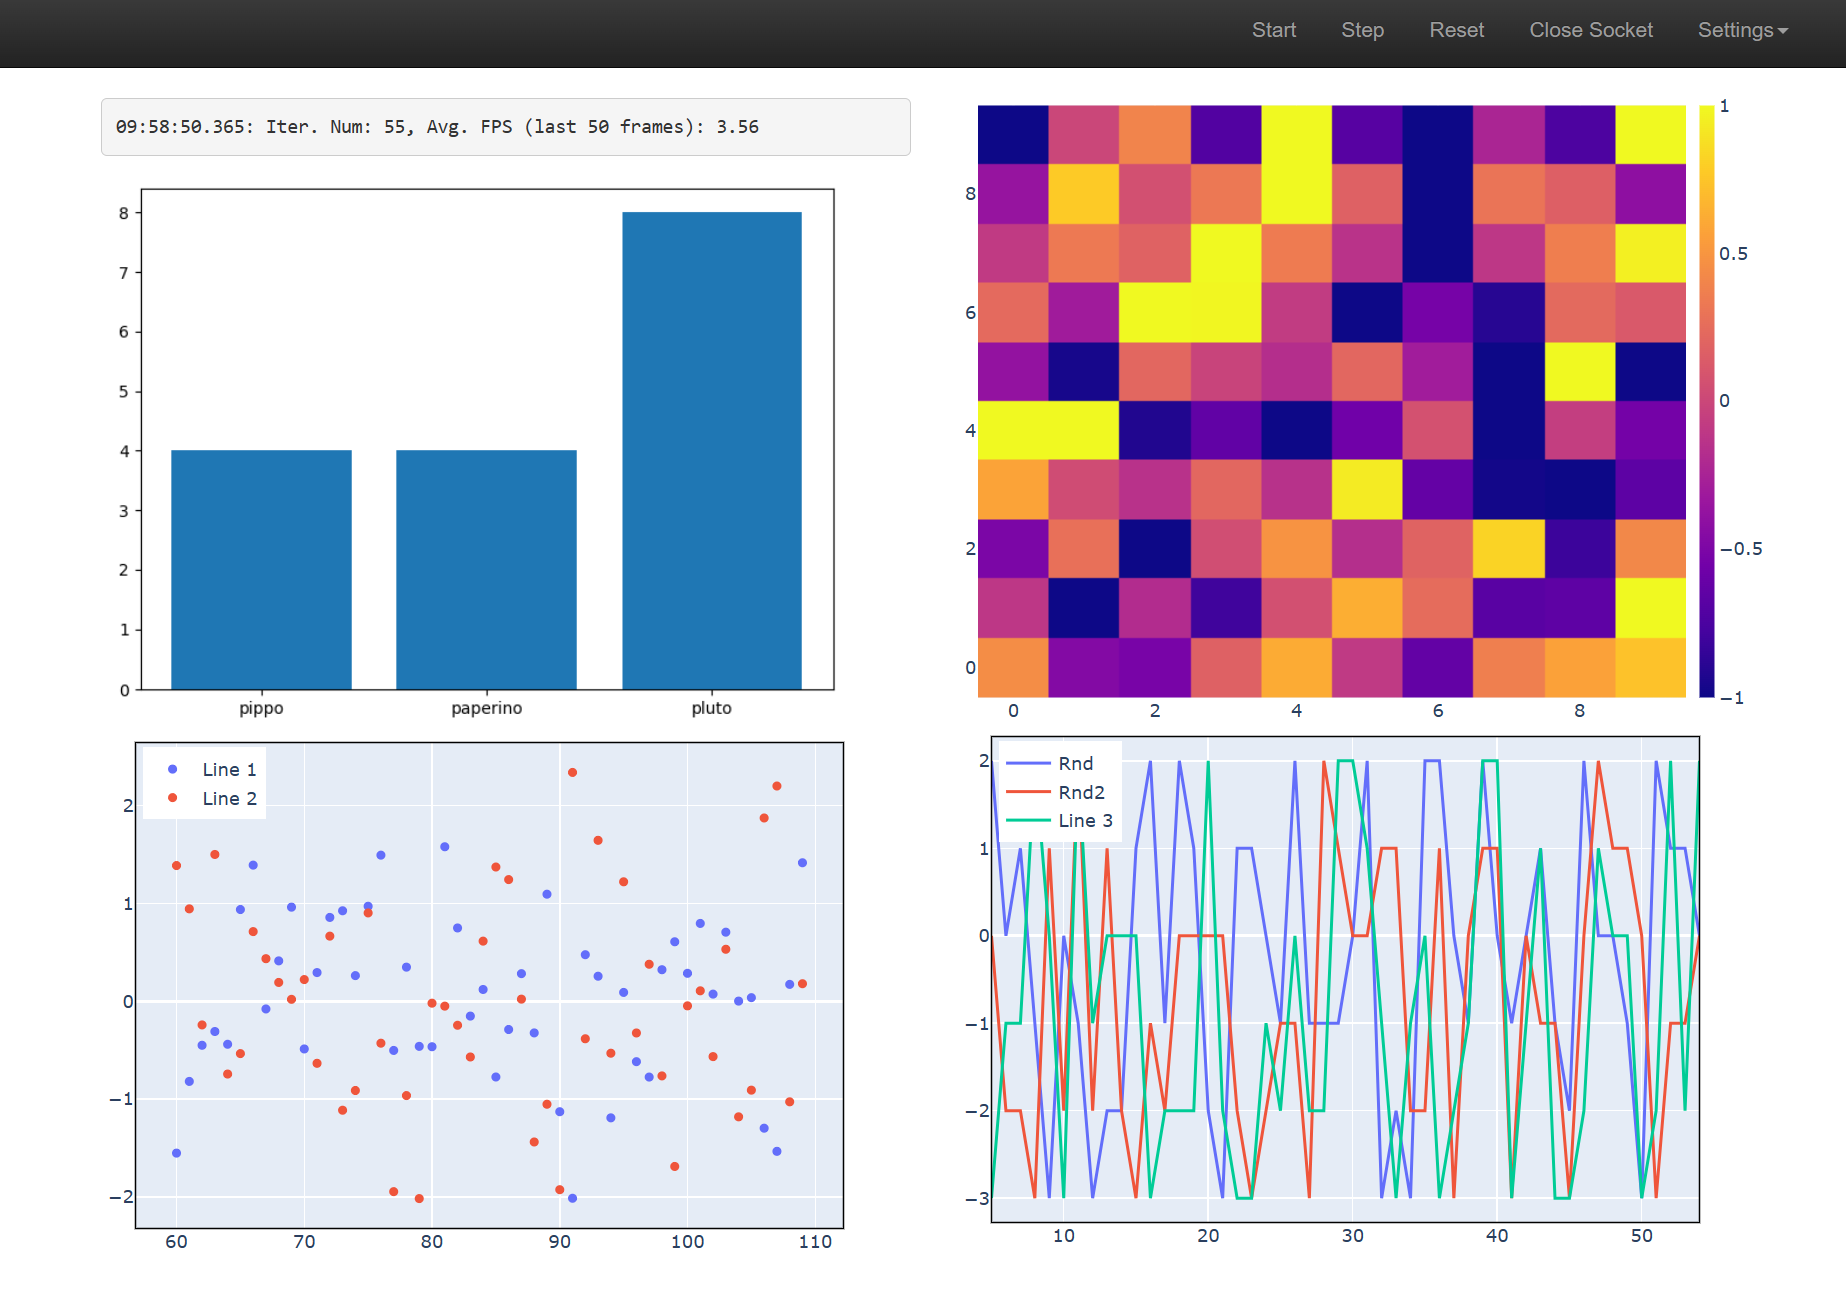
SimplePyDash organizes your dashboard into columns (2 by default). The CustomAPI object takes a model_obj and a series of DashboardComponents. The user-defined model_obj is a simple iterator performing the computations (e.g., running a neural network and returning an action). DashboardComponents are widgets that can be displayed in the browser.
SimplePyDash includes several default widgets, including HeatMap, LinePlot, StaticImage, TextInfo, and RenderGymEnv. The plot widgets, such as HeatMap and LinePlot, are based on the Plotly graphics library, allowing for easy addition of Plotly graphs to your widget list.
Here's a basic example of a CustomAPI object:
server = CustomAPI(
    model_obj=DummyModel,
    dash_comps=[
        GeneralTextInfo(location_col_idx=0, use_scroll=False),
        MatplotlibPlot(location_col_idx=0, width=500),
        AppendScatterPlot(
            get_new_data_fun=lambda m: np.random.randn(2, 2).tolist(),
            location_col_idx=0,
            mode="markers",
            width=500,
            height=350,
        ),
        HeatMap(
            get_new_data_fun=lambda m: m.rnd_matrix,
            clr_min=-1,
            clr_max=1,
            location_col_idx=1,
            height=420,
        ),
        AppendScatterPlot(
            legends=[
                "Rnd",
                "Rnd2",
            ],
            get_new_data_fun=lambda m: m.rnd_lines.tolist(),
            location_col_idx=1,
            width=500,
            height=350,
        ),
    ],
    model_params=dict(num_lines=3),
)
We'll talk about the model_obj in a second. For now consider the dash_comps (DashComponents). We provide 5 components: a Text Box, a matplotlib Barplot, a HeatMap, a Scatter plot and a Line plot. Notice that the using matplotlib is discouraged in favour of Plotly, but here we show that it's possible to integrate matplotlib plots within your dashboard.
SimplePyDash automatically arranges these 5 components in 2 columns, as specified by the fact that their location_col_idx is 0 and 1:
If the location_col_idx of the HeatMap was =2, this would automatically create 3 columns:

dash_comps.
Each DashComponent will have a default width and height. However, you can modify one or both of them to make the widget bigger or smaller. This will not resize the whole column. When using more than 2 columns, SimplePyDash will automatically span the whole page, otheewise it will center the columns in the middle of the page. You can control this behaviour by passing wide_page=True/False to CustomAPI.
Model
The Model must be an infinite iterator that performs computations for the data you want to plot. Take the DummyModel used in examples/generic.py:
class DummyModel(Model):
    tot_steps = 0

    def __init__(self, num_lines, **kwargs):
        self.num_lines = num_lines
        super().__init__(**kwargs)

    def __iter__(self):
        while True:
            self.rnd_matrix = np.random.randn(10, 10)
            self.rnd_lines = np.random.randint(-3, 3, (self.num_lines, 1))

            self.tot_steps += 1
            yield None

    def stop(self):
        pass
In a real life scenario, this class would perform the computation that you want to plot. For example, it might contain a neural netwok, one or several RL agents, etc. For an example with OpenAI Gym Environment, check examples/openai_gym.py.
Plotly Components
HeatMap and AppendScatterPlot are Plotly components. AppendScatterPlot can be used both for scatter and line plots: just pass the argument mode='markers' for a scatter plot and mode='lines' for a line plot (this is following Plotly convention). these are Plotly figures which are passed to the web browser. Implementing a new plotting component just a bit more effort than creating a new Plotly plot: each component needs to implement a render function which specifies what to do with the figure at each iteration. For HeatMap and AppendScatterPlot, the render function calls a user-provided get_new_data_fun which takes some data and use them to update the Plotly figure. In this way the AppendScatterPlot and HeatMap are general and can be used for any model. However, you can create your own PlotlyComponent that simple plots some data specific to your own model. This is easy, since render has access to the whole model object, so that you can do something like self.fig.data[0].z = model.agents[0].energy_level. .
Canvas
The Canvas module returns an image for rendering animations made of individual images in the browser. This could be an OpenAI rendering (using RenderGymEnv module) or any other image (e.g., a matplotlib figure, a static image, etc.).
To extend Canvas, simply create a new class that overrides the render method. For instance, the RenderGymEnv class is defined as follows:
class RenderGymEnv(Canvas):
    def render(self, model):
        canvas = model.env.render()
        canvas = Image.fromarray(canvas)
        return PIL2base64(canvas)
The Canvas module expects the render output to be a base64 string. A PIL image can be converted to this format using PIL2base64. If you have a matplotlib figure, use fig2PIL followed by PIL2base64. We do not reccomend using matplotlib figures as the aren't as fast as Plotly plots, but the option is there for you.
Settings and Performance
Upon running SimplePyDash, you will find a Settings dropdown menu in the navigation bar in your web browser. Here, you can specify the desired FPS . Note that while WebSocket will attempt to maintain the specified rate, it's not guaranteed to always match it.
By default, SimplePyDash runs one iteration of the Model object, computes the result for each dashboard component, and renders the result in the browser. To boost performance, you can perform multiple Model iterations and computations before rendering to the browser. Adjust the Num. Model Iters x Gfx Update value in the Settings to do so. This could result in a massive speed up.
Some modern browsers such as Edge use an "Efficiency mode" which will slow down websocket transfer even for tabs that are in the foreground! If you see a sudden slowdown after the first 10 seconds or so, and the slowdown disappears if you interact with the page in any way (random pressing around), it means that the browser is doing performing "optimisations" on your tab. You can prevent this, but it depends on your browser. For example, in Edge, go to Settings->Systems and performance->Never put these sites to sleep and add localhost:8000.
What performance should I expect?
Performance will depend on a variety of factors. As a guideline, with 1 iteration per graphic update, I get a FPS of a least 8 with the examples/generic.py (which, recall, uses a Matplotlib plot which is not efficient). I get 14 FPS with examples/openai_gym.py. Of course, increasing the iterations per update will significantly increase that.
Release history Release notifications | RSS feed


Download files
Download the file for your platform. If you're not sure which to choose, learn more about installing packages.
Source Distribution
Built Distribution
Filter files by name, interpreter, ABI, and platform.
If you're not sure about the file name format, learn more about wheel file names.
Copy a direct link to the current filters
File details
Details for the file simple_pydash-0.3.0.tar.gz.
File metadata
- Download URL: simple_pydash-0.3.0.tar.gz
- Upload date:
- Size: 8.3 kB
- Tags: Source
- Uploaded using Trusted Publishing? No
- Uploaded via: twine/4.0.2 CPython/3.9.13
File hashes
| Algorithm | Hash digest | |
|---|---|---|
| SHA256 |
3c4ec6d7b6aef3024b7fbac86e3c0791ac9d5766a2fb5d576153b8155817f73d
|
|
| MD5 |
520a6dab97a17a4f281506c8ce19db19
|
|
| BLAKE2b-256 |
faffb83a55a1756db9826bb39f858d778688b14ece32592ce0cc9148b934b04d
|
File details
Details for the file simple_pydash-0.3.0-py3-none-any.whl.
File metadata
- Download URL: simple_pydash-0.3.0-py3-none-any.whl
- Upload date:
- Size: 7.6 kB
- Tags: Python 3
- Uploaded using Trusted Publishing? No
- Uploaded via: twine/4.0.2 CPython/3.9.13
File hashes
| Algorithm | Hash digest | |
|---|---|---|
| SHA256 |
7b343247e6f32e6a800b0f659871ab58dddda9190214f12586bbd1c9be345261
|
|
| MD5 |
5ce88ddd7e2d89634d44bb27295066ba
|
|
| BLAKE2b-256 |
dbb8a23667e870d737f7978e7092a3a51018746f323a34035a49b371feaf2e7b
|






