
SinaPlot for pandas and Matplotlib, with sample-size-scaled violins
Verified details
These details have been verified by PyPIProject links
GitHub Statistics
Maintainers

Project description
sinaplot


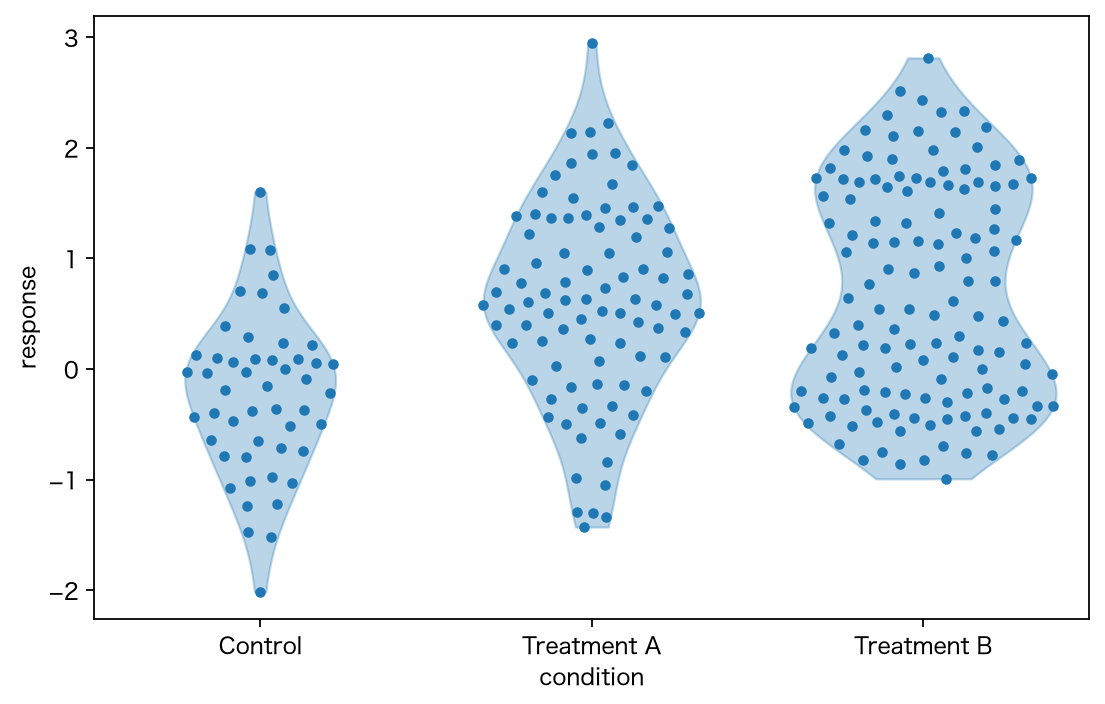
sinaplot draws SinaPlots from pandas data
with Matplotlib. A SinaPlot shows every observation while using the width of
the point distribution to represent the estimated density.
This implementation has two features intended to make comparisons more truthful:
- The area of each violin is proportional to the number of observations in that group. A larger group therefore has a larger envelope instead of every violin being normalized independently.
jitter_method="even"spreads nearby points in display space, reducing overlap and producing a more even visual density.
Installation
pip install sinaplot
Python 3.10 or later is required.
Quick start
import matplotlib.pyplot as plt
import numpy as np
import pandas as pd

from sinaplot import sinaplot

rng = np.random.default_rng(7)
data = pd.DataFrame(
    {
        "condition": np.repeat(["Control", "Treatment A", "Treatment B"], [50, 90, 130]),
        "response": np.concatenate(
            [
                rng.normal(0.0, 0.8, 50),
                rng.normal(0.7, 1.0, 90),
                np.r_[rng.normal(-0.2, 0.45, 65), rng.normal(1.7, 0.55, 65)],
            ]
        ),
    }
)

fig, ax = plt.subplots(figsize=(7, 4.5))
sinaplot(
    x="condition",
    y="response",
    data=data,
    jitter_method="even",
    random_seed=42,
    ax=ax,
)
fig.tight_layout()
plt.show()
sinaplot returns the Matplotlib Axes, so normal Matplotlib customization
continues to work:
ax = sinaplot(
    "condition",
    "response",
    data,
    order=["Treatment B", "Treatment A", "Control"],
    color="tab:purple",
    violin_kws={"alpha": 0.2},
    scatter_kws={"edgecolor": "white", "linewidth": 0.3},
)
ax.set_title("Response by condition")
Main options
| Option | Meaning |
|---|---|
violin=True |
Draw the sample-size-scaled density envelope. |
max_width=0.8 |
Set the maximum full width in category-axis units. |
jitter_method="random" |
Randomly place points inside the envelope. |
jitter_method="even" |
Iteratively spread nearby points to reduce overlap. |
random_seed=None |
Make either placement method reproducible. |
order=None |
Set an explicit category order. Ordered pandas categoricals are respected automatically. |
bw_method=None |
Pass a KDE bandwidth method to SciPy. |
violin_kws, scatter_kws |
Pass styling options to Matplotlib. |
Rows with missing categories or missing/non-finite numerical values are omitted. Groups with fewer than two distinct values cannot have a kernel density estimate and are represented by a horizontal line.
How area scaling works
For each group, the displayed kernel density is numerically normalized over the plotted range and then multiplied by the number of finite observations in that group. All groups use one common horizontal scale. Consequently, violin area is proportional to sample size, while the local width still represents density.
The points are always constrained to the corresponding density envelope.
With jitter_method="even", an iterative repulsion calculation in display
coordinates gives nearby points more uniform spacing. Set random_seed when
you need exactly reproducible coordinates.
Development
git clone https://github.com/okumuralab/sinaplot.git
cd sinaplot
python -m pip install -e ".[test]"
python -m pytest
Build the wheel and source distribution with:
python -m pip install build
python -m build
Reference
Sidiropoulos N, Sohi SH, Pedersen TL, Porse BT, Winther O, Rapin N, Bagger FO. “SinaPlot: an enhanced chart for simple and truthful representation of single observations over multiple classes.” Journal of Computational and Graphical Statistics 27(3), 673–676 (2018). doi:10.1080/10618600.2017.1366914. Preprint: doi:10.1101/028191.
This project is an independent Python implementation and is not affiliated with the authors of the paper or the R packages that implement SinaPlot.
License
MIT
Project details
Verified details
These details have been verified by PyPIProject links
GitHub Statistics
Maintainers
Release history Release notifications | RSS feed

Download files
Download the file for your platform. If you're not sure which to choose, learn more about installing packages.
Source Distribution
Built Distribution
Filter files by name, interpreter, ABI, and platform.
If you're not sure about the file name format, learn more about wheel file names.
Copy a direct link to the current filters
File details
Details for the file sinaplot-0.1.0.tar.gz.
File metadata
- Download URL: sinaplot-0.1.0.tar.gz
- Upload date:
- Size: 80.9 kB
- Tags: Source
- Uploaded using Trusted Publishing? Yes
- Uploaded via: twine/6.1.0 CPython/3.13.14
File hashes
| Algorithm | Hash digest | |
|---|---|---|
| SHA256 |
462d8d62c6daaba7d973583974fefc5d8d22434de521ad9eab95c807f9b7ebe0
|
|
| MD5 |
81511913aaacd5ea747dcc87236221e1
|
|
| BLAKE2b-256 |
f75d05618890ea41016bb8a2508c8b3740e6aa84eae7397417b1a33c3d64998d
|
Provenance
The following attestation bundles were made for sinaplot-0.1.0.tar.gz:
Publisher:
publish.yml on okumuralab/sinaplot
-
Statement:
-
Statement type:
https://in-toto.io/Statement/v1 -
Predicate type:
https://docs.pypi.org/attestations/publish/v1 -
Subject name:
sinaplot-0.1.0.tar.gz -
Subject digest:
462d8d62c6daaba7d973583974fefc5d8d22434de521ad9eab95c807f9b7ebe0 - Sigstore transparency entry: 2233496602
- Sigstore integration time:
-
Permalink:
okumuralab/sinaplot@00670c8ad95ead5c45d814e887eb51c520c01c69 -
Branch / Tag:
refs/tags/v0.1.0 - Owner: https://github.com/okumuralab
-
Access:
public
-
Token Issuer:
https://token.actions.githubusercontent.com -
Runner Environment:
github-hosted -
Publication workflow:
publish.yml@00670c8ad95ead5c45d814e887eb51c520c01c69 -
Trigger Event:
release
-
Statement type:
File details
Details for the file sinaplot-0.1.0-py3-none-any.whl.
File metadata
- Download URL: sinaplot-0.1.0-py3-none-any.whl
- Upload date:
- Size: 8.2 kB
- Tags: Python 3
- Uploaded using Trusted Publishing? Yes
- Uploaded via: twine/6.1.0 CPython/3.13.14
File hashes
| Algorithm | Hash digest | |
|---|---|---|
| SHA256 |
3e90cd16fa2ccaec0f56af9e6f6ca08007680f8e80714caae35dc67af82cebde
|
|
| MD5 |
4ef6e90908b708a69dd641889de595e5
|
|
| BLAKE2b-256 |
a6c466626e9ce7f9242316a01d2c2d6b3f50b4dae828d29b50b4de45c93e1925
|
Provenance
The following attestation bundles were made for sinaplot-0.1.0-py3-none-any.whl:
Publisher:
publish.yml on okumuralab/sinaplot
-
Statement:
-
Statement type:
https://in-toto.io/Statement/v1 -
Predicate type:
https://docs.pypi.org/attestations/publish/v1 -
Subject name:
sinaplot-0.1.0-py3-none-any.whl -
Subject digest:
3e90cd16fa2ccaec0f56af9e6f6ca08007680f8e80714caae35dc67af82cebde - Sigstore transparency entry: 2233497786
- Sigstore integration time:
-
Permalink:
okumuralab/sinaplot@00670c8ad95ead5c45d814e887eb51c520c01c69 -
Branch / Tag:
refs/tags/v0.1.0 - Owner: https://github.com/okumuralab
-
Access:
public
-
Token Issuer:
https://token.actions.githubusercontent.com -
Runner Environment:
github-hosted -
Publication workflow:
publish.yml@00670c8ad95ead5c45d814e887eb51c520c01c69 -
Trigger Event:
release
-
Statement type:






