
Sirene Application
The Sirene application serves four main purposes:
-
Facilitate Access to Raw Greenhouse Gas Emission Data: Provides easy access to raw greenhouse gas (GHG) emission data generated by the MCTI (Ministry of Science, Technology, and Innovation).
-
Access Disaggregated Emission Data: Allows users to access disaggregated emission data using the disaggregation methodology (proposed in future IPEA paper).
-
Estimate emission coefficients: estimate total, direct, and indirect emission coefficients according to the methodology proposed by Luis Masa's paper.
-
Continuous Improvement of Estimations: Facilitates the review, critique, and suggestion of improvements to the methodology used for estimating emission coefficients.
Additionally, the application provides sectoral data on Gross Production Value (VBP) and loan values by sector. With the disaggregated emission data and the VBP, we can estimate total, direct, and indirect emission coefficients according to the methodology proposed by Luis Masa's paper, titled "AN ESTIMATION OF THE CARBON FOOTPRINT IN SPANISH CREDIT INSTITUTIONS’ BUSINESS LENDING PORTFOLIO".
Please note that the data are annual and, according to the latest SIRENE report, are available between the years 1990 and 2020.
1. Reading Raw Emission Data
The data are aggregated into five sectors: 'agropecuaria', 'energia', 'ippu' (Industrial Processes and Product Use), 'lulucf' (Land Use, Land-Use Change, and Forestry), and 'residuos', along with various subsectors. For each subsector, the MCTI estimates emissions of the main greenhouse gases: 'CO2', 'CH4', and 'N2O'. Moreover, for a more comprehensive view, we can convert these emissions into CO₂ equivalents (CO₂e) using different methodologies: 'CO2e_GWP_SAR', 'CO2e_GWP_AR5', and 'CO2e_GTP_AR5'.
1.1 Retrieving Emission Data of a Specific Sector
#!pip install sirene
from sirene import srn_defl as srn
srn.read('agropecuaria')  # CO₂ emissions between 1990 and 2020 estimated by MCTI (6th edition)
srn.read('energia')
srn.read('ippu')
srn.read('lulucf')
srn.read('residuos').head(2)
# srn.read('total-brazil-1', 'CO2e_GWP_SAR')
| 4 | 1990.0 | 1991.0 | 1992.0 | 1993.0 | 1994.0 | 1995.0 | 1996.0 | 1997.0 | 1998.0 | 1999.0 | ... | 2011.0 | 2012.0 | 2013.0 | 2014.0 | 2015.0 | 2016.0 | 2017.0 | 2018.0 | 2019.0 | 2020.0 |
|---|---|---|---|---|---|---|---|---|---|---|---|---|---|---|---|---|---|---|---|---|---|
| setor_nfr | |||||||||||||||||||||
| 5. Resíduos | 533.281271 | 543.542162 | 564.801835 | 535.723279 | 563.93405 | 584.509299 | 681.307133 | 732.83232 | 777.821987 | 906.700852 | ... | 1114.443923 | 1164.108223 | 1229.771722 | 1330.541005 | 1148.902275 | 503.660432 | 654.8382 | 514.6629 | 374.4876 | 234.3123 |
| 5.A. Disposição de Resíduos Sólidos | 0.000000 | 0.000000 | 0.000000 | 0.000000 | 0.00000 | 0.000000 | 0.000000 | 0.00000 | 0.000000 | 0.000000 | ... | 0.000000 | 0.000000 | 0.000000 | 0.000000 | 0.000000 | 0.000000 | 0.0000 | 0.0000 | 0.0000 | 0.0000 |
2 rows × 31 columns
1.2 Emission Data for Different Gases
srn.read('agropecuaria', 'CO2')          # Annual CO₂ emissions (in Gg) by the 'agriculture' sector
srn.read('agropecuaria', 'CH4')          # Annual CH₄ emissions
srn.read('agropecuaria', 'N2O').head(2)  # Annual N₂O emissions
| 4 | 1990.0 | 1991.0 | 1992.0 | 1993.0 | 1994.0 | 1995.0 | 1996.0 | 1997.0 | 1998.0 | 1999.0 | ... | 2011.0 | 2012.0 | 2013.0 | 2014.0 | 2015.0 | 2016.0 | 2017.0 | 2018.0 | 2019.0 | 2020.0 |
|---|---|---|---|---|---|---|---|---|---|---|---|---|---|---|---|---|---|---|---|---|---|
| setor_nfr | |||||||||||||||||||||
| 3. Agropecuária | 279.66444 | 285.562807 | 294.191788 | 297.69358 | 307.340659 | 312.686904 | 297.197033 | 307.411606 | 315.603113 | 319.361771 | ... | 473.30052 | 471.058836 | 486.479602 | 495.363993 | 495.491183 | 511.261527 | 465.727887 | 459.715568 | 466.367715 | 493.733508 |
| 3.A. Fermentação Entérica | 0.00000 | 0.000000 | 0.000000 | 0.00000 | 0.000000 | 0.000000 | 0.000000 | 0.000000 | 0.000000 | 0.000000 | ... | 0.00000 | 0.000000 | 0.000000 | 0.000000 | 0.000000 | 0.000000 | 0.000000 | 0.000000 | 0.000000 | 0.000000 |
2 rows × 31 columns
1.3 Aggregating Emissions Using Different Methodologies
srn.read('agropecuaria', 'CO2e_GWP_SAR')  # CO₂e emissions using the GWP_SAR methodology
srn.read('agropecuaria', 'CO2e_GWP_AR5')  # CO₂e emissions using the GWP_AR5 methodology
srn.read('agropecuaria', 'CO2e_GTP_AR5')  # CO₂e emissions using the GTP_AR5 methodology
srn.read('total-brasil-1', 'CO2e_GWP_SAR')
| 4 | 1990.0 | 1991.0 | 1992.0 | 1993.0 | 1994.0 | 1995.0 | 1996.0 | 1997.0 | 1998.0 | 1999.0 | ... | 2011.0 | 2012.0 | 2013.0 | 2014.0 | 2015.0 | 2016.0 | 2017.0 | 2018.0 | 2019.0 | 2020.0 |
|---|---|---|---|---|---|---|---|---|---|---|---|---|---|---|---|---|---|---|---|---|---|
| setor_nfr | |||||||||||||||||||||
| Total | 1.513050e+06 | 1.350780e+06 | 1.473045e+06 | 1.524658e+06 | 1.520309e+06 | 2.658961e+06 | 1.933597e+06 | 1.628555e+06 | 1.906803e+06 | 1.876171e+06 | ... | 1.330959e+06 | 1.214650e+06 | 1.465501e+06 | 1.354190e+06 | 1.461633e+06 | 1.473392e+06 | 1.363034e+06 | 1.368710e+06 | 1.602461e+06 | 1.675759e+06 |
| 1. Energia | 1.928096e+05 | 1.963756e+05 | 2.015303e+05 | 2.060034e+05 | 2.148438e+05 | 2.309830e+05 | 2.482115e+05 | 2.643361e+05 | 2.718498e+05 | 2.815097e+05 | ... | 3.879157e+05 | 4.209064e+05 | 4.523506e+05 | 4.788814e+05 | 4.544386e+05 | 4.247321e+05 | 4.295025e+05 | 4.067935e+05 | 4.083429e+05 | 3.894841e+05 |
| 2. Processos industriais e uso de produtos (IPPU) | 5.692059e+04 | 6.199831e+04 | 6.024298e+04 | 6.320786e+04 | 6.321482e+04 | 6.801612e+04 | 6.739034e+04 | 7.045198e+04 | 7.502388e+04 | 7.437740e+04 | ... | 9.387738e+04 | 9.520686e+04 | 9.679476e+04 | 9.449125e+04 | 9.542089e+04 | 9.370133e+04 | 9.816093e+04 | 9.657526e+04 | 1.014626e+05 | 1.019364e+05 |
| 3. Agropecuária | 3.296129e+05 | 3.387376e+05 | 3.439877e+05 | 3.492618e+05 | 3.568910e+05 | 3.594707e+05 | 3.388175e+05 | 3.463707e+05 | 3.521076e+05 | 3.566238e+05 | ... | 4.630810e+05 | 4.620783e+05 | 4.674368e+05 | 4.728464e+05 | 4.762785e+05 | 4.871702e+05 | 4.645018e+05 | 4.641781e+05 | 4.683711e+05 | 4.776705e+05 |
| 4. Uso da Terra, Mudança do Uso da Terra e Florestas (LULUCF) | 9.075130e+05 | 7.258803e+05 | 8.385865e+05 | 8.753576e+05 | 8.529330e+05 | 1.966234e+06 | 1.243209e+06 | 9.102377e+05 | 1.169334e+06 | 1.123254e+06 | ... | 3.285898e+05 | 1.785544e+05 | 3.873587e+05 | 2.460640e+05 | 3.726926e+05 | 4.044966e+05 | 3.064440e+05 | 3.345022e+05 | 5.568179e+05 | 6.370386e+05 |
| 5. Resíduos | 2.619352e+04 | 2.778839e+04 | 2.869725e+04 | 3.082708e+04 | 3.242630e+04 | 3.425745e+04 | 3.596863e+04 | 3.715815e+04 | 3.848735e+04 | 4.040561e+04 | ... | 5.749480e+04 | 5.790412e+04 | 6.156007e+04 | 6.190650e+04 | 6.280232e+04 | 6.329223e+04 | 6.442457e+04 | 6.666138e+04 | 6.746670e+04 | 6.962985e+04 |
6 rows × 31 columns
1.4 Identifying Subsectors of a Specific Sector
srn.read('energia').index
Index(['1. Energia',
       '1.A.   Atividades de Queima de Combustíveis (abordagem setorial)',
       '1.A.1.     Indústrias de Energia',
       '1.A.1.a.       Produção de eletricidade e calor como atividade principal',
       '1.A.1.b.       Refino de petróleo',
       '1.A.1.c.       Produção de combustíveis sólidos e outras indústrias de energia',
       '1.A.2.     Indústrias de Transformação e Construção',
       '1.A.2.a.       Ferro e aço', '1.A.2.b.       Metais não ferrosos',
       '1.A.2.c.       Produtos quimicos',
       '1.A.2.d.       Celulose, papel e impressão',
       '1.A.2.e.       Processamento de alimentos, bebidas e tabaco',
       '1.A.2.f.       Minerais não metálicos',
       '1.A.2.g.       Equipamentos de transporte',
       '1.A.2.i.       Mineração (exceto combustíveis) e extração',
       '1.A.2.l.       Têxtil e couro', '1.A.3.     Transporte',
       '1.A.3.a.ii.          Aviação doméstica',
       '1.A.3.b.       Transporte rodoviário',
       '1.A.3.c.       Transporte Ferroviário',
       '1.A.3.d.ii.          Navegação doméstica',
       '1.A.3.e.       Outros transportes', '1.A.4.     Outros Setores',
       '1.A.4.a.       Comercial / institucional',
       '1.A.4.b.       Residencial',
       '1.A.4.c.       Agricultura / silvicultura / pesca / piscicultura',
       '1.A.5.     Não Especificado',
       '1.B.   Emissões Fugitivas a Partir da Produção de Combustíveis',
       '1.B.1.     Combustíveis sólidos', '1.B.2.     Petróleo e Gás Natural ',
       '1.C.   Transporte e armazenamento de CO2'],
      dtype='object', name='setor_nfr')
1.5 Retrieving Data of a Specific Subsector
srn.read('energia').loc['1.A.4.b. Residencial', :].tail(5)
4
2016.0    18209.105762
2017.0    18348.639738
2018.0    18211.226425
2019.0    18132.857115
2020.0    18854.853915
Name: 1.A.4.b.       Residencial, dtype: float64
2. Reading Disaggregated Emission Data
Each sector in the MCTI data (referred to as MCTI sectors) has been disaggregated into 68 activities based on the IBGE classification. This allows us to access the emissions of a specific activity within each sector (which could be considered the origin of emissions).
Note that not all years have been disaggregated. Disaggregation requires already disaggregated VBP data, which IBGE does not provide before 20XX.
For data that combine public and private health and education:
srn.co2e_67.head(10) # Sums of (8591 + 8592) and (8691 + 8692)
| year | atividade_tru68_ibge | energia_Gg_CO2e_GWP_SAR | residuo_Gg_CO2e_GWP_SAR | agropecuaria_Gg_CO2e_GWP_SAR | ippu_Gg_CO2e_GWP_SAR | lulucf_Gg_CO2e_GWP_SAR | total_Gg_CO2e_GWP_SAR | |
|---|---|---|---|---|---|---|---|---|
| 0 | 1990 | 0191 | 0.0 | 0.0000 | 0.0 | 0.000000 | 118165.392346 | 118165.392346 |
| 1 | 1990 | 0192 | 0.0 | 569.0895 | 0.0 | 0.000000 | 786620.547583 | 787189.637083 |
| 2 | 1990 | 0280 | 0.0 | 0.0000 | 0.0 | 0.000000 | 2727.011575 | 2727.011575 |
| 3 | 1990 | 1091 | 0.0 | 443.0517 | 0.0 | 0.000000 | 0.000000 | 443.051700 |
| 4 | 1990 | 1100 | 0.0 | 81.8475 | 0.0 | 0.000000 | 0.000000 | 81.847500 |
| 5 | 1990 | 1700 | 0.0 | 186.8790 | 0.0 | 0.000000 | 0.000000 | 186.879000 |
| 6 | 1990 | 2091 | 0.0 | 0.0000 | 0.0 | 8744.469277 | 0.000000 | 8744.469277 |
| 7 | 1990 | 2300 | 0.0 | 0.0000 | 0.0 | 15170.640561 | 0.000000 | 15170.640561 |
| 8 | 1990 | 2491 | 0.0 | 0.0000 | 0.0 | 28232.024448 | 0.000000 | 28232.024448 |
| 9 | 1990 | 2492 | 0.0 | 0.0000 | 0.0 | 4123.240826 | 0.000000 | 4123.240826 |
3. Scope of the Decomposition
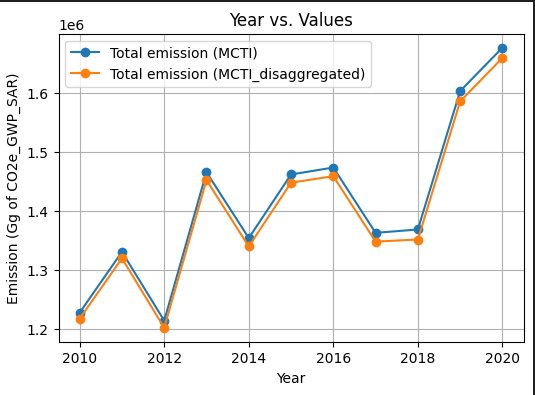
Disaggregating MCTI emission data into 68 activities is a complex task. Due to this complexity, not all emissions have been assigned to a specific activity. Therefore, when comparing the total emissions of the 68 activities with the total estimated by the MCTI, the former is slightly lower. We have taken care to perform as much disaggregation as possible without significant loss of information to ensure data reliability.
import warnings
import pandas as pd
import matplotlib.pyplot as plt
warnings.simplefilter(action='ignore', category=FutureWarning)


# 1) emission separated (68 activities)
E_total_68 = pd.DataFrame({'year':[],'total68_Gg_CO2e_GWP_SAR':[]})
for t in range(2010,2021):
  result_t = srn.coef(str(t)).result
  footprint = result_t['total_Gg_CO2e_GWP_SAR'].sum()
  df_ = pd.DataFrame({'year':[result_t.ano[0]],'total68_Gg_CO2e_GWP_SAR':[footprint]})
  E_total_68 = pd.concat([E_total_68,df_])

# 2) emission aggregated (official data from MCTI)
E_total = pd.DataFrame(srn.read('total-brasil-1','CO2e_GWP_SAR').loc['Total',:])
E_total.reset_index(inplace=True)
E_total.columns = ['year','total_Gg_CO2e_GWP_SAR']

# 3) plot
E = E_total.merge(E_total_68, on='year')

plt.figure(figsize=(6,4))
plt.plot(E['year'], E['total_Gg_CO2e_GWP_SAR'], label='Total emission (MCTI)', marker='o')
plt.plot(E['year'], E['total68_Gg_CO2e_GWP_SAR'], label='Total emission (MCTI_disaggregated)', marker='o')

plt.title('Year vs. Values')
plt.xlabel('Year')
plt.ylabel('Emission (Gg of CO2e_GWP_SAR)')
plt.legend()
plt.grid(True)
plt.show()
4. Emission Coefficients
Using the disaggregated emission data and the deflated VBP (see relevant literature), we can estimate emission coefficients by activity (refer to the methodology proposed by Maza). To estimate these coefficients, we can consider the 'household' sector, which represents households responsible for emissions such as burning waste in rural areas.
Data Field Descriptions
atividade_tru68_ibge: Represents activity (i) classified under TRU68.production_values_mi_brl: Total production value of activity (i) for year (t), expressed in millions of BRL.ano: Reference year for the data (complete data available only between 2012 and 2020).energia_Gg_CO2e_GWP_SAR: CO2e emissions from the energy sector, measured in Gg and calculated using the CO2e_GWP_SAR methodology.residuo_Gg_CO2e_GWP_SAR: CO2e emissions from the waste sector, measured in Gg.agropecuaria_Gg_CO2e_GWP_SAR: CO2e emissions from the agricultural sector, measured in Gg.ippu_Gg_CO2e_GWP_SAR: CO2e emissions from the IPPU sector, measured in Gg.lulucf_Gg_CO2e_GWP_SAR: CO2e emissions from the LULUCF sector, measured in Gg.total_Gg_CO2e_GWP_SAR: Total CO2e emissions across all sectors, measured in Gg.active_loan_portfolio_mi_brl: Value of active loans by sector, expressed in millions of BRL.q_direct: Coefficient representing direct emissions.q_total: Coefficient representing total emissions (direct + indirect).q_indirect: Coefficient representing indirect emissions.
coef_t = srn.coef(year='2020', emission='total', household=True, ajust_sicor=True, reference_year='2011')
coef_t.reference_year  # Reference year for deflation
# coef_t.adjust_sicor    # Adjust credit data
coef_t.defl_df         # DataFrame with deflation values
coef_t.defl_num        # Deflation scalar
coef_t.emission        # Type of emission: 'total', etc.
coef_t.household             # Boolean indicating inclusion of household sector
coef_t.mLeontiefBarr.shape   # Leontief matrix shape (67, 67)
coef_t.result[['atividade_tru68_ibge',
               'production_values_mi_brl', 'ano']]   # IBGE data
| ano | production_values_mi_brl | total_Gg_CO2e_GWP_SAR | ano | q_direct | q_total | q_indirect | |
|---|---|---|---|---|---|---|---|
| 0191\nAgricultura, inclusive o apoio à agricultura e a pós-colheita | 2020 | 302059.919929 | 223674.759909 | 2020 | 0.740498 | 1.934712 | 1.194214 |
| 0192\nPecuária, inclusive o apoio à pecuária | 2020 | 112305.027425 | 942924.465575 | 2020 | 8.396102 | 9.098249 | 0.702147 |
| 0280\nProdução florestal; pesca e aquicultura | 2020 | 23393.557114 | -34593.308607 | 2020 | -1.478754 | -1.409453 | 0.069301 |
| 0580\nExtração de carvão mineral e de minerais não-metálicos | 2020 | 12780.776306 | 419.651840 | 2020 | 0.032835 | 0.157375 | 0.12454 |
| 0680\nExtração de petróleo e gás, inclusive as atividades de apoio | 2020 | 131319.134611 | 2611.296027 | 2020 | 0.019885 | 0.515303 | 0.495418 |
| ... | ... | ... | ... | ... | ... | ... | ... |
| 8691 + 8692\nSaúde | 2020 | 309474.34351 | 173.138934 | 2020 | 0.000559 | 0.004565 | 0.004006 |
| 9080\nAtividades artísticas, criativas e de espetáculos | 2020 | 21619.992666 | 30.165292 | 2020 | 0.001395 | 0.487969 | 0.486573 |
| 9480\nOrganizações associativas e outros serviços pessoais | 2020 | 94739.917992 | 91.784941 | 2020 | 0.000969 | 0.219711 | 0.218742 |
| 9700\nServiços domésticos | 2020 | 32717.423064 | 0.000000 | 2020 | 0.0 | 0.104352 | 0.104352 |
| \nRESIDENCIAL | 2020 | 1756149.519048 | 91105.313767 | 2020 | 0.051878 | 5.601229 | 5.549351 |
67 rows × 7 columns
coef_t.result[['ano', 'production_values_mi_brl',
               'total_Gg_CO2e_GWP_SAR', 'ano',
               'q_direct', 'q_total', 'q_indirect']] # Emission coefficients as per Maza
| ano | production_values_mi_brl | total_Gg_CO2e_GWP_SAR | ano | q_direct | q_total | q_indirect | |
|---|---|---|---|---|---|---|---|
| 0191\nAgricultura, inclusive o apoio à agricultura e a pós-colheita | 2020 | 302059.919929 | 223674.759909 | 2020 | 0.740498 | 1.934712 | 1.194214 |
| 0192\nPecuária, inclusive o apoio à pecuária | 2020 | 112305.027425 | 942924.465575 | 2020 | 8.396102 | 9.098249 | 0.702147 |
| 0280\nProdução florestal; pesca e aquicultura | 2020 | 23393.557114 | -34593.308607 | 2020 | -1.478754 | -1.409453 | 0.069301 |
| 0580\nExtração de carvão mineral e de minerais não-metálicos | 2020 | 12780.776306 | 419.651840 | 2020 | 0.032835 | 0.157375 | 0.12454 |
| 0680\nExtração de petróleo e gás, inclusive as atividades de apoio | 2020 | 131319.134611 | 2611.296027 | 2020 | 0.019885 | 0.515303 | 0.495418 |
| ... | ... | ... | ... | ... | ... | ... | ... |
| 8691 + 8692\nSaúde | 2020 | 309474.34351 | 173.138934 | 2020 | 0.000559 | 0.004565 | 0.004006 |
| 9080\nAtividades artísticas, criativas e de espetáculos | 2020 | 21619.992666 | 30.165292 | 2020 | 0.001395 | 0.487969 | 0.486573 |
| 9480\nOrganizações associativas e outros serviços pessoais | 2020 | 94739.917992 | 91.784941 | 2020 | 0.000969 | 0.219711 | 0.218742 |
| 9700\nServiços domésticos | 2020 | 32717.423064 | 0.000000 | 2020 | 0.0 | 0.104352 | 0.104352 |
| \nRESIDENCIAL | 2020 | 1756149.519048 | 91105.313767 | 2020 | 0.051878 | 5.601229 | 5.549351 |
67 rows × 7 columns
5. Emissions from the Brazilian Credit Financial System
The application contains credit data by activity extracted from the Credit System maintained by the Central Bank of Brazil (BCB). Knowing the credit volume each sector receives and the emissions each sector produces, we can estimate the emissions per dollar lent by the financial system.
When set to ajust_sicor=True, it incorporates SICOR data when constructing emission coefficients. Otherwise, only SNC data is considered. SNC data already include SICOR data; however, in this case, they are classified as households (CPF). The more accurate approach is to treat this data as corporate entities (CNPJ), given the specific characteristics of the agricultural production system and its financing.
Credit System Data:
loan = coef_t.result[['ano', 'production_values_mi_brl', 'total_Gg_CO2e_GWP_SAR', 'active_loan_portfolio_mi_brl']] # Loan data
| ano | production_values_mi_brl | total_Gg_CO2e_GWP_SAR | active_loan_portfolio_mi_brl | |
|---|---|---|---|---|
| 0191\nAgricultura, inclusive o apoio à agricultura e a pós-colheita | 2020 | 302059.919929 | 223674.759909 | 98827.307133 |
| 0192\nPecuária, inclusive o apoio à pecuária | 2020 | 112305.027425 | 942924.465575 | 61840.483836 |
| 0280\nProdução florestal; pesca e aquicultura | 2020 | 23393.557114 | -34593.308607 | 2756.938589 |
| 0580\nExtração de carvão mineral e de minerais não-metálicos | 2020 | 12780.776306 | 419.651840 | 1040.023262 |
| 0680\nExtração de petróleo e gás, inclusive as atividades de apoio | 2020 | 131319.134611 | 2611.296027 | 470.467326 |
| ... | ... | ... | ... | ... |
| 8691 + 8692\nSaúde | 2020 | 309474.34351 | 173.138934 | 12731.747667 |
| 9080\nAtividades artísticas, criativas e de espetáculos | 2020 | 21619.992666 | 30.165292 | 2381.776043 |
| 9480\nOrganizações associativas e outros serviços pessoais | 2020 | 94739.917992 | 91.784941 | 5932.893967 |
| 9700\nServiços domésticos | 2020 | 32717.423064 | 0.000000 | 4.419046 |
| \nRESIDENCIAL | 2020 | 1756149.519048 | 91105.313767 | 997684.753973 |
67 rows × 4 columns
1 maintainer

Release files for sirene 0.0.20
For a detailed explanation of source distributions (sdists) and built distributions (wheels), please see the package formats documentation.
Source distribution (sdist)
| File | Size | Uploaded | |
|---|---|---|---|
| sirene-0.0.20.tar.gz | 1.6 MB | Details |
Built distribution (wheel)
| File | Interpreter | ABI | Platform | Reset |
|---|---|---|---|---|
| sirene-0.0.20-py3-none-any.whl | Python 3 | none | any | Details |
Total release size: 3.2 MB
Release files / sirene-0.0.20.tar.gz
| Download URL | sirene-0.0.20.tar.gz |
|---|---|
| Size | 1.6 MB |
| Tags | Source |
|
SHA-256 checksum How to use checksums |
e71e39732fe747177cf4b1164c0a90fc1d85ec75056c65058fc98a5f8b260fb0
|
|
BLAKE2b-256 checksum How to use checksums |
1568320b1dec97b9a018df10e6939b4bfa47a81c5ec1b4b25e1d22e3f05002b3
|
| Upload date | |
|
Uploaded using Trusted Publishing? What is trusted publishing? |
Yes |
| Uploaded via |
twine/5.1.1 CPython/3.12.7
|
Provenance
Provenance describes where a file came from. On PyPI, provenance is shared via attestations, which provide a verifiable record of the build or publishing details. View details, limitations and caveats.


PyPI Publish Attestation
PyPI verified that this artifact, at this checksum, originated from the publisher listed below.
Signed by GitHub Actions, verified by PyPI on Nov 26, 2024.
Transparency logRelease files / sirene-0.0.20-py3-none-any.whl
| Download URL | sirene-0.0.20-py3-none-any.whl |
|---|---|
| Size | 1.6 MB |
| Tags | Python 3 |
|
SHA-256 checksum How to use checksums |
76f862a7f014e5d4ba8bc9cece30a8a6abf90cd8658a87fdd5b349cd1e3fcbd4
|
|
BLAKE2b-256 checksum How to use checksums |
0b27a3341c12f49474edcd747544144d567d84b083741179c6e8be64ebead598
|
| Upload date | |
|
Uploaded using Trusted Publishing? What is trusted publishing? |
Yes |
| Uploaded via |
twine/5.1.1 CPython/3.12.7
|
Provenance
Provenance describes where a file came from. On PyPI, provenance is shared via attestations, which provide a verifiable record of the build or publishing details. View details, limitations and caveats.
PyPI Publish Attestation
PyPI verified that this artifact, at this checksum, originated from the publisher listed below.
Signed by GitHub Actions, verified by PyPI on Nov 26, 2024.
Transparency log













