
skeleton


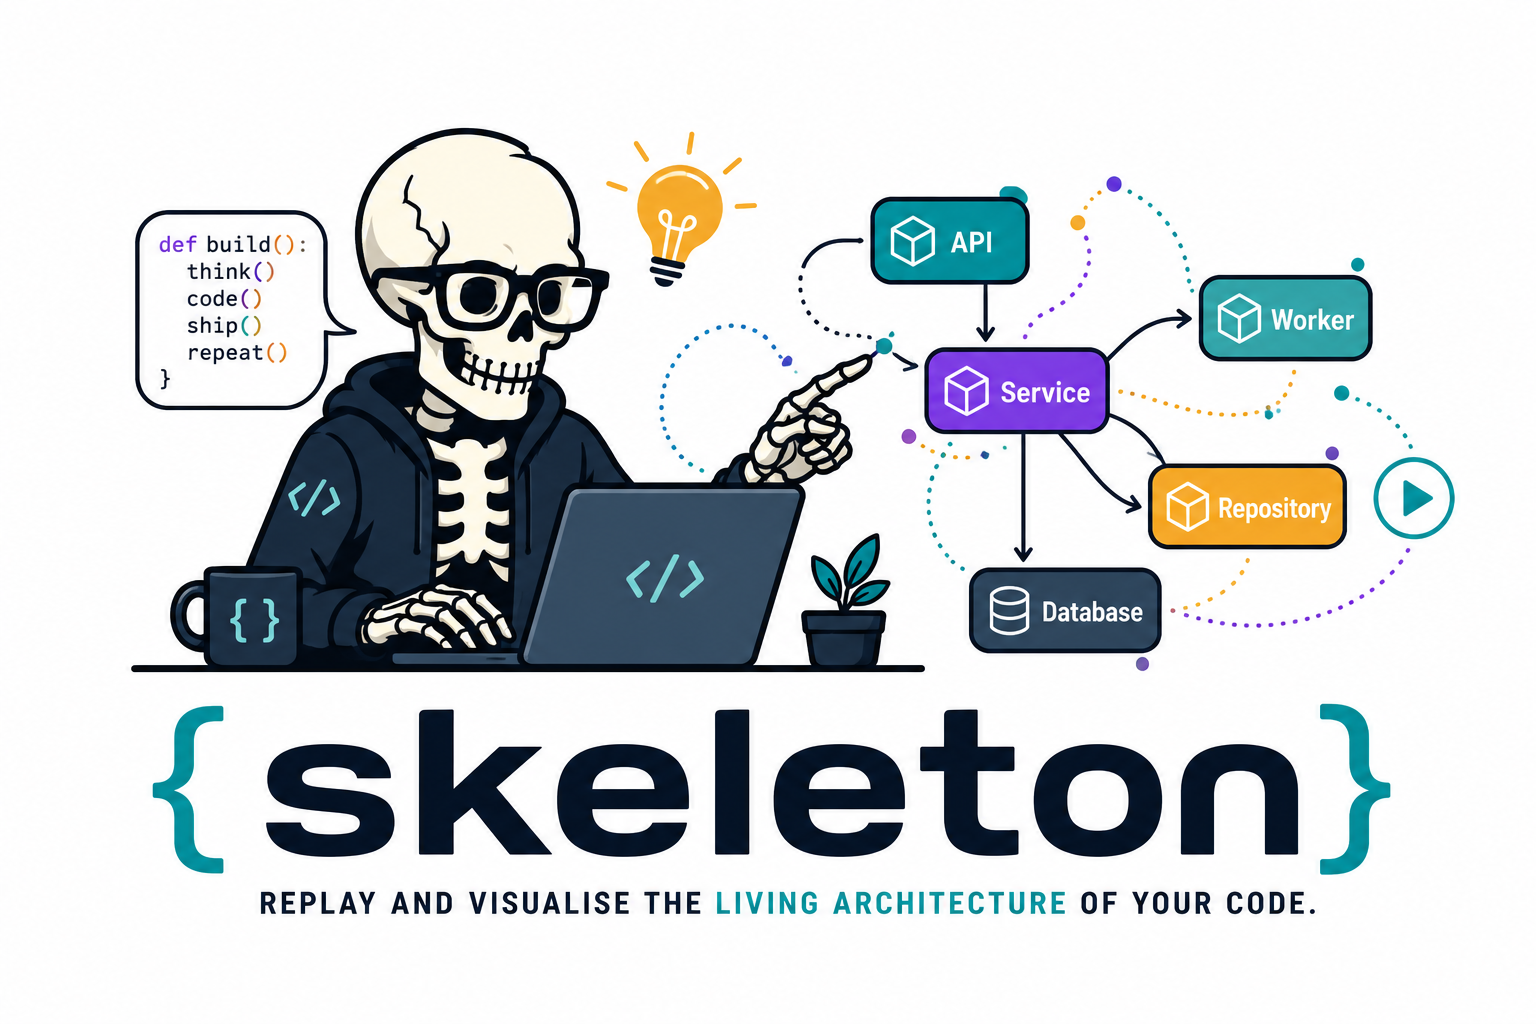
Skeleton is a developer-understanding tool, not a profiler. It runs a Python script under a lightweight runtime tracer and turns the observed execution into an interactive, replayable architecture map.
Replay and visualise the living architecture of a Python application.
What Skeleton gives you
 Runtime trace trace.jsonl records ordered project-local call, return, and resource-boundary events.
|
 Architecture snapshot snapshot.json turns the observed run into modules, functions, instances, resources, and edges.
|
 Workflow narrative workflow.md gives humans and LLMs stable event ids, node ids, caller/callee evidence, and safe examples.
|
 Interactive replay report.html lets you step through the architecture as runtime evidence appears.
|
 Safe value summaries Arguments and return values are summarized, truncated, and redacted instead of copied into the trace. |
 Ownership-focused graph Runtime object instances, public methods, module functions, and external resources keep their architectural roles visible. |
Every run also writes session.json, a stable manifest for IDEs and automation tools.
Package naming:
Product name:  Skeleton
PyPI package:  skeleton-replay
Import name:   skeleton_replay
CLI command:   skeleton
Module entry:  python -m skeleton_replay
MVP workflow
pip install skeleton-replay
skeleton run path/to/script.py
Skeleton writes:
path/to/.skeleton/script/latest/
  trace.jsonl
  snapshot.json
  workflow.md
  session.json
  report.html
The first version is intentionally non-invasive. You do not add decorators or modify application code. The runner wraps an existing script, traces only project-local public functions and methods by default, and records safe summaries of arguments and return values.
Skeleton is opinionated about what makes large Python systems understandable.
It promotes explicit architectural actors, clear dependency direction, and I/O
decoupled from business logic. Modules are visual shells, runtime object
instances live inside the modules that define their classes, module-level public
functions live inside their modules, and instance methods live inside the object
that handled the call. Class definitions remain metadata, not runtime graph
boxes. Entrypoints, services, repositories, adapters, and ports are roles or
boundaries unless the codebase has a concrete object that owns that
responsibility. See
docs/design/README.md
for the design principles that guide the visual model.
workflow.md is a compact text explanation of the observed run. It is designed
for humans and LLMs: event ids, node ids, caller/callee relationships, safe
examples, and known trace gaps are written in a form that can be quoted and
reasoned over without scraping the HTML report.
Install and develop
make setup
make check
Use make test for normal or targeted local pytest runs. Use make test-cov
or make check when you want the full-suite coverage gate that CI enforces.
Print the local artifact locations:
make where
Run locally from the checkout:
uv run python -m skeleton_replay run examples/app.py
Generate a stable local demo report:
make demo
The demo writes artifacts to tests/dev/.temp/skeleton-demo/ and opens
report.html in your default browser. For a headless run that writes the same
files without opening a browser, use:
make demo-no-open
Pytest tests use tmp_path, so test-generated reports live in pytest-managed
temporary directories under tests/dev/.temp/pytest/. The stable report to open
while developing the UI is:
tests/dev/.temp/skeleton-demo/report.html
Regenerate it with:
make demo-no-open
CLI
skeleton run [options] path/to/script.py [args...]
Existing pytest scenarios can also be traced without adding decorators or test-suite hooks:
skeleton pytest [options] -- tests/test_checkout.py -q
The module entrypoint is also available:
python -m skeleton_replay run [options] path/to/script.py [args...]
python -m skeleton_replay pytest [options] -- tests/test_checkout.py -q
Options:
--project-root PATH   Root used to decide which files are project-local.
--out-dir PATH        Output directory. Defaults vary by command; see precedence below.
--include PATTERN     Only trace matching relative paths or module names.
--exclude PATTERN     Exclude matching relative paths or module names.
--max-events N        Stop writing trace events after N events.
--no-html             Skip report.html generation and opening.
--no-open             Do not open report.html after generation.
For skeleton pytest, put pytest's own flags after -- when they begin with a
dash. Skeleton preserves pytest's exit code and still writes partial artifacts
when tests fail.
Every run also writes session.json. IDE integrations should read this manifest
first: it records the Skeleton version, command, invocation, target, artifact
paths, metrics, target exit code, and any target error.
Output location precedence:
--out-dir PATHSKELETON_OUT_DIRSKELETON_HOME/<application-name>- Target-local defaults:
skeleton run path/to/scenario.py:path/to/.skeleton/scenario/latest/skeleton pytest -- tests/foo/test_bar.py::test_x:tests/foo/.skeleton/test_bar/test_x/latest/- parametrized pytest nodes use deterministic filesystem-safe slugs.
- whole-file pytest runs use
<test-dir>/.skeleton/<file-stem>/file/latest/. - whole-directory pytest runs use
<directory>/.skeleton/directory/latest/.
~/.skeleton/<application-name>when no target-local path can be inferred.
When HTML generation is enabled, Skeleton opens report.html in your default
browser at the end of the run. Use --no-open for CI, scripts, or headless
environments.
The HTML report is a step-through architecture replay. The replay dock can be collapsed when you need more graph space, and the selected trace window can be set either with handles or by typing Start and End event numbers. Private calls remain available by default and can be hidden with the existing private-call control; when the selected event is hidden, the report keeps the nearest visible caller-chain context in focus and notes that the selected private event is hidden.
Python API
Use trace() when code is already running in your process, for example inside
a fixture-backed test:
from pathlib import Path

from skeleton_replay import trace

with trace(project_root=Path("."), label="Monitor") as session:
    Monitor({}).run()

print(session.result.report_path)
print(session.result.event_count)
The skeleton_trace pytest fixture exposes the same context manager while
preserving active fixtures and monkeypatches:
def test_monitor(skeleton_trace):
    with skeleton_trace("Monitor") as session:
        Monitor({}).run()

    assert session.result.succeeded
Use TraceSession when you want to generate Skeleton artifacts from Python
without shelling out to the CLI or when you want to reuse one configured session:
from pathlib import Path

from skeleton_replay import TraceSession

result = TraceSession(
    project_root=Path("path/to/project"),
    out_dir=Path("path/to/project/.skeleton"),
).run_script("path/to/project/app.py")

print(result.report_path)
print(result.workflow_path)
The Python API writes the same trace.jsonl, snapshot.json, workflow.md,
session.json, quality, and optional report.html artifacts as the CLI. Unlike
the CLI, it does not open the HTML report by default; pass open_report=True
when that is wanted.
See docs/api/python-api.md.
What gets traced
Skeleton uses sys.setprofile and records Python call and return events
when all of these are true:
- The frame's file is under the project root.
- The file is not in ignored local infrastructure such as
.venv,.git, or.skeleton. - The callable name is traceable. Single-underscore private/internal names are recorded and marked as private; Python-generated names and dunder methods are ignored.
The trace identifies the module, class where practical, function or method, caller, callee, instance identity where practical, call depth, event order, timestamp, safe argument summaries, and safe return summaries.
When project-local code is already on the trace stack, Skeleton also records a small allow-list of standard-library boundary calls. Today that includes stdout, filesystem operations, SQLite operations, and basic network socket calls. Filesystems, stdout, and databases appear as resource cylinders. Network calls appear as external-service diamonds, because an external service is an architectural collaborator rather than an I/O resource.
How it works
Skeleton does not patch your source code. It uses Python's own runtime introspection:
runpy.run_path()runs the target script as__main__inside a controlled runner.sys.setprofile()receives callbacks whenever Python enters or returns from a function, plus selected C-level resource calls such asprintorsqlite3.connect.- Each callback receives a frame object. From that frame Skeleton reads
frame.f_code,frame.f_globals, andframe.f_localsto identify the file, module, function name, line number, arguments, and whether the call hasself. - When
selfis present, Skeleton recordstype(self).__name__andid(self), giving a run-local object identity such asservice.Greeter@0x.... - Values are summarized immediately, then the raw objects are discarded.
That is why the report can show instance-owned methods without decorators. It is not reading class source to guess behavior; it is watching Python call real functions on real objects. The object ids are only meaningful within one run, not across processes or commits.
For more detail, see docs/design/README.md.
Current scope and next integrations
Skeleton currently runs a script path, a pytest invocation, or an in-process callable context:
python -m skeleton_replay run scripts/replay_checkout.py
python -m skeleton_replay pytest -- tests/test_checkout.py -q
The script path can drive any kind of Python code: CLI workflows, service objects, batch jobs, web-app internals, or library calls. The application being traced does not need to be a CLI application. Pytest tracing covers projects whose existing tests already exercise useful behavior.
Planned integrations:
run-module: support module execution such aspython -m my_app.cli run-demo, exposed as something likeskeleton run-module my_app.cli -- run-demo.- pytest plugin hooks: richer per-test reports and mark-based scenario
selection on top of the current
skeleton pytestcommand. - live web request tracing: trace one request or handler inside a running FastAPI, Flask, Django, or Starlette app through middleware or a capture context.
- PyCharm plugin: a thin IDE frontend that invokes Skeleton with the configured interpreter and opens the generated report.
See docs/api/python-api.md and
docs/development/README.md.
Release history is tracked in CHANGELOG.md. Keep the
changelog updated in the same pull request or commit that changes user-visible
behavior.
Event schema
Each line in .skeleton/trace.jsonl is a JSON object:
{
  "schema_version": 1,
  "event_type": "call",
  "order": 0,
  "timestamp": 1782740000.0,
  "depth": 0,
  "caller": null,
  "callee": {
    "module": "app",
    "class_name": null,
    "function": "main",
    "qualified_name": "app.main",
    "file": "/project/app.py",
    "line": 10,
    "node_id": "function:app.main",
    "instance_id": null,
    "endpoint_type": "function",
    "resource_category": null
  },
  "args": {}
}
Return events use the same endpoint shape and include return_value.
Resource endpoints use the same shape with endpoint_type: "resource", a
resource_category such as stdout, file, or db, and a
node_id beginning with resource:. Resource nodes are aggregated by boundary
kind, for example resource.database or resource.stdout; the specific
operation, such as connect or print, is kept in the safe event evidence.
Network endpoints use endpoint_type: "external_service" and render as
diamond-shaped external service entities.
Safety model
Skeleton records summaries, not full object contents.
- Strings are truncated.
- Containers include type, length, and a small preview.
- Objects include only class name and object id.
- Argument or mapping names containing
password,token,secret,key,auth, orcredentialare redacted.
This is not a debugger replacement and not a performance profiler. It is a runtime architecture replay tool for understanding how a codebase behaves.
1 maintainer

Download files
Download the file for your platform. If you're not sure which to choose, learn more about installing packages.
Source Distribution
Built Distribution
Filter files by name, interpreter, ABI, and platform.
If you're not sure about the file name format, learn more about wheel file names.
Copy a direct link to the current filters
File details
Details for the file skeleton_replay-0.11.0.tar.gz.
File metadata
- Download URL: skeleton_replay-0.11.0.tar.gz
- Upload date:
- Size: 90.9 kB
- Tags: Source
- Uploaded using Trusted Publishing? Yes
- Uploaded via: twine/6.1.0 CPython/3.13.14
File hashes
| Algorithm | Hash digest | |
|---|---|---|
| SHA256 |
edcddf5c9d6b19c01c373d5a7abea9c0b2d177628caf7783322ca20ef0e64aa6
|
|
| MD5 |
5abc8460b66a6fe758fe1c7809f581ce
|
|
| BLAKE2b-256 |
3c8b2e651bbafab526c8dbc61ad563faf626fd0362e8eb3cff65b3b3f3deb8f0
|
Provenance
The following attestation bundles were made for skeleton_replay-0.11.0.tar.gz:
Publisher:
publish.yml on ml-affairs/skeleton
-
Statement:
-
Statement type:
https://in-toto.io/Statement/v1 -
Predicate type:
https://docs.pypi.org/attestations/publish/v1 -
Subject name:
skeleton_replay-0.11.0.tar.gz -
Subject digest:
edcddf5c9d6b19c01c373d5a7abea9c0b2d177628caf7783322ca20ef0e64aa6 - Sigstore transparency entry: 2248091538
- Sigstore integration time:
-
Permalink:
ml-affairs/skeleton@6765a4aa6ccdf0d02f4f628c5249121242d6ae57 -
Branch / Tag:
refs/tags/v0.11.0 - Owner: https://github.com/ml-affairs
-
Access:
public
-
Token Issuer:
https://token.actions.githubusercontent.com -
Runner Environment:
github-hosted -
Publication workflow:
publish.yml@6765a4aa6ccdf0d02f4f628c5249121242d6ae57 -
Trigger Event:
push
-
Statement type:
File details
Details for the file skeleton_replay-0.11.0-py3-none-any.whl.
File metadata
- Download URL: skeleton_replay-0.11.0-py3-none-any.whl
- Upload date:
- Size: 104.4 kB
- Tags: Python 3
- Uploaded using Trusted Publishing? Yes
- Uploaded via: twine/6.1.0 CPython/3.13.14
File hashes
| Algorithm | Hash digest | |
|---|---|---|
| SHA256 |
db8e7895856ee1736c617a490cfbc71231f78af8f7763d270ac1a0a6a2fa076e
|
|
| MD5 |
a27cef2aad07a11f29a090e0498fbe09
|
|
| BLAKE2b-256 |
bc508b6558b1ede20769850e4da9256e371257a11c7476c6a51f577514143798
|
Provenance
The following attestation bundles were made for skeleton_replay-0.11.0-py3-none-any.whl:
Publisher:
publish.yml on ml-affairs/skeleton
-
Statement:
-
Statement type:
https://in-toto.io/Statement/v1 -
Predicate type:
https://docs.pypi.org/attestations/publish/v1 -
Subject name:
skeleton_replay-0.11.0-py3-none-any.whl -
Subject digest:
db8e7895856ee1736c617a490cfbc71231f78af8f7763d270ac1a0a6a2fa076e - Sigstore transparency entry: 2248091752
- Sigstore integration time:
-
Permalink:
ml-affairs/skeleton@6765a4aa6ccdf0d02f4f628c5249121242d6ae57 -
Branch / Tag:
refs/tags/v0.11.0 - Owner: https://github.com/ml-affairs
-
Access:
public
-
Token Issuer:
https://token.actions.githubusercontent.com -
Runner Environment:
github-hosted -
Publication workflow:
publish.yml@6765a4aa6ccdf0d02f4f628c5249121242d6ae57 -
Trigger Event:
push
-
Statement type:







