
A Python package for processing and visualizing SkillCorner data with SkillCorner brand styling.


Project description
SkillCornerviz Overview
The SkillCornerviz Library is a Python package that provides functions to create standard visualizations frequently used by the SkillCorner data analysis team. It also includes functions to normalize SkillCorner data in various ways. This package is designed to streamline the data analysis process and facilitate the creation of insightful visualizations.
File Structure
skillcornerviz/
├── resources/
│   ├── Roboto/   # Roboto font files (.ttf)
│   └── Shentox/  # Shentox font files (.otf)
├── standard_plots/
│   ├── __init__.py
│   ├── bar_plot.py
│   ├── formatting.py
│   ├── narrative_ranking_plot.py
│   ├── radar_plot.py
│   ├── scatter_plot.py
│   ├── summary_table.py
│   ├── swarm_violin_plot.py
│   ├── table_grid.py
│   └── zscore_dotplot.py
├── utils/
│   ├── __init__.py
│   ├── _fonts.py
│   ├── constants.py
│   ├── skillcorner_colors.py
│   ├── skillcorner_game_intelligence_utils.py
│   ├── skillcorner_physical_utils.py
│   └── skillcorner_utils.py
└── __init__.py
Installation Instructions
- Open the Terminal
- Ensure python is installed by running the command
python --versionthrough the terminal. - Ensure pip is installed by running the command
pip --versionthrough the terminal. - Once both python and pip are installed, you can install the package using
pip install skillcornerviz. - Ensure that the package is installed using
pip show skillcornervizwhich will display information about the package if it has been installed.
Plot Examples - Including Code Snippets
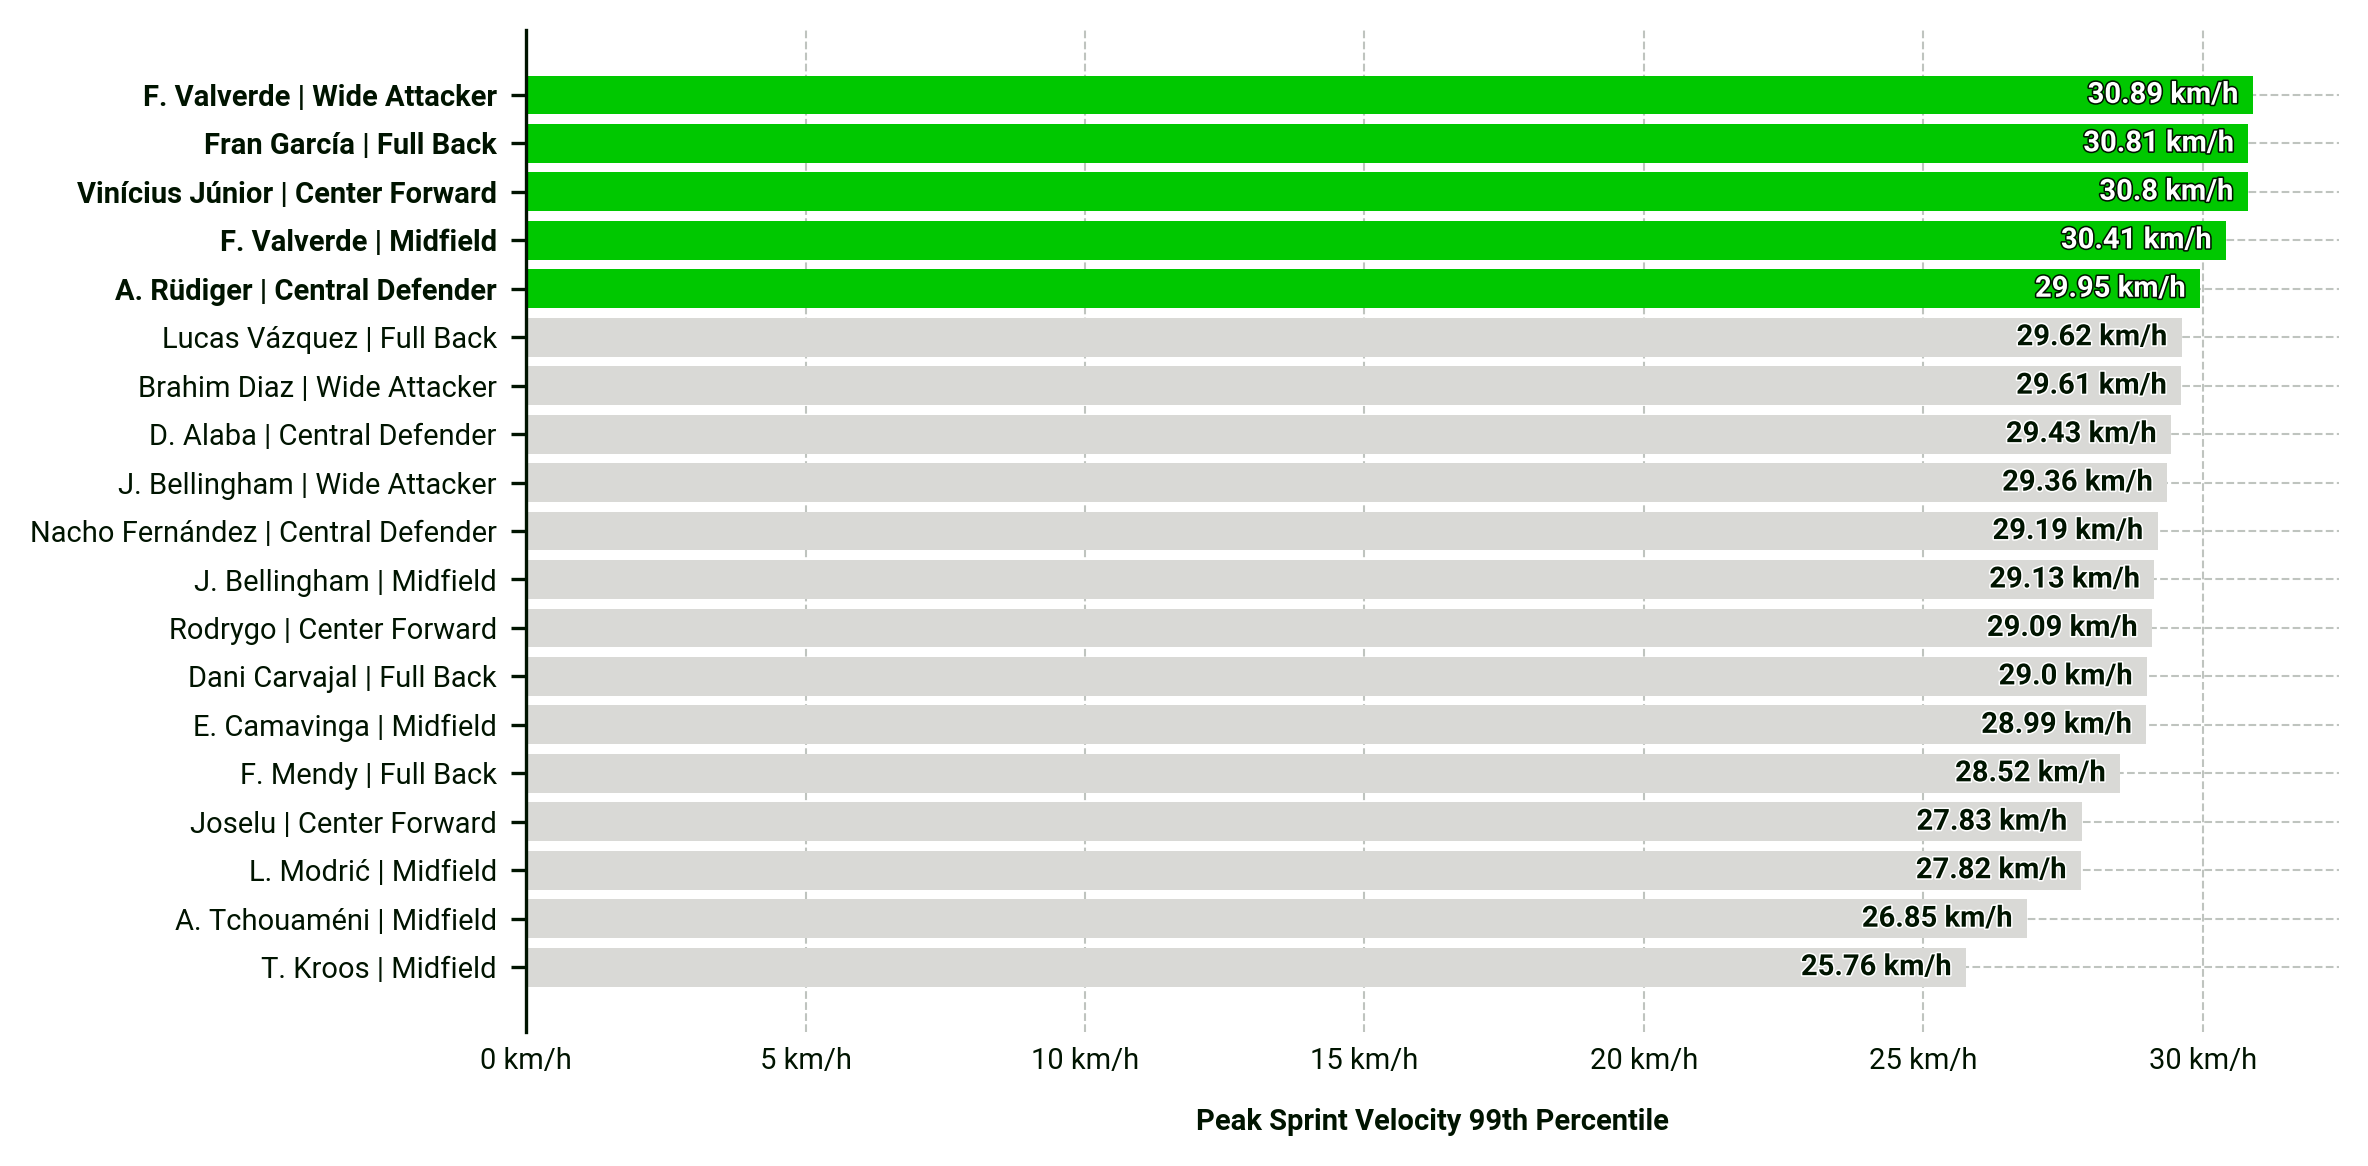
Bar Plot
Code Snippet:
from skillcornerviz.standard_plots import bar_plot as bar
from skillcornerviz.utils import skillcorner_physical_utils as p_utils
from skillcorner.client import SkillcornerClient
import pandas as pd

client = SkillcornerClient(username='YOUR USERNAME', password='YOUR PASSWORD')
data = client.get_physical(params={'competition': 4, 'season': 28,
                                    'group_by': 'player,team,competition,season,group',
                                    'possession': 'all,tip,otip',
                                    'playing_time__gte': 60,
                                    'count_match__gte':8,
                                    'data_version': '3'})

df = pd.DataFrame(data)
metrics = p_utils.add_standard_metrics(df)

df['plot_label'] = df['player_short_name'] + ' | ' + df['position_group']

fig, ax = bar.plot_bar_chart(df=df[(df['team_id'] == 262)],
                             metric='psv99',
                             label='Peak Sprint Velocity 99th Percentile',
                             unit='km/h',
                             primary_highlight_group=[12253, 12251, 993, 31993],
                             add_bar_values=True,
                             data_point_id='player_id',
                             data_point_label='plot_label')
Bar Plot Figure:
Scatter Plot
Code Snippet:
from skillcornerviz.standard_plots import scatter_plot as scatter
from skillcornerviz.utils import skillcorner_physical_utils as p_utils
from skillcorner.client import SkillcornerClient
import pandas as pd


client = SkillcornerClient(username='YOUR USERNAME', password='YOUR PASSWORD')
data = client.get_physical(params={'competition': 4,
                                   'season': 28,
                                   'group_by': 'player,team,competition,season,group',
                                   'possession': 'all,tip,otip',
                                   'playing_time__gte': 60,
                                   'count_match__gte':8,
                                   'data_version': '3'})

df = pd.DataFrame(data)
metrics = p_utils.add_standard_metrics(df)

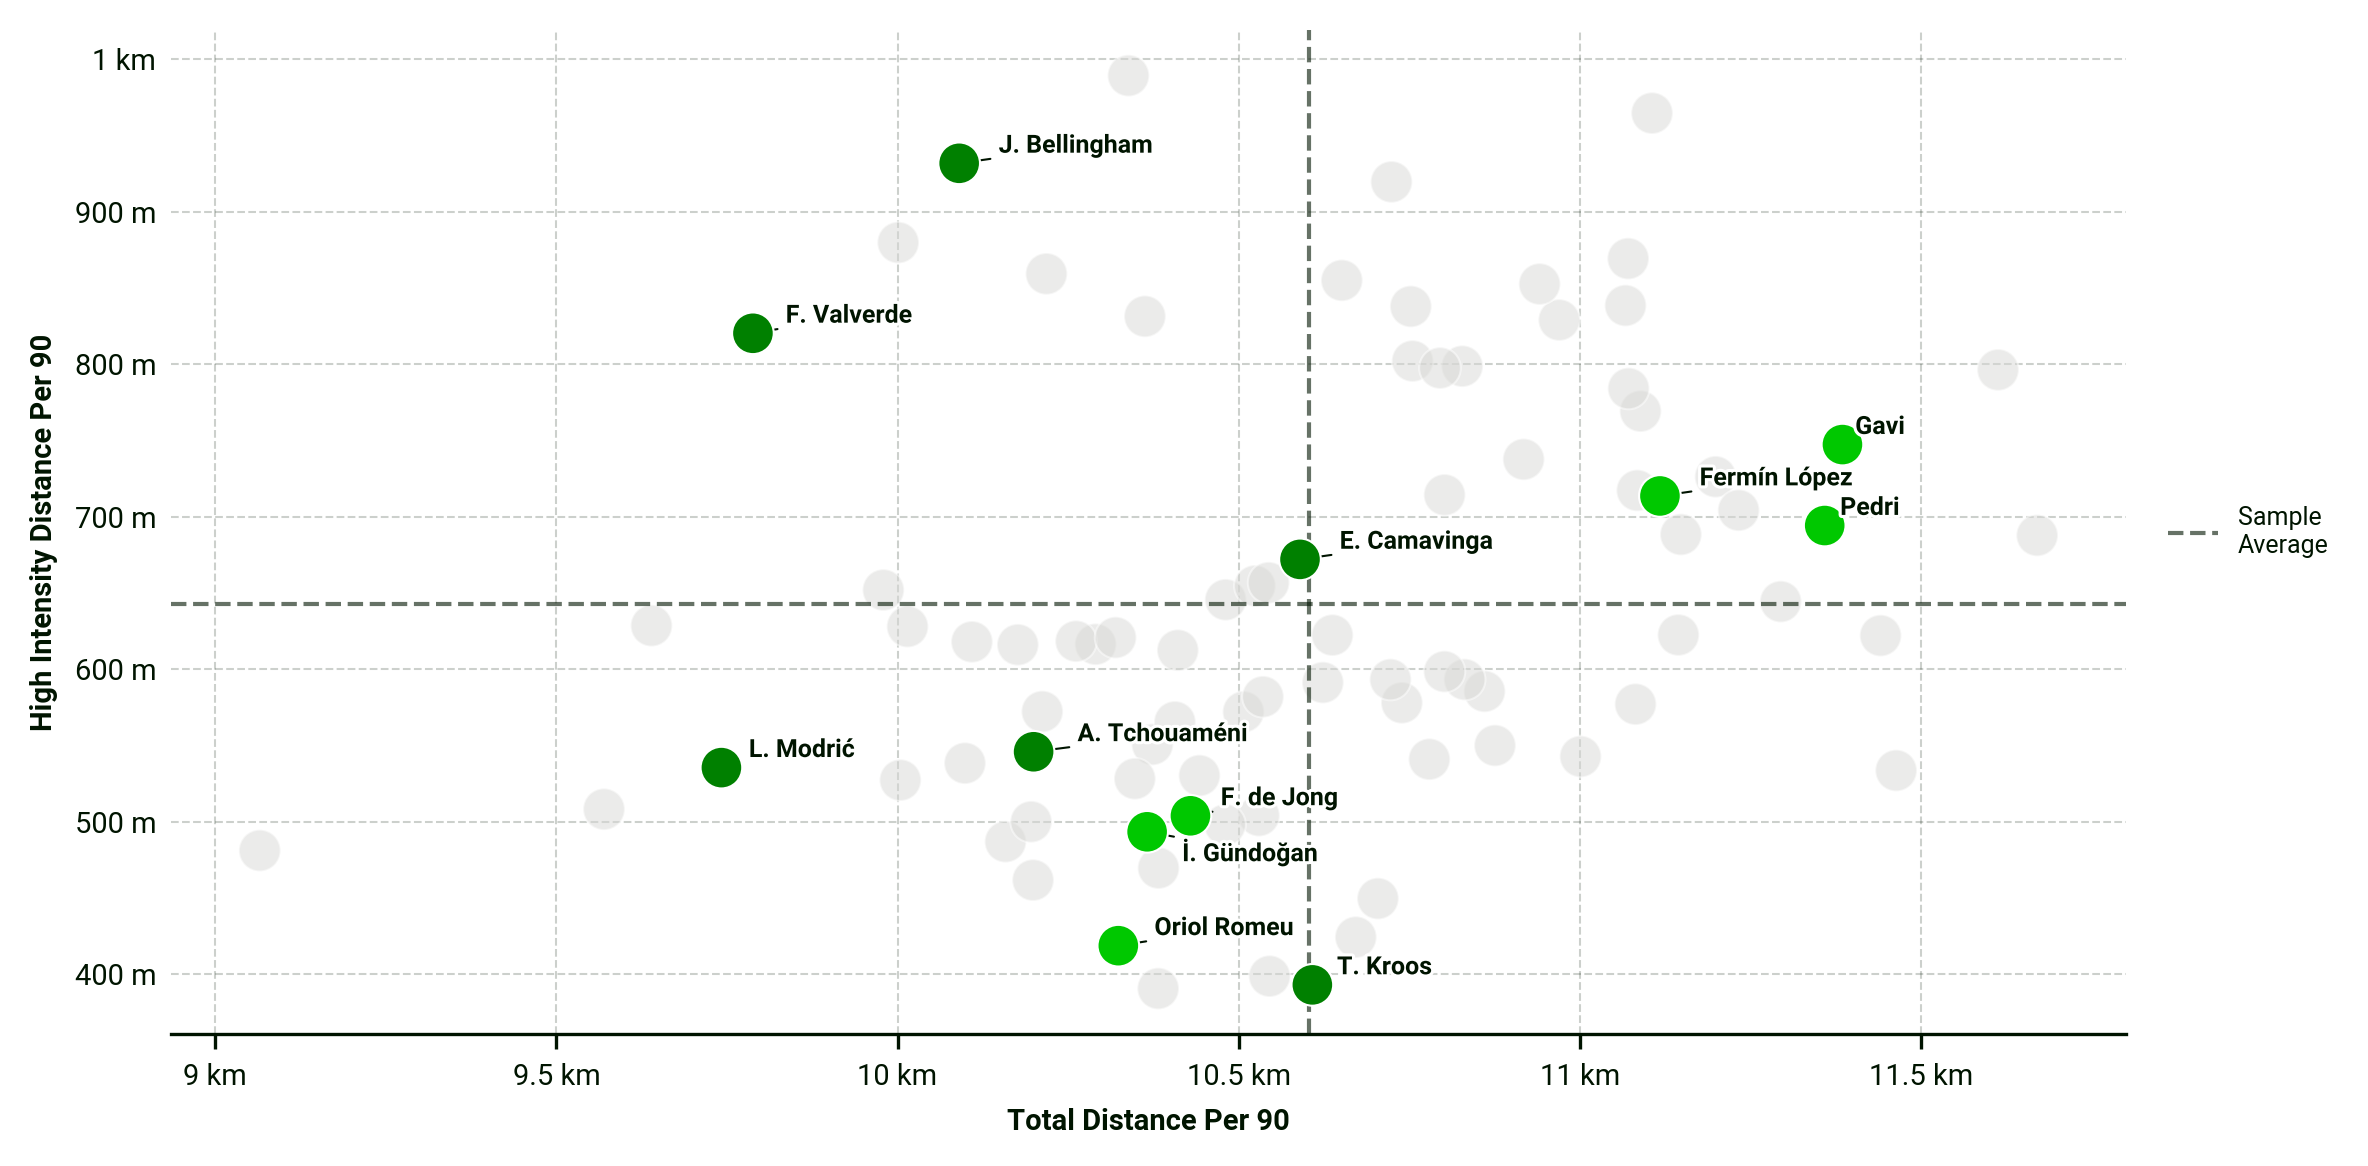
fig, ax = scatter.plot_scatter(df=df[df['position_group'].isin(['Midfield'])],
                               x_metric='total_distance_per_90',
                               y_metric='hi_distance_per_90',
                               data_point_id='team_name',
                               data_point_label='player_short_name',
                               x_label='Total Distance Per 90',
                               y_label="High Intensity Distance Per 90",
                               x_unit='m',
                               y_unit='m',
                               primary_highlight_group=['FC Barcelona'],
                               secondary_highlight_group=['Real Madrid CF'])
Scatter Plot Figure
Radar Plot
Code Snippet
from skillcornerviz.standard_plots import radar_plot as radar
from skillcorner.client import SkillcornerClient
import pandas as pd

client = SkillcornerClient(username='YOUR_USERNAME', password='YOUR_PASSWORD')

# Request data for LaLiga 2023/2024.
data = client.get_in_possession_off_ball_runs(params={'competition': 4,
                                                      'season': 28,
                                                      'playing_time__gte': 60,
                                                      'count_match__gte': 8,
                                                      'average_per': '30_min_tip',
                                                      'group_by': 'player,competition,team,group',
                                                      'run_type': 'all,run_in_behind,run_ahead_of_the_ball,'
                                                                 'support_run,pulling_wide_run,coming_short_run,'
                                                                 'underlap_run,overlap_run,dropping_off_run,'
                                                                 'pulling_half_space_run,cross_receiver_run'})

df = pd.DataFrame(data)

RUNS = {'count_cross_receiver_runs_per_30_min_tip': 'Cross Receiver',
        'count_runs_in_behind_per_30_min_tip': ' In Behind',
        'count_runs_ahead_of_the_ball_per_30_min_tip': 'Ahead Of The Ball',
        'count_overlap_runs_per_30_min_tip': 'Overlap',
        'count_underlap_runs_per_30_min_tip': 'Underlap',
        'count_support_runs_per_30_min_tip': 'Support',
        'count_coming_short_runs_per_30_min_tip': 'Coming Short',
        'count_dropping_off_runs_per_30_min_tip': 'Dropping Off',
        'count_pulling_half_space_runs_per_30_min_tip': 'Pulling Half-Space',
        'count_pulling_wide_runs_per_30_min_tip': 'Pulling Wide'}

# Plot off-ball run radar for Nico Williams.
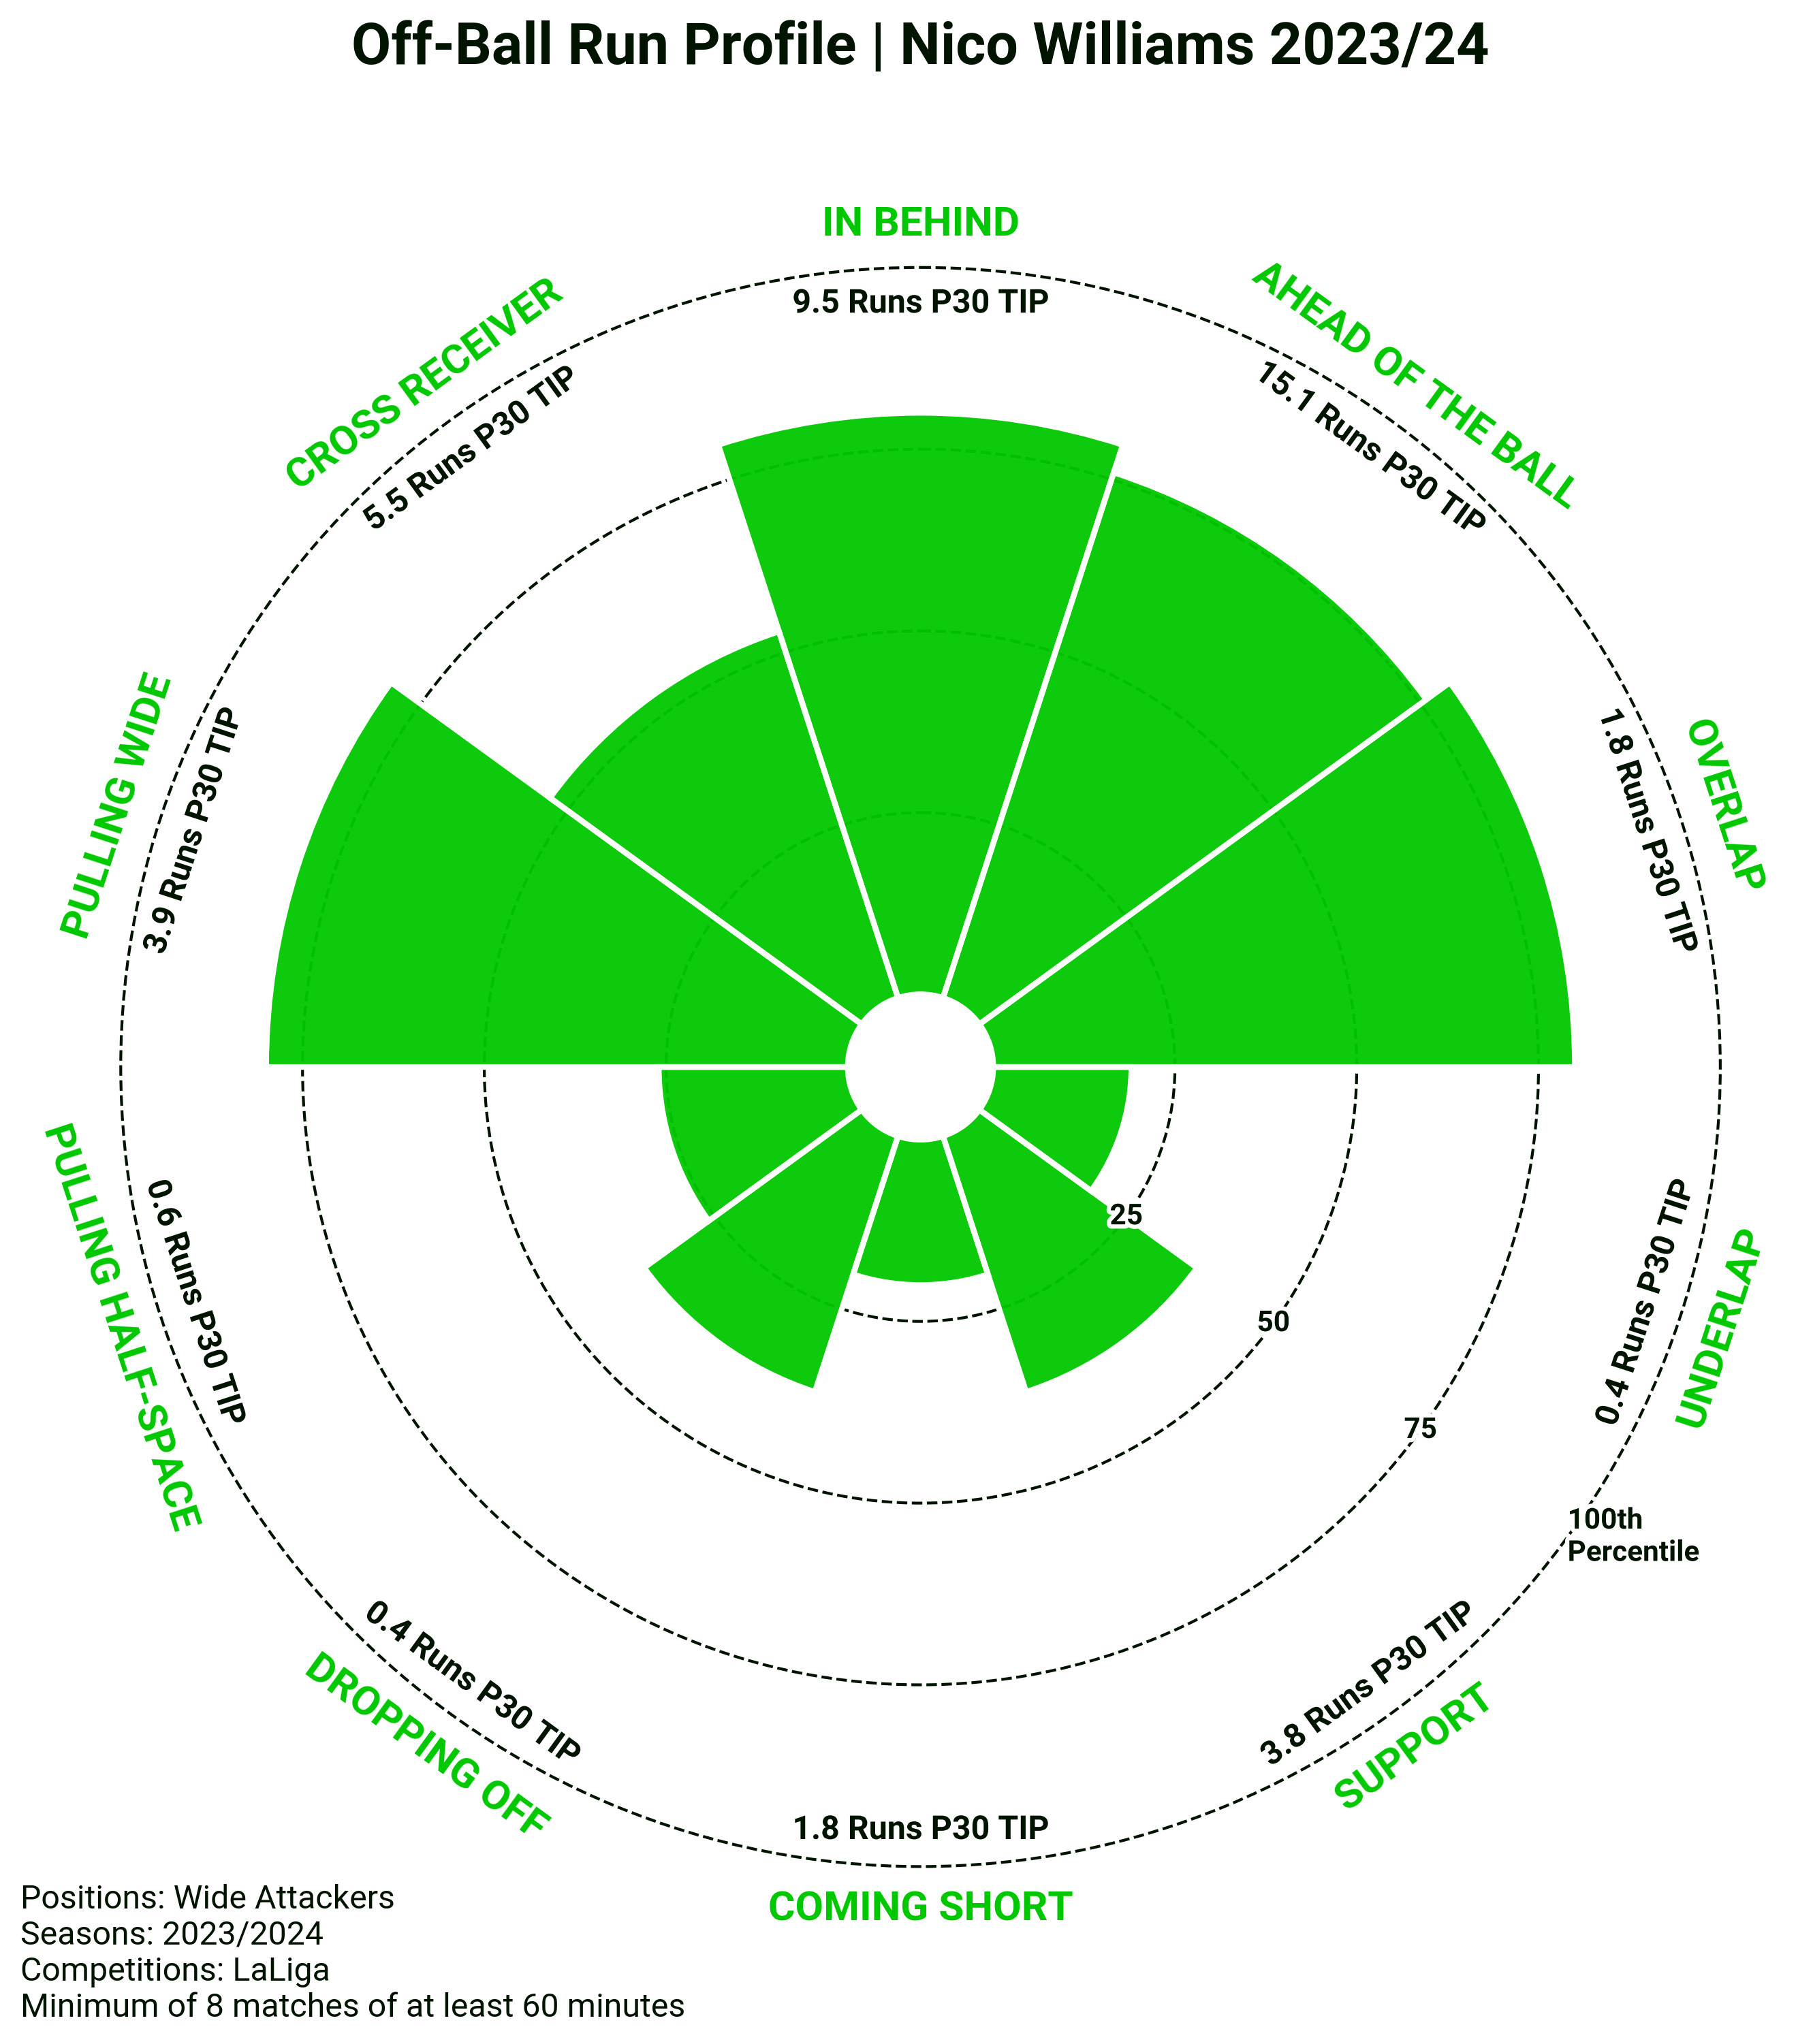
fig, ax = radar.plot_radar(df=df[df['group'] == 'Wide Attacker'],
                            data_point_id='player_id',
                            label=35342,
                            plot_title='Off-Ball Run Profile | Nico Williams 2023/24',
                            metrics=RUNS.keys(),
                            metric_labels=RUNS,
                            percentiles_precalculated=False,
                            suffix=' Runs P30 TIP',
                            positions='Wide Attackers',
                            matches=8,
                            minutes=60,
                            competitions='LaLiga',
                            seasons='2023/2024',
                            add_sample_info=True)
Radar Plot Figure
Summary Table
Code Snippet
from skillcornerviz.standard_plots import summary_table as table
from skillcornerviz.utils import skillcorner_physical_utils as p_utils
from skillcorner.client import SkillcornerClient
import pandas as pd

client = SkillcornerClient(username='YOUR USERNAME', password='YOUR PASSWORD')
data = client.get_physical(params={'competition': 4,
                                      'season': 28,
                                      'group_by': 'player,team,competition,season,group',
                                      'playing_time__gte': 60,
                                      'count_match__gte': 8,
                                      'possession': 'all,tip,otip',
                                      'data_version': '3'})

df = pd.DataFrame(data)
metrics = p_utils.add_standard_metrics(df)

plot_metrics = {'meters_per_minute_tip' : 'Meters Per Minute TIP',
        'meters_per_minute_otip' : 'Meters Per Minute OTIP',
        'highaccel_count_per_60_bip': 'Number Of High Accels Per 60 BIP',
        'highdecel_count_per_60_bip': 'Number Of High Decels Per 60 BIP',
        'sprint_count_per_60_bip': 'Number Sprints Per 60 BIP',
        'psv99' : 'Peak Sprint Velocity 99th Percentile'}

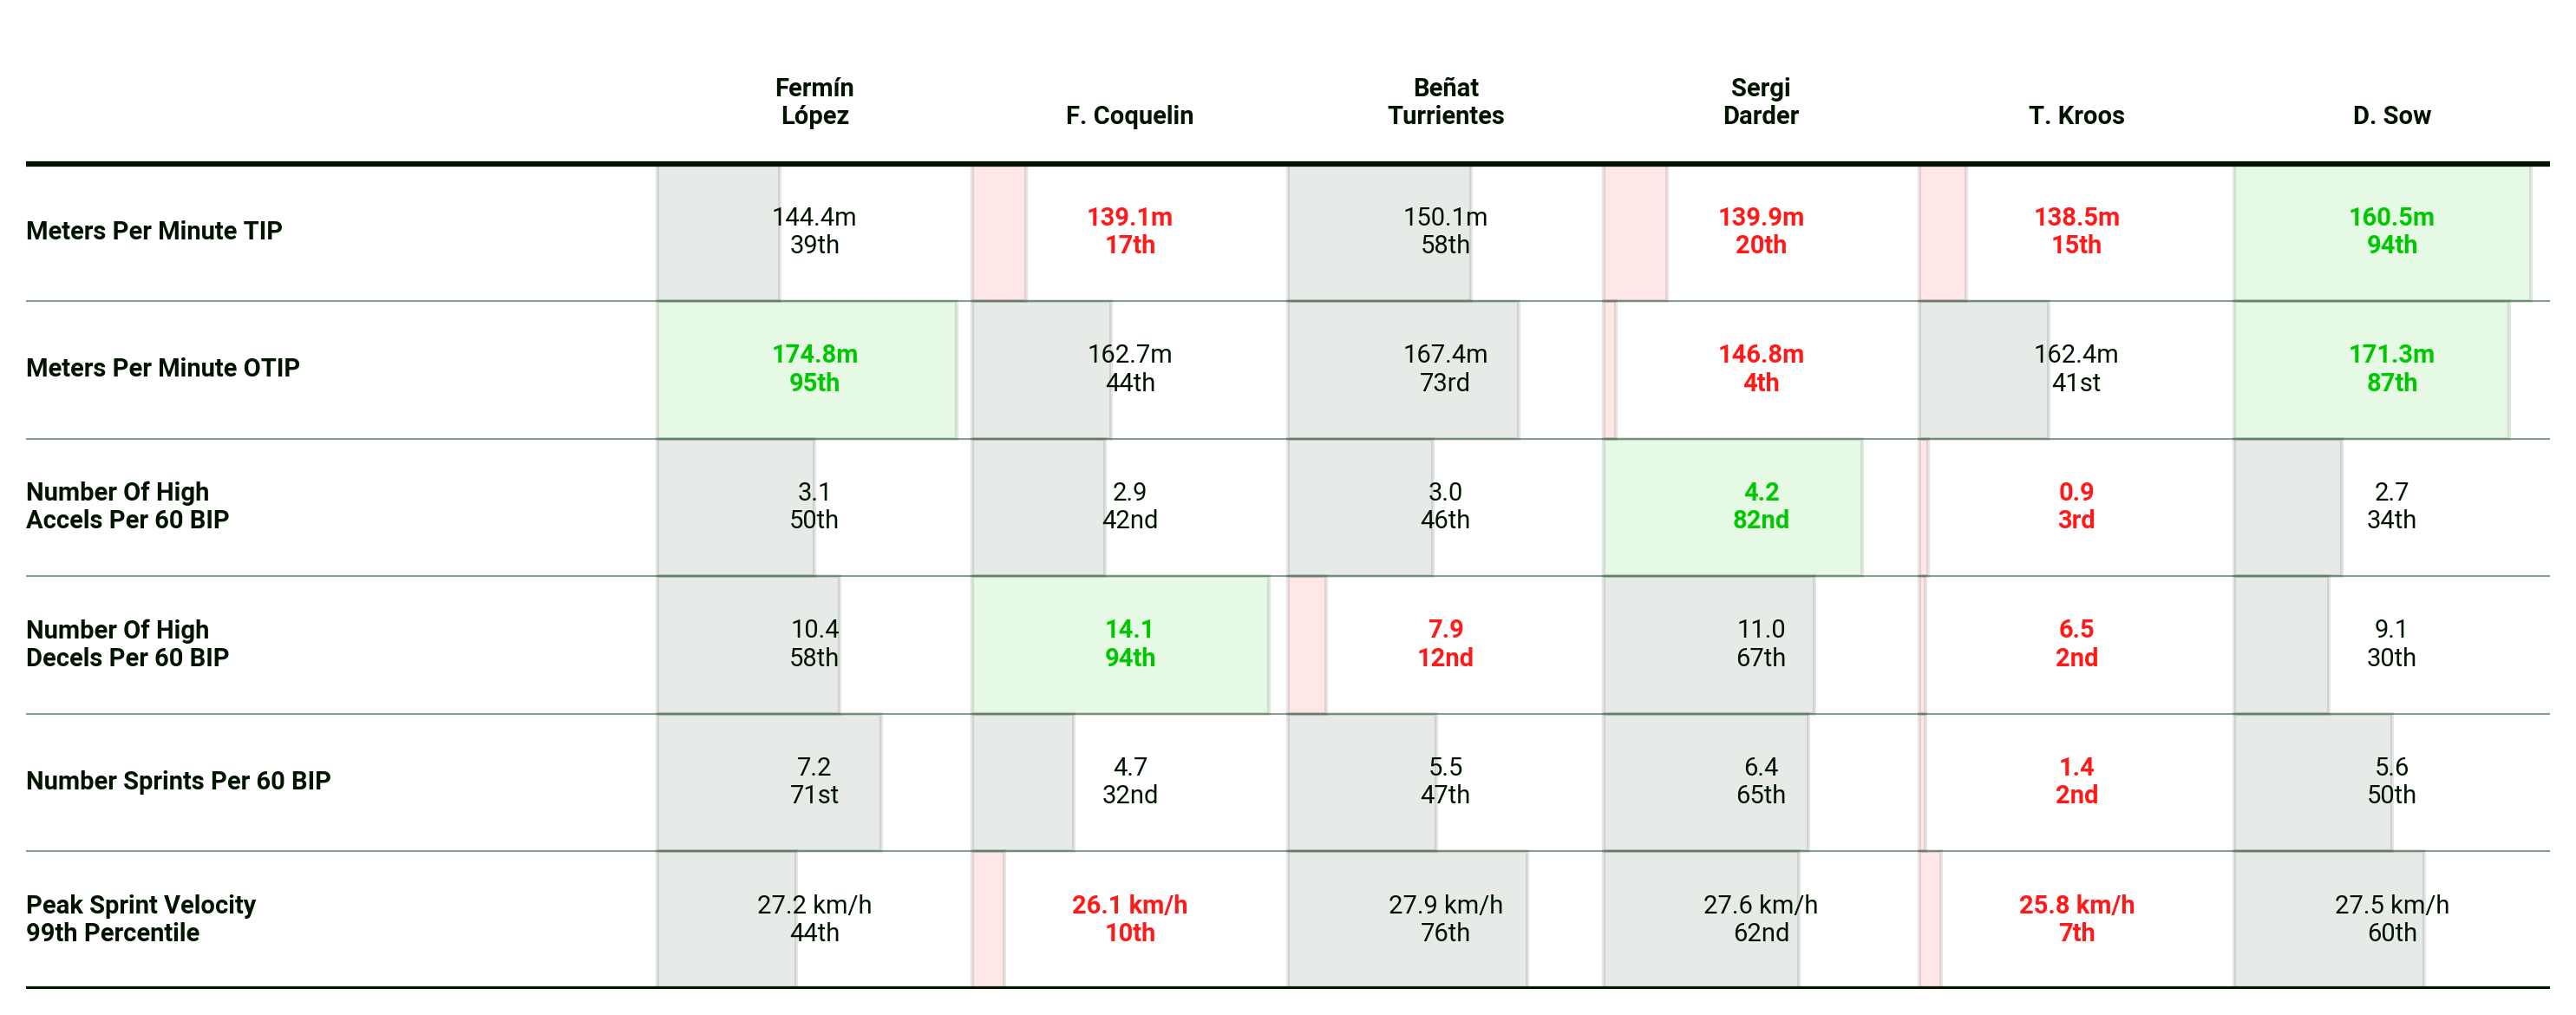
fig, ax = table.plot_summary_table(df=df[df['position_group'] == 'Midfield'],
                                   metrics=list(plot_metrics.keys()),
                                   metric_col_names=plot_metrics.values(),
                                   percentiles_mode=True,
                                   data_point_id='player_name',
                                   data_point_label='player_short_name',
                                   highlight_group=[
                                            'Fermín López Marín',
                                            'Francis Coquelin',
                                            'Beñat Turrientes Imaz',
                                            'Sergi Darder Moll',
                                            'Toni Kroos',
                                            'Djibril Sow'])
Summary Table Figure
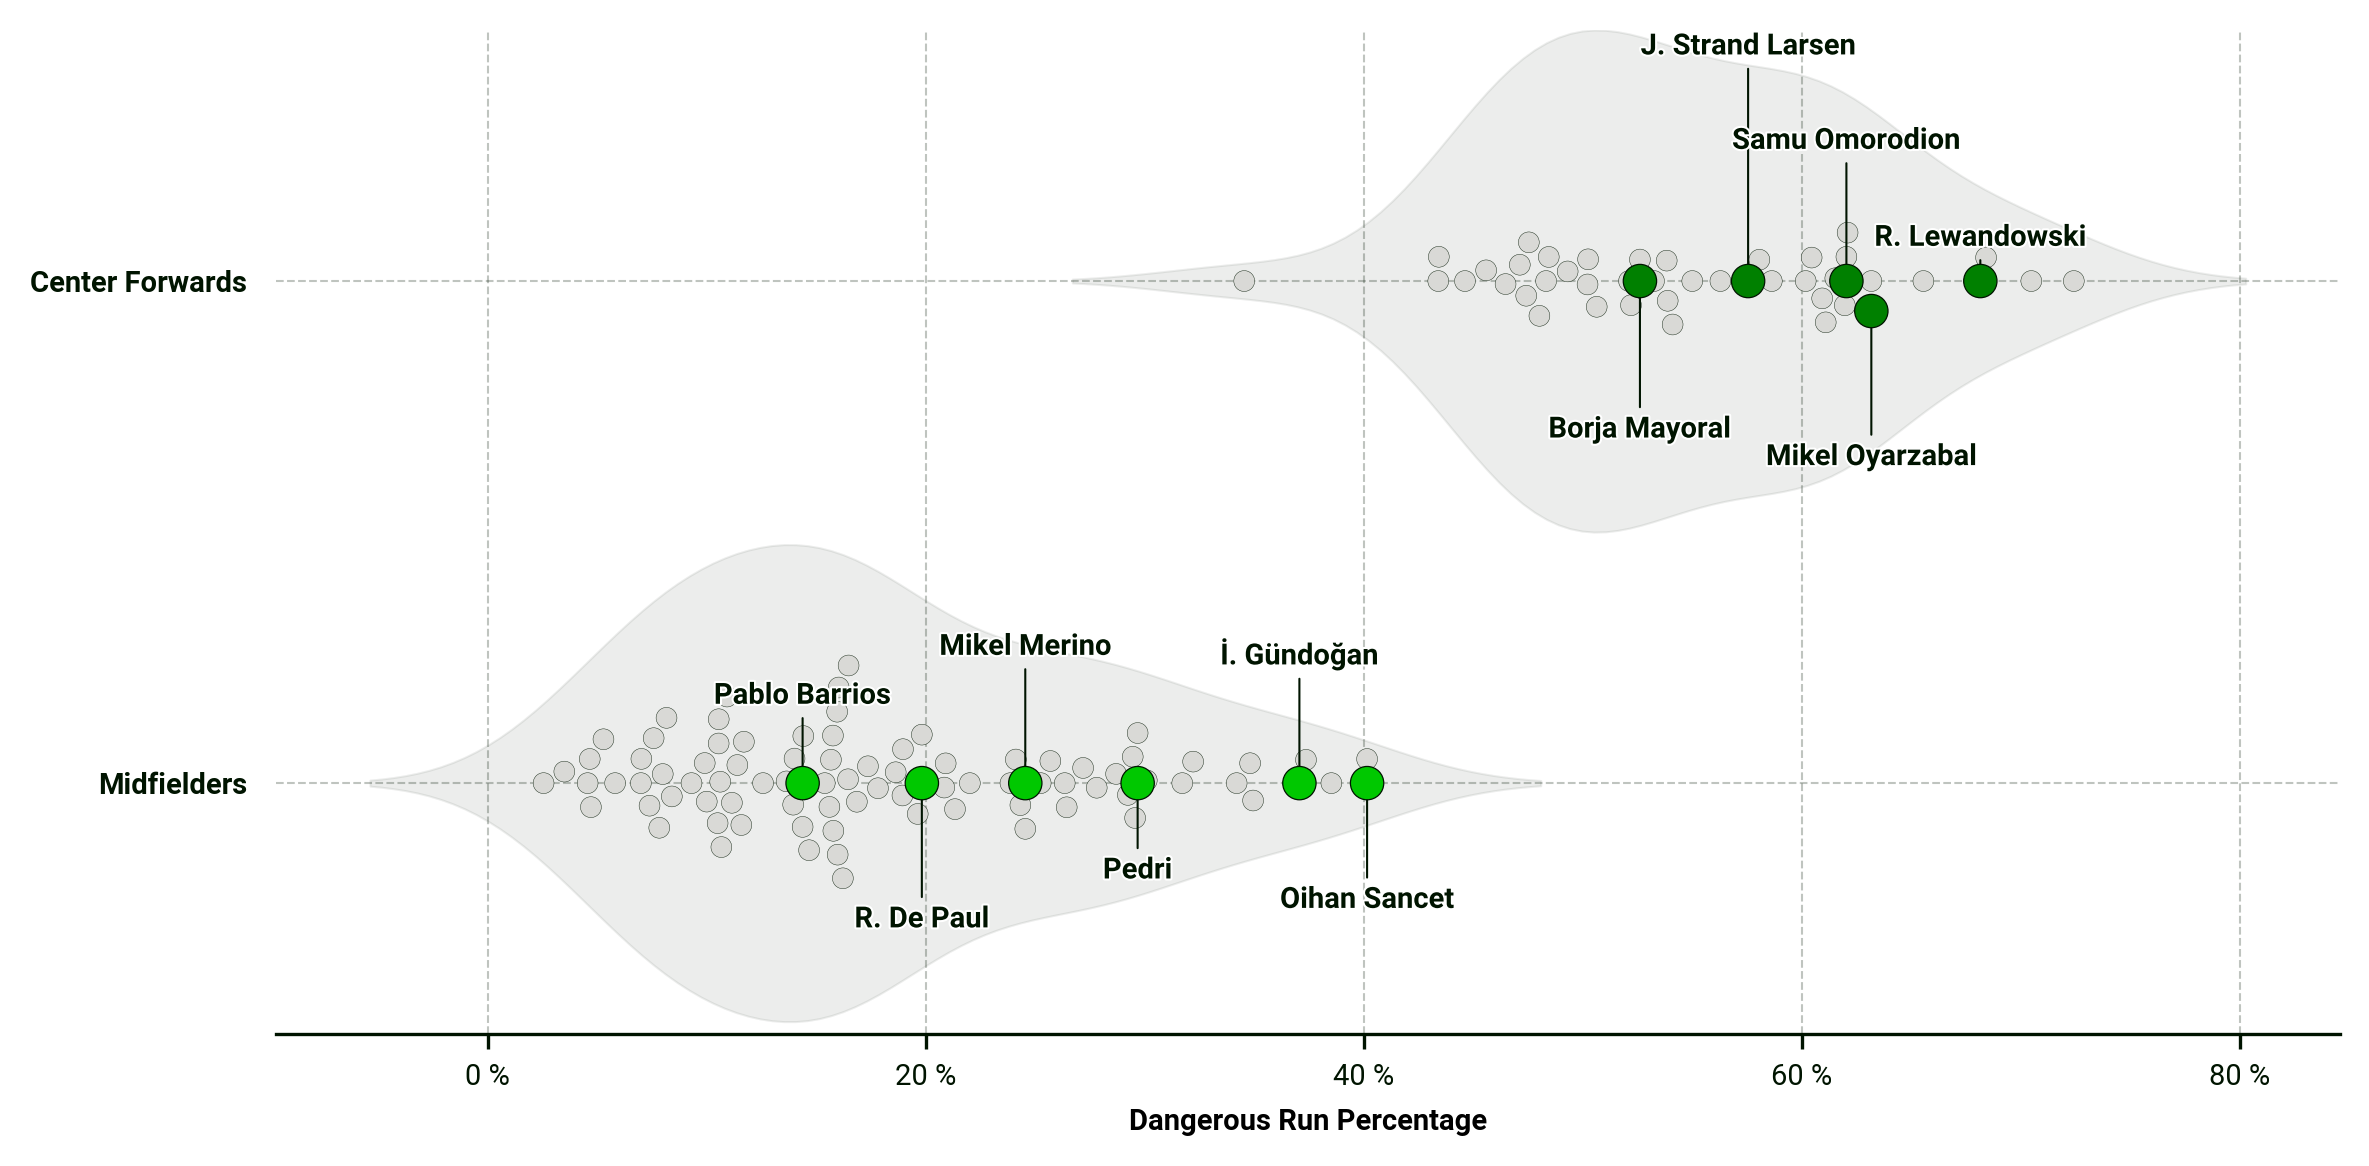
Swarm/Violin Plot
Code Snippet
from skillcornerviz.standard_plots import swarm_violin_plot as swarm_plot
from skillcornerviz.utils import skillcorner_game_intelligence_utils as gi_utils
from skillcorner.client import SkillcornerClient
import pandas as pd

client = SkillcornerClient(username='YOUR_USERNAME', password='YOUR_PASSWORD')

data = client.get_in_possession_off_ball_runs(params={'season': 28,
                                                      'competition': 4,
                                                      'group_by': 'player,team,competition,season,group',
                                                      'playing_time__gte': 60,
                                                      'count_match__gte': 8})
df = pd.DataFrame(data)
metrics = gi_utils.add_run_normalisations(df)

midfielders = [4450, 9188, 25738, 118870, 24120, 13908]
forwards = [733366, 9106, 7619, 16381, 1401]

fig, ax = swarm_plot.plot_swarm_violin(df=df,
                                x_metric='runs_dangerous_percentage',
                                y_metric='group',
                                y_groups=['Center Forward', 'Midfield'],
                                x_label='Dangerous Run Percentage',
                                y_group_labels=['Center Forwards',
                                                'Midfielders'],
                                x_unit='%',
                                primary_highlight_group=midfielders,
                                secondary_highlight_group=forwards,
                                data_point_id='player_id',
                                data_point_label='short_name',
                                point_size=7)
Swarm Violin Plot Figure
Narrative Ranking Plot
Code Snippet
from skillcornerviz.standard_plots import narrative_ranking_plot as rank
from skillcorner.client import SkillcornerClient
import pandas as pd

client = SkillcornerClient(username='YOUR_USERNAME', password='YOUR_PASSWORD')

data = client.get_in_possession_off_ball_runs(params={'competition': 4,
                                                      'season': 28,
                                                      'group_by': 'player,team,competition,season,group',
                                                      'playing_time__gte': 60,
                                                      'count_match__gte': 8,
                                                      'average_per': '30_min_tip',
                                                      'run_type': 'all,run_in_behind,run_ahead_of_the_ball,'
                                                                 'support_run,pulling_wide_run,coming_short_run,'
                                                                 'underlap_run,overlap_run,dropping_off_run,'
                                                                 'pulling_half_space_run,cross_receiver_run'})
df = pd.DataFrame(data)

QUESTIONS = {
    'HOW DIRECT IS THE PLAYER ?': [
        'count_runs_in_behind_per_30_min_tip',
        'count_runs_ahead_of_the_ball_per_30_min_tip',
        'count_cross_receiver_runs_per_30_min_tip',
    ],
    'DOES THE PLAYER HELP BUILD UP?': [
        'count_dropping_off_runs_per_30_min_tip',
        'count_pulling_wide_runs_per_30_min_tip',
        'count_pulling_half_space_runs_per_30_min_tip',
    ]
}

fig, ax = rank.plot_ranking(
    df=df[df['group'] == 'Wide Attacker'],
    questions=QUESTIONS,
    highlight_group=[35342, 9106, 7619, 13975, 246, 11550, 6140, 640, 9338],
    data_point_id='player_id',
    data_point_label='short_name',
    plot_title='Off-Ball Run Rankings | Wide Attackers LaLiga 2023/24',
)

fig.savefig('ranking_example.png', format='png', dpi=300)
Narrative Ranking Plot Figure
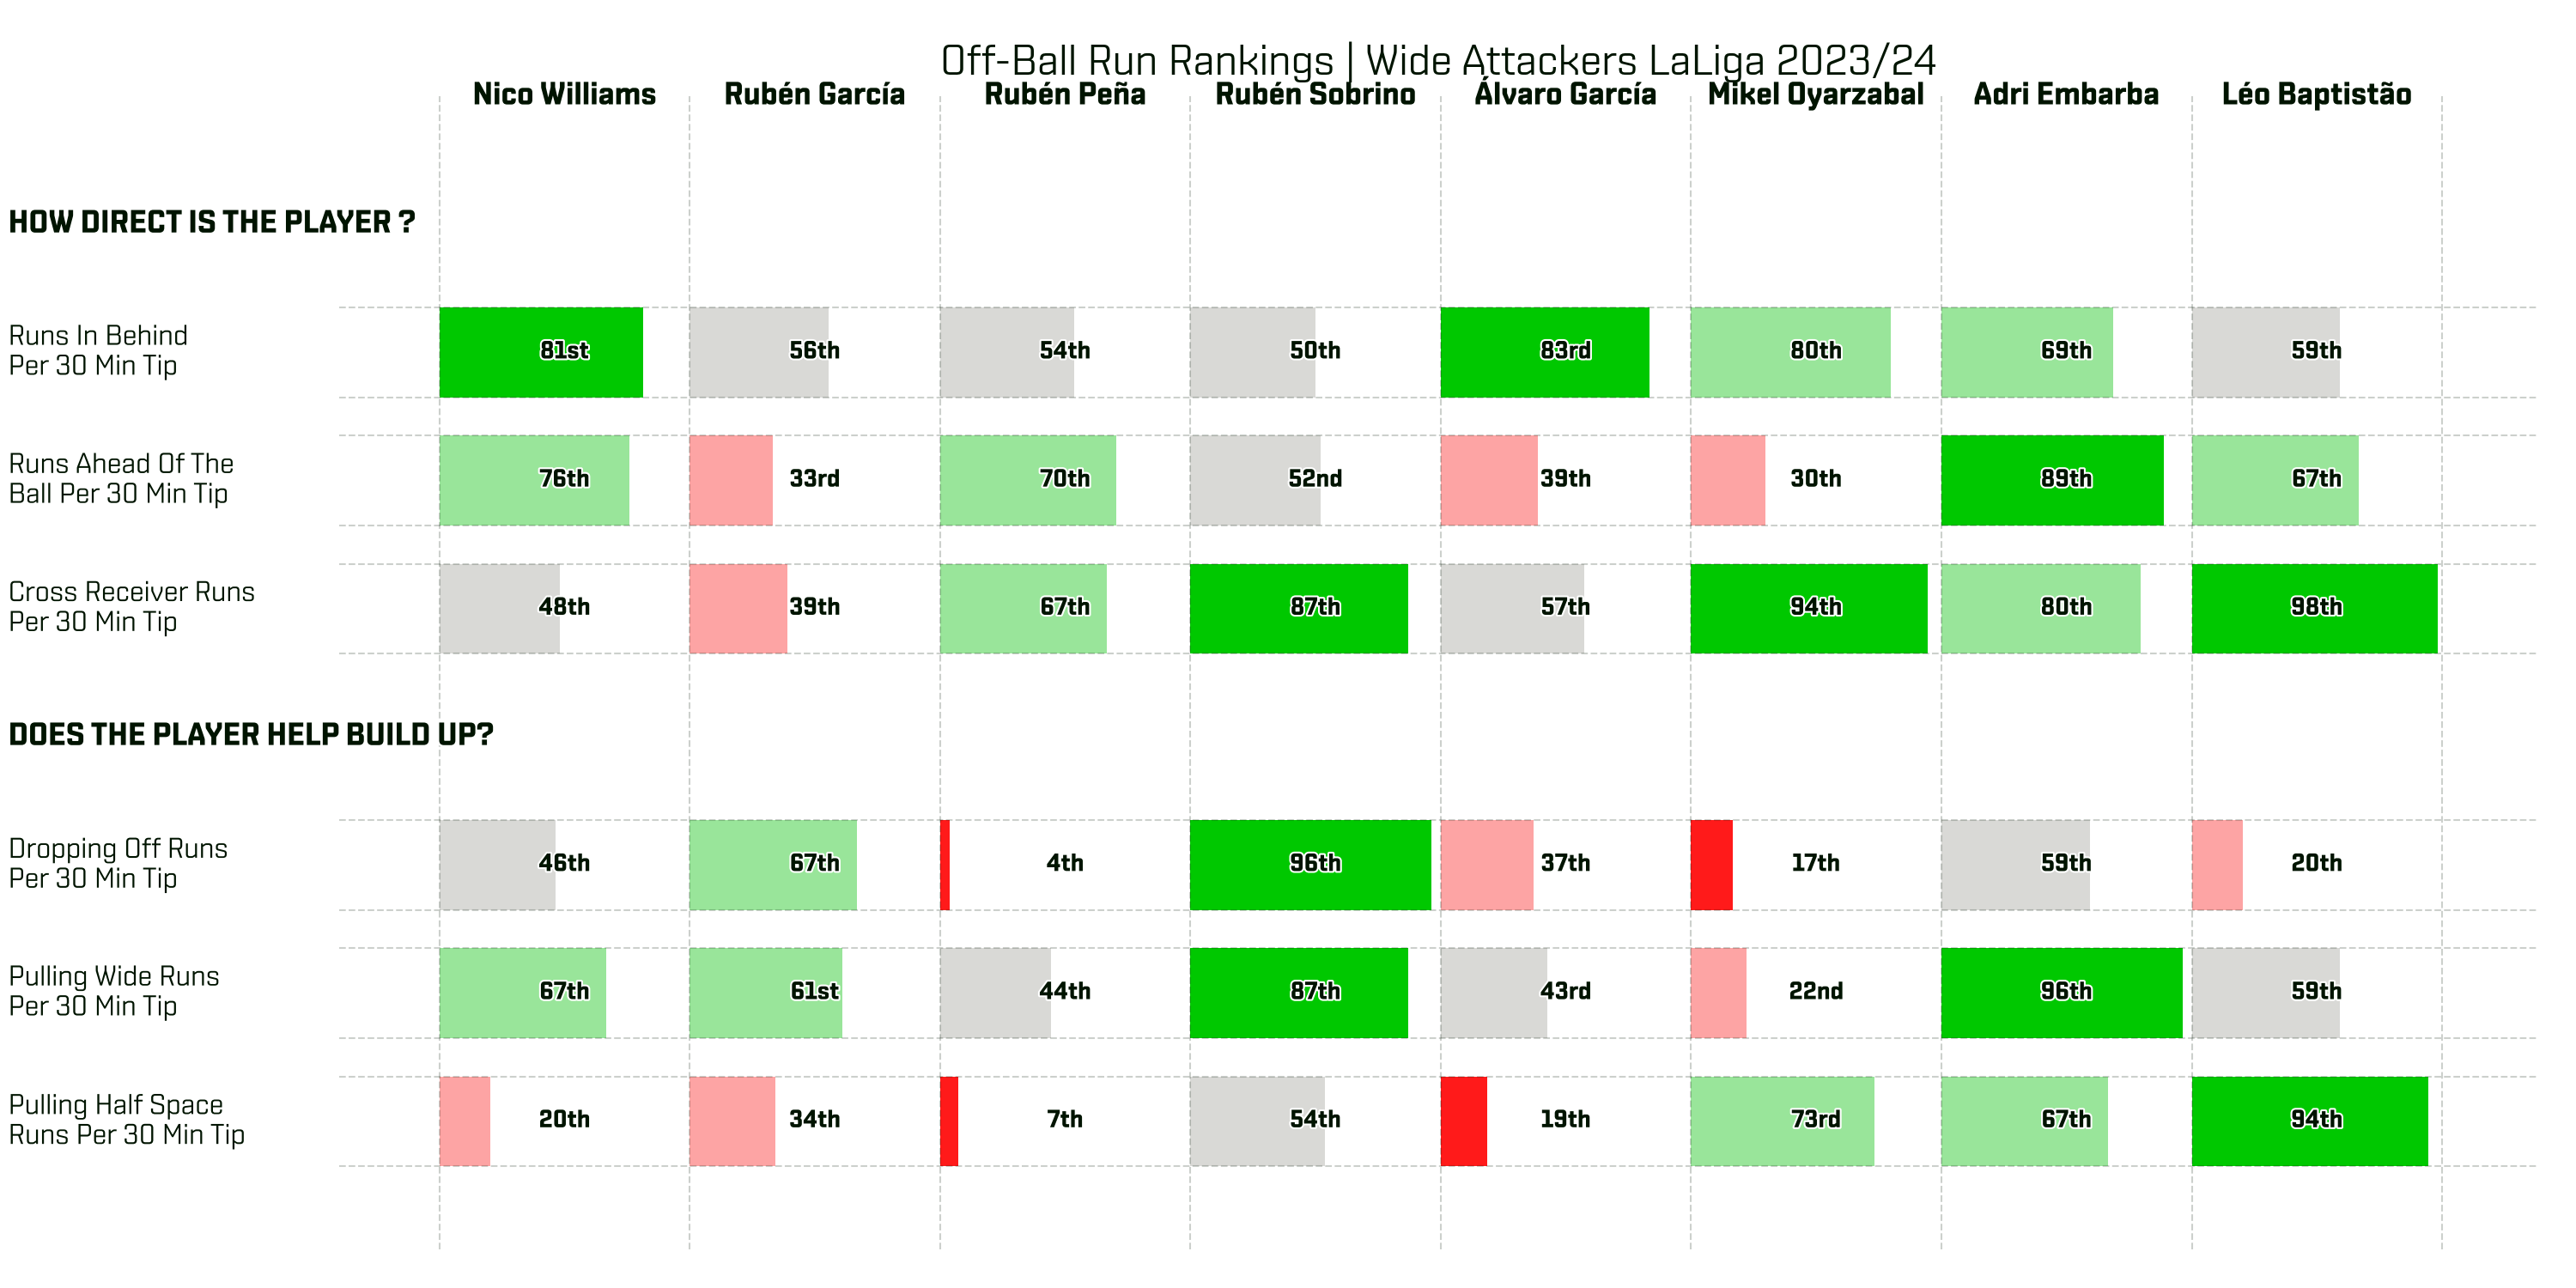
Table Grid
Code Snippet
from skillcornerviz.standard_plots import table_grid as tgrid
from skillcornerviz.utils import skillcorner_physical_utils as p_utils
from skillcornerviz.utils import skillcorner_utils as skcu
from skillcorner.client import SkillcornerClient
import pandas as pd
from scipy import stats

client = SkillcornerClient(username='YOUR_USERNAME', password='YOUR_PASSWORD')

data = client.get_in_possession_off_ball_runs(params={'competition': 4,
                                                      'season': 28,
                                                      'group_by': 'player,team,competition,season,group',
                                                      'playing_time__gte': 60,
                                                      'count_match__gte': 8,
                                                      'average_per': '30_min_tip',
                                                      'run_type': 'all,run_in_behind,run_ahead_of_the_ball,'
                                                                 'support_run,pulling_wide_run,coming_short_run,'
                                                                 'underlap_run,overlap_run,dropping_off_run,'
                                                                 'pulling_half_space_run,cross_receiver_run'})
df = pd.DataFrame(data)

METRICS = ['count_runs_in_behind_per_30_min_tip',
           'count_runs_ahead_of_the_ball_per_30_min_tip',
           'count_cross_receiver_runs_per_30_min_tip',
           'count_dropping_off_runs_per_30_min_tip',
           'count_pulling_wide_runs_per_30_min_tip',
           'count_pulling_half_space_runs_per_30_min_tip']
LABELS  = ['IN BEHIND', 'AHEAD', 'CROSS RECEIVER', 'DROPPING OFF', 'WIDE RUN', 'HALF SPACE RUN']

viz = df[df['group'] == 'Midfield'].copy()
for m in METRICS:
    viz[f'{m}_z'] = stats.zscore(viz[m])

fig, ax = tgrid.plot_table_grid(
    df=viz,
    metrics=[f'{m}_z' for m in METRICS],
    labels=LABELS,
    data_point_id='short_name',
    # highlight_group=['J. Bellingham', 'O. Sancet'],
    gap_positions=[3],
    sort_by='count_runs_in_behind_per_30_min_tip_z',
    plot_title='OBR Profile | Midfielders LaLiga 2023/24',
)
fig.savefig('table_grid_example.png', format='png', dpi=300)
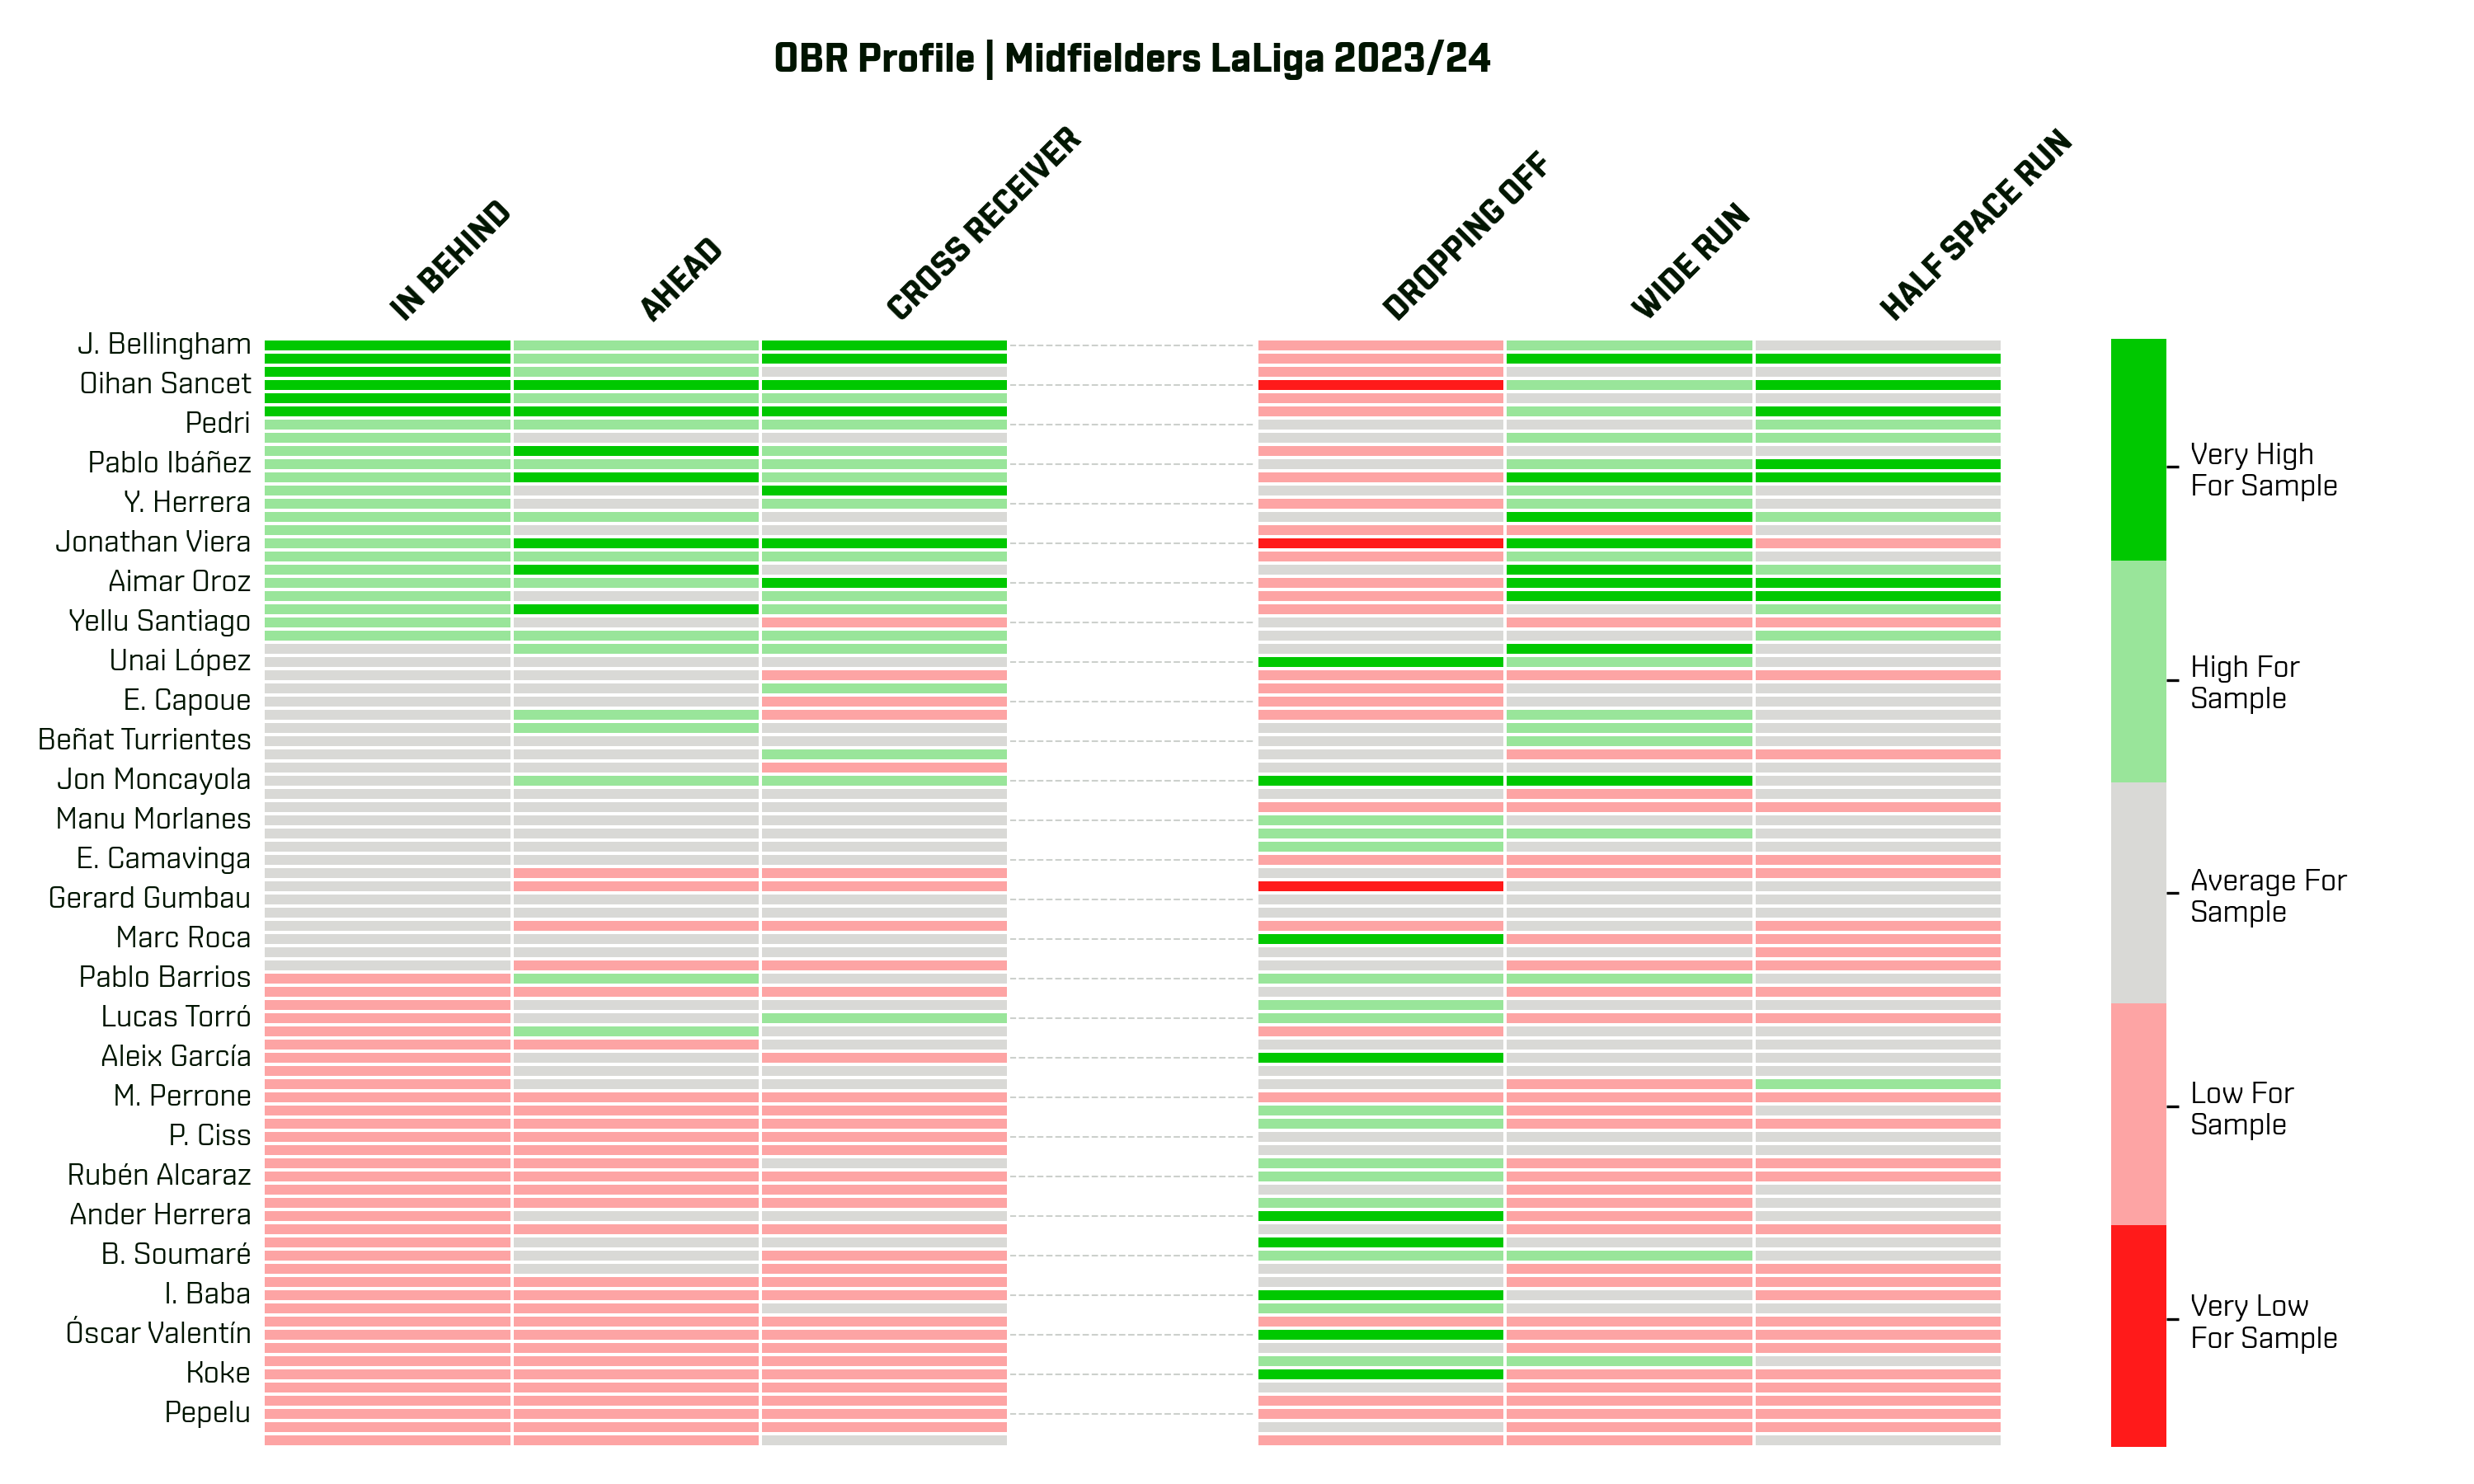
Table Grid Figure
Contact
If you encounter any issues, have suggestions, or would like to know more about the SkillCornerviz Library, please contact us at through this email: contact@skillcorner.com


Download files
Download the file for your platform. If you're not sure which to choose, learn more about installing packages.
Source Distribution
Built Distribution
Filter files by name, interpreter, ABI, and platform.
If you're not sure about the file name format, learn more about wheel file names.
Copy a direct link to the current filters
File details
Details for the file skillcornerviz-1.2.2.tar.gz.
File metadata
- Download URL: skillcornerviz-1.2.2.tar.gz
- Upload date:
- Size: 1.6 MB
- Tags: Source
- Uploaded using Trusted Publishing? No
- Uploaded via: twine/6.2.0 CPython/3.11.15
File hashes
| Algorithm | Hash digest | |
|---|---|---|
| SHA256 |
0484335b9622a15f39a83a68be5103c7aea57dd67e624682d65e69e4567d9227
|
|
| MD5 |
d3be48db0d234b4f9dfb3c8e8b97ed51
|
|
| BLAKE2b-256 |
c68f7fb86db1c439b05dfc4c8fd728d367eb27aadc3c80456cbe809aada014fb
|
File details
Details for the file skillcornerviz-1.2.2-py3-none-any.whl.
File metadata
- Download URL: skillcornerviz-1.2.2-py3-none-any.whl
- Upload date:
- Size: 1.6 MB
- Tags: Python 3
- Uploaded using Trusted Publishing? No
- Uploaded via: twine/6.2.0 CPython/3.11.15
File hashes
| Algorithm | Hash digest | |
|---|---|---|
| SHA256 |
ad2b2df478a5f2da82e87ed84237099c871bd4f653751d2a9488d0181b2d78be
|
|
| MD5 |
5f76a92c2f5db600efd53251b0a3819c
|
|
| BLAKE2b-256 |
0e98ec05c544f122dbe887d1e066311e40e96d8e553afc366aa4ed97675e573d
|






