A simple planar self organizing map

Project description
sklearn-som
A simple, planar self-organizing map with methods similar to clustering methods in Scikit Learn.
sklearn-som is a minimalist, simple implementation of a Kohonen self organizing map with a planar (rectangular) topology. It is used for clustering data and performing dimensionality reduction. For a brief, all-around introduction to self organizing maps, check out this helpful article from Rubik's Code.
Why another SOM package?
There are already a handful of useful SOM packages available in your machine learning framework of choice. So why make another one? Well, sklearn-som, as the name suggests, is written to interface just like a clustering method you would find in Scikit Learn. It has the advantage of only having one dependency (numpy) and if you are already familiar with Scikit Learn's machine learning API, you will find it easy to get right up to speed with sklearn-som.
How to use
Using sklearn-som couldn't be easier. First, import the SOM class from the sklearn_som.som module:
from sklearn_som.som import SOM
Now you will have to create an instance of SOM to cluster data, but first let's get some data. For this part we will use sklearn's Iris Dataset, but you do not need sklearn to use SOM. If you have data from another source, you will not need it. But we are going to use it, so let's grab it. We will also use only the first two features so our results are easier to visualize:
from sklearn import datasets

iris = datasets.load_iris()
iris_data = iris.data[:, :2]
iris_label = iris.target
Now, just like with any classifier right from sklearn, we will have to build an SOM instance and call .fit() on our data to fit the SOM. We already know that there are 3 classes in the Iris Dataset, so we will use a 3 by 1 structure for our self organizing map, but in practice you may have to try different structures to find what works best for your data. Let's build and fit the som:
iris_som = SOM(m=3, n=1, dim=2)
iris_som.fit(iris_data)
Note that when building the instance of SOM, we specify m and n to get an m by n matrix of neurons in the self organizing map.
Now also like in sklearn, let's assign each datapoint to a predicted cluster using the .predict() method:
predictions = iris_som.predict(iris_data)
And let's take a look at how we did:
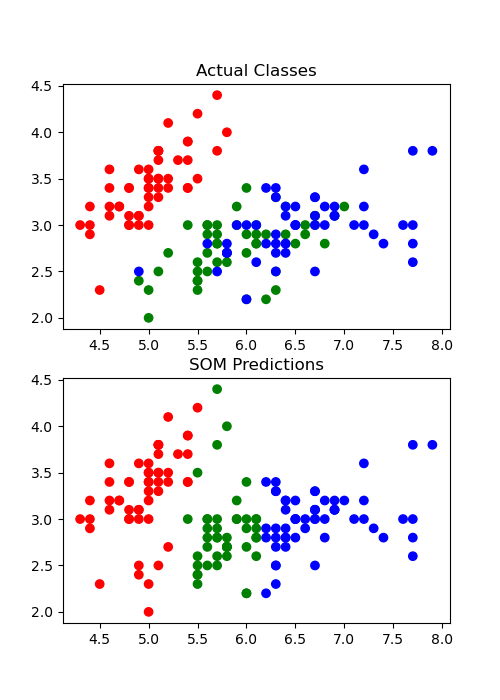
Not bad! For the full example code, including the code to reproduce that plot, see example/example.py at https://github.com/rileypsmith/sklearn-som.
Documentation
For full documentation, visit the project page on ReadTheDocs.
Contributing
If you would like to contribute to sklearn-som, feel free to drop me a line or just submit a pull request and I'll take a look. Ideas for future expansion include adding the ability to make higher dimensional self-organizing maps and to use a hexagonal grid rather than a rectangular one. I may get to those expansions at some point.
Also, if you find a bug, please open an issue on GitHub!!
Release history Release notifications | RSS feed


Download files
Download the file for your platform. If you're not sure which to choose, learn more about installing packages.
Source Distribution
Built Distribution
Filter files by name, interpreter, ABI, and platform.
If you're not sure about the file name format, learn more about wheel file names.
Copy a direct link to the current filters
File details
Details for the file sklearn-som-1.1.0.tar.gz.
File metadata
- Download URL: sklearn-som-1.1.0.tar.gz
- Upload date:
- Size: 6.1 kB
- Tags: Source
- Uploaded using Trusted Publishing? No
- Uploaded via: twine/3.3.0 pkginfo/1.7.0 requests/2.25.1 setuptools/52.0.0.post20210125 requests-toolbelt/0.9.1 tqdm/4.56.0 CPython/3.8.5
File hashes
| Algorithm | Hash digest | |
|---|---|---|
| SHA256 |
9b8107f42dfbd68db0d1aa75dd2007be4e0136bf0af96da51513e295f76646d9
|
|
| MD5 |
6061fe59001409c0bcc5770ac014dbbc
|
|
| BLAKE2b-256 |
105b88575b1a000232507b3ca6d187167d57ffb56e6bb8bec012e9d3bd4568f6
|
File details
Details for the file sklearn_som-1.1.0-py3-none-any.whl.
File metadata
- Download URL: sklearn_som-1.1.0-py3-none-any.whl
- Upload date:
- Size: 6.7 kB
- Tags: Python 3
- Uploaded using Trusted Publishing? No
- Uploaded via: twine/3.3.0 pkginfo/1.7.0 requests/2.25.1 setuptools/52.0.0.post20210125 requests-toolbelt/0.9.1 tqdm/4.56.0 CPython/3.8.5
File hashes
| Algorithm | Hash digest | |
|---|---|---|
| SHA256 |
92b774da67fe5fb73cf0697e93bda63923060c121ae0383c4ecce638d1385719
|
|
| MD5 |
8f372098aadb45bbf645085fac5e2abc
|
|
| BLAKE2b-256 |
56ef5f42e874f7ea8e86b70914121e508c72cb7d301d2cb8c6f198534e6ffc24
|


