
Astronomy visualization toolkit: WCS frames, spherical geometry, tilted globes, and cone (z-RA) frames

Project description
skyplothelper
Put astronomical data on the sky — correctly and beautifully — from a single import.
All-sky projections · custom WCS frames · tilted globes & planets · cosmology cone diagrams · HEALPix · spherical-region set algebra · FITS quicklook · rich overlays · an interactive plotly/Dash backend






Documentation · Tutorials · Gallery · API · Quickstart · Citing
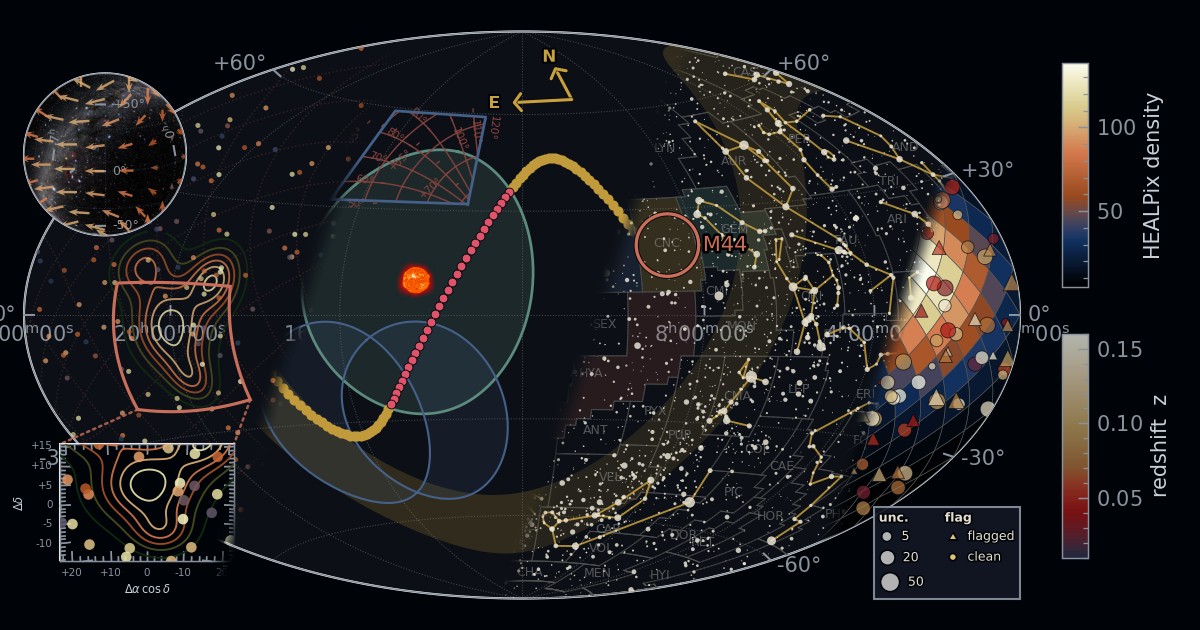
One all-sky frame, several layers at once — a source-density field, bright stars and constellations, and survey footprints over a redshift catalog — spliced from identically-projected panels.
What is it?
skyplothelper is an astronomical data visualization toolkit built on matplotlib and astropy's WCSAxes. It handles the parts of sky plotting that are fiddly to get right — projections and their antimeridian seams, coordinate-system conventions, the astronomical east-left longitude direction, publication-quality ticks — and packs the everyday sky-figure toolkit into one place.
A single import skyplothelper as sph gives you 200+ helpers spanning all-sky maps, tangent-plane
fields, tilted globes, cosmology cones, HEALPix, spherical regions, FITS quicklook, and a full
overlay vocabulary — without juggling a handful of separate libraries. Crucially, it builds on
WCSAxes rather than around it: every frame it returns is a real WCSAxes, so the entire
matplotlib + astropy toolbox keeps working on top of anything skyplothelper draws.
import skyplothelper as sph

# An all-sky map with the ecliptic, IAU constellation boundaries, and a survey footprint
fig, ax = sph.allsky_figure(projection="AIT", center=180)
sph.add_plane_overlay(ax, plane="ecliptic", color="orange")
sph.add_constellation_boundaries(ax)
sph.add_survey_footprint(ax, survey="sdss", label="SDSS")
Highlights
- All-sky & field maps — 32 projections (Aitoff, Mollweide, Plate Carrée, conics, …), tangent-plane fields, and offset (relative) coordinates. → frames guide
- Globes & planets — tilted-Earth orientation with Euler angles, hemisphere-aware plotting, coastlines / tectonic plates, nightshade day/night blending, and planet textures. → globe guide
- FITS images — interval/stretch scaling, one-call quicklook figures, beams, matched colorbars, reprojection, and multi-band RGB composites. → images guide
- Spherical regions — circles, polygons, and bands with correct seam/pole handling, plus
set-algebra (
CompoundRegion) and point-in-region membership queries. → regions guide - HEALPix — bin catalogs into maps, render them in any projection, run spatial queries, and change resolution. → HEALPix guide
- Overlays — constellations, survey footprints, coordinate planes, beams, rulers, reticles, compasses, and scale bars — all seam-aware. → overlays guide
- Cosmology cones — redshift-survey wedge diagrams, double-sided bowties, and a twin radial axis pairing redshift with comoving distance. → cone guide
- Coordinates & ticks — RA/Dec conventions, sexagesimal / decimal / offset / VLBI tick styles, and second coordinate grids drawn over a frame. → ticks guide
- Vector fields — proper motions, displacement fields, vector spherical harmonics, and station co-visibility regions. → vectors guide
- Catalog queries — thin SIMBAD / NED / VizieR / SkyView wrappers whose results drop straight onto a frame. → queries guide
- Interactive backend —
skyplothelper.plotlymirrors the same API on interactive plotly figures (pan, zoom, hover, single-file HTML export) with a Dash FITS viewer. → plotly guide - Publication styling — composable base / theme / palette / font layers, color-vision-safe palettes, and a set of astronomy image colormaps. → styling guide
Gallery
From all-sky maps to tilted globes, planets, redshift cones, HEALPix maps, and set-algebra regions — a sampler of what fits on one canvas:
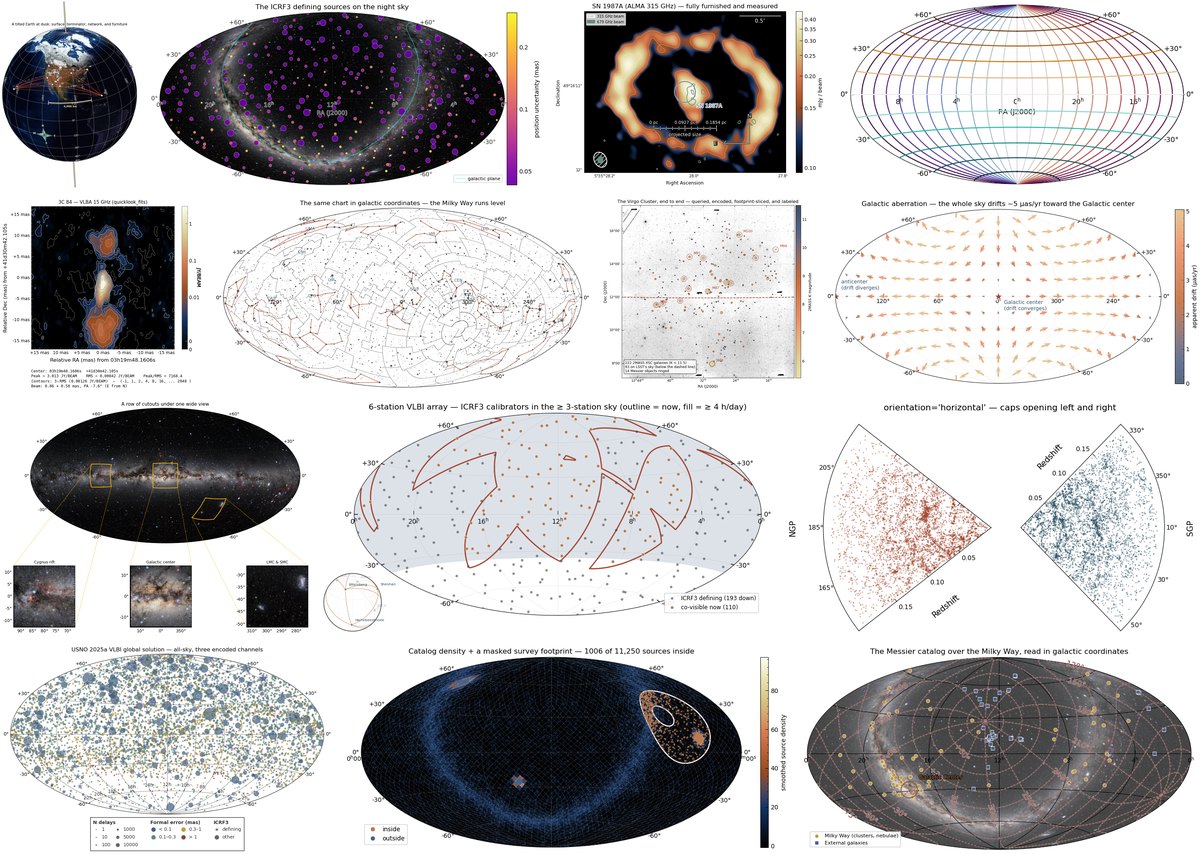
Deeper walkthroughs of these figures are in the tutorials; a code-per-figure index is in the feature gallery.
In motion
The same frames animate — spin a planet through Euler-angle sequences, sweep the nightshade terminator across a date range, trace stellar orbits around the Galactic-center black hole, plan a VLBI session, step through a spectral cube, or watch a constellation deform under proper motion over millennia.






Animated WebP built with matplotlib animation on ordinary skyplothelper frames — see the animations tutorial.
Why skyplothelper?
Plenty of good tools already put data on the sky — each excellent within its lane:
- APLpy makes beautiful figures of FITS images, and does that one
job very well — but it's focused on single-image display (images, contours, RGB, beams), is in
maintenance mode, and works through its own
FITSFigureobject rather than a general axes you keep extending. - The Kapteyn Package is a powerful, mature mapping toolkit, but it's a self-contained framework with its own WCS and plotting classes — a parallel ecosystem to astropy rather than a thin layer on top of it.
- pywcsgrid2 pioneered WCS-aware matplotlib axes and inspired a generation of sky plots, but it's Python-2-only and unmaintained.
- Beyond these, most tools are deliberately narrow —
healpy.mollviewfor HEALPix,cartopyfor the Earth, planetarium/ephemeris libraries likeskyfieldandstarplotfor star charts. Each is great at its specialty.
skyplothelper takes a different tack. It builds on astropy's WCSAxes rather than around it, so
every frame is a native WCSAxes you can keep customizing with the full matplotlib + astropy
toolbox — no framework lock-in. And it's broad rather than single-purpose: all-sky maps, fields,
globes, cones, HEALPix, regions, images, overlays, queries, vector fields, and an interactive
backend all live behind one import and share one set of conventions. It gets the tedious details
right (antimeridian seams, projection clipping, RA/east-left orientation, publication ticks), and
it's modern and maintained — Python 3.10+, fully type-annotated (mypy-strict), and covered by
1600+ tests.
Where it came from. skyplothelper didn't start as a package. It's the consolidation of nearly a decade of research-plotting code — the scripts and helpers written to get one more figure right for one more paper — cleaned up, unified, tested, and documented into a single coherent toolkit so you don't have to rebuild the same scaffolding for every project.
Installation
pip install skyplothelper                 # core: numpy, matplotlib, astropy>=6.0, shapely, healpy

# HEALPix binning/plotting and spherical regions / CompoundRegion are core —
# no extra needed (healpy has no Windows wheel, so those features raise an
# informative error there; everything else works cross-platform).

# Optional features (mix as needed; each fails gracefully with a helpful message if absent):
pip install "skyplothelper[plotly]"       # interactive backend  (add [dash] for the FITS viewer app)
pip install "skyplothelper[query]"        # SIMBAD / NED / VizieR / SkyView (astroquery)
pip install "skyplothelper[reproject]"    # image reprojection (reproject)
pip install "skyplothelper[cartopy]"      # cartopy backend + Earth features
pip install "skyplothelper[cone]"         # cosmology conversions for cone plots (scipy)
pip install "skyplothelper[all]"          # everything optional
Requires Python 3.10+ and astropy 6.0+. Optional features are gated behind their extras and
raise an informative ImportError (naming the extra to install) if their dependency is missing —
nothing else stops working.
Quickstart
import skyplothelper as sph
import matplotlib.pyplot as plt

# A tilted celestial globe with a see-through graticule and a compass rose
fig = plt.figure()
ax = sph.make_globe_frame(111, center_LONdeg=0, center_LATdeg=23.44, grid=False)
sph.plot_ortho_grid(ax)
sph.add_compass_rose(ax)

# A cosmology cone (redshift wedge)
fig = plt.figure()
ax = sph.make_cone_frame(111, angle_center=180, angle_half_width=30,
                         r_min=0, r_max=0.15, angle_label="R.A.", fig=fig)
sph.cone_scatter(ax, galaxy_ras, galaxy_redshifts, s=3)

# A HEALPix all-sky map (returns fig, ax, mappable, colorbar)
result = sph.healpix_allsky_figure(my_hpx_map, projection="AIT")
result.colorbar.set_label("value")

# The same map, interactively (pan / zoom / hover / HTML export)
import skyplothelper.plotly as sphpl
sfig = sphpl.make_figure(projection="AIT", center=180)
sphpl.add_healpix(sfig, my_hpx_map)
sfig.write_html("skymap.html")
More recipes are in the quickstart, and every subsystem has a narrative user guide page plus a worked tutorial notebook.
Documentation
Full documentation is on Read the Docs:
- User guide — each subsystem explained, with worked examples and the gotchas.
- Tutorials — runnable end-to-end notebooks, from your first frame to interactive maps.
- Feature Gallery — a visual index with starter code for each kind of figure.
- API reference — every public function and class, grouped by subsystem.
For AI agents / LLMs
skyplothelper is frame-first: create a sky frame, then draw data and decorations onto its axes. In a session, start with:
import skyplothelper as sph
sph.overview()            # scope + frame-first model + coordinate conventions
sph.recipes('cube')       # copy-paste recipes for a task (also 'catalog',
                          # 'stroke', 'grid', 'colorbar', ...)
For ingestion, llms.txt is a concise, link-rich map and
llms-full.txt inlines the full runnable recipe corpus
(both generated from the same in-package catalog, so they never drift).
Citing
If skyplothelper is useful in your work, please cite it — and a mention in your acknowledgements is
genuinely appreciated. For now, cite the software via its repository and the included
CITATION.cff:
@software{skyplothelper,
  author  = {Cigan, Phil},
  title   = {{skyplothelper}: astronomy visualization for matplotlib and astropy WCSAxes},
  year    = {2026},
  version = {1.0.2},
  url     = {https://github.com/pjcigan/skyplothelper}
}
A journal/arXiv article describing skyplothelper and a citeable ASCL entry are planned to accompany the first release, and a Zenodo DOI will be minted — this section and the badges above will be updated with the preferred reference once they are available.
Contributing
Bug reports, feature requests, and pull requests are welcome — with the honest caveat that
skyplothelper is maintained by a single developer with limited time, so reviews and fixes happen as
time allows and may take a while. For anything non-trivial, please open an issue to discuss before
writing code. Usage questions ("how do I do X?") belong in
Discussions — and are usually answered
fastest by the docs or by sph.recipes('<keyword>') in your
own session — so issues stay reserved for bugs and feature ideas. See
CONTRIBUTING.md for development setup, guidelines, and what to expect, and
please be kind and constructive in all project spaces.
License
BSD-3-Clause. See LICENSE.


Download files
Download the file for your platform. If you're not sure which to choose, learn more about installing packages.
Source Distribution
Built Distribution
Filter files by name, interpreter, ABI, and platform.
If you're not sure about the file name format, learn more about wheel file names.
Copy a direct link to the current filters
File details
Details for the file skyplothelper-1.0.2.tar.gz.
File metadata
- Download URL: skyplothelper-1.0.2.tar.gz
- Upload date:
- Size: 1.3 MB
- Tags: Source
- Uploaded using Trusted Publishing? No
- Uploaded via: twine/6.1.0 CPython/3.10.9
File hashes
| Algorithm | Hash digest | |
|---|---|---|
| SHA256 |
a6ada43cc1d5a1835941ca53dee04927054a028864007027235656771ed442ee
|
|
| MD5 |
6c9e3aabc12e2052a5fca0cd813abaf7
|
|
| BLAKE2b-256 |
98f3d8a525c74a212b3fc8f95faad96cdc9669d5474f9ee3053c8be3c43ae596
|
File details
Details for the file skyplothelper-1.0.2-py3-none-any.whl.
File metadata
- Download URL: skyplothelper-1.0.2-py3-none-any.whl
- Upload date:
- Size: 902.4 kB
- Tags: Python 3
- Uploaded using Trusted Publishing? No
- Uploaded via: twine/6.1.0 CPython/3.10.9
File hashes
| Algorithm | Hash digest | |
|---|---|---|
| SHA256 |
3b7c9cbaca7000a76c216fbaad0e4db8a764a3d51bc05fc5918f2c5edefc85f1
|
|
| MD5 |
68539530b633b1afcb7885512348082d
|
|
| BLAKE2b-256 |
4557879d497adbb79b657b51242e9ce3e319643fbd0f592d22a251965a29dda2
|






