simple no linear regression quality (Exponential)

Project description
Simple No Linear Regression:
An analysis of the quality of the regression is carried out.
First, simple linear regression assumptions are implemented. The assumption of outliers is made by eliminating samples whose absolute value of standardized and studentized residuals is greater than 3. The assumption of normality is carried out with the Shapiro-Wilk statistical test. The Breusch-Pagan statistical test is used for homoscedasticity. The Durbin-Watson test is used for the assumption of independence and the F test for linearity.
Regarding the quality of the simple linear regression, the dynamic range is calculated as the difference of the highest and lowest value of the response variable y. The sensitivity is obtained from ordinary least squares (OLS). The resolution is known through the statistical method of ANOVA to determine if there is a significant difference between the two consecutive values of the variable to be predicted with the smallest difference. Cross validation with k=10 and rmse as a metric is used to calculate accuracy.
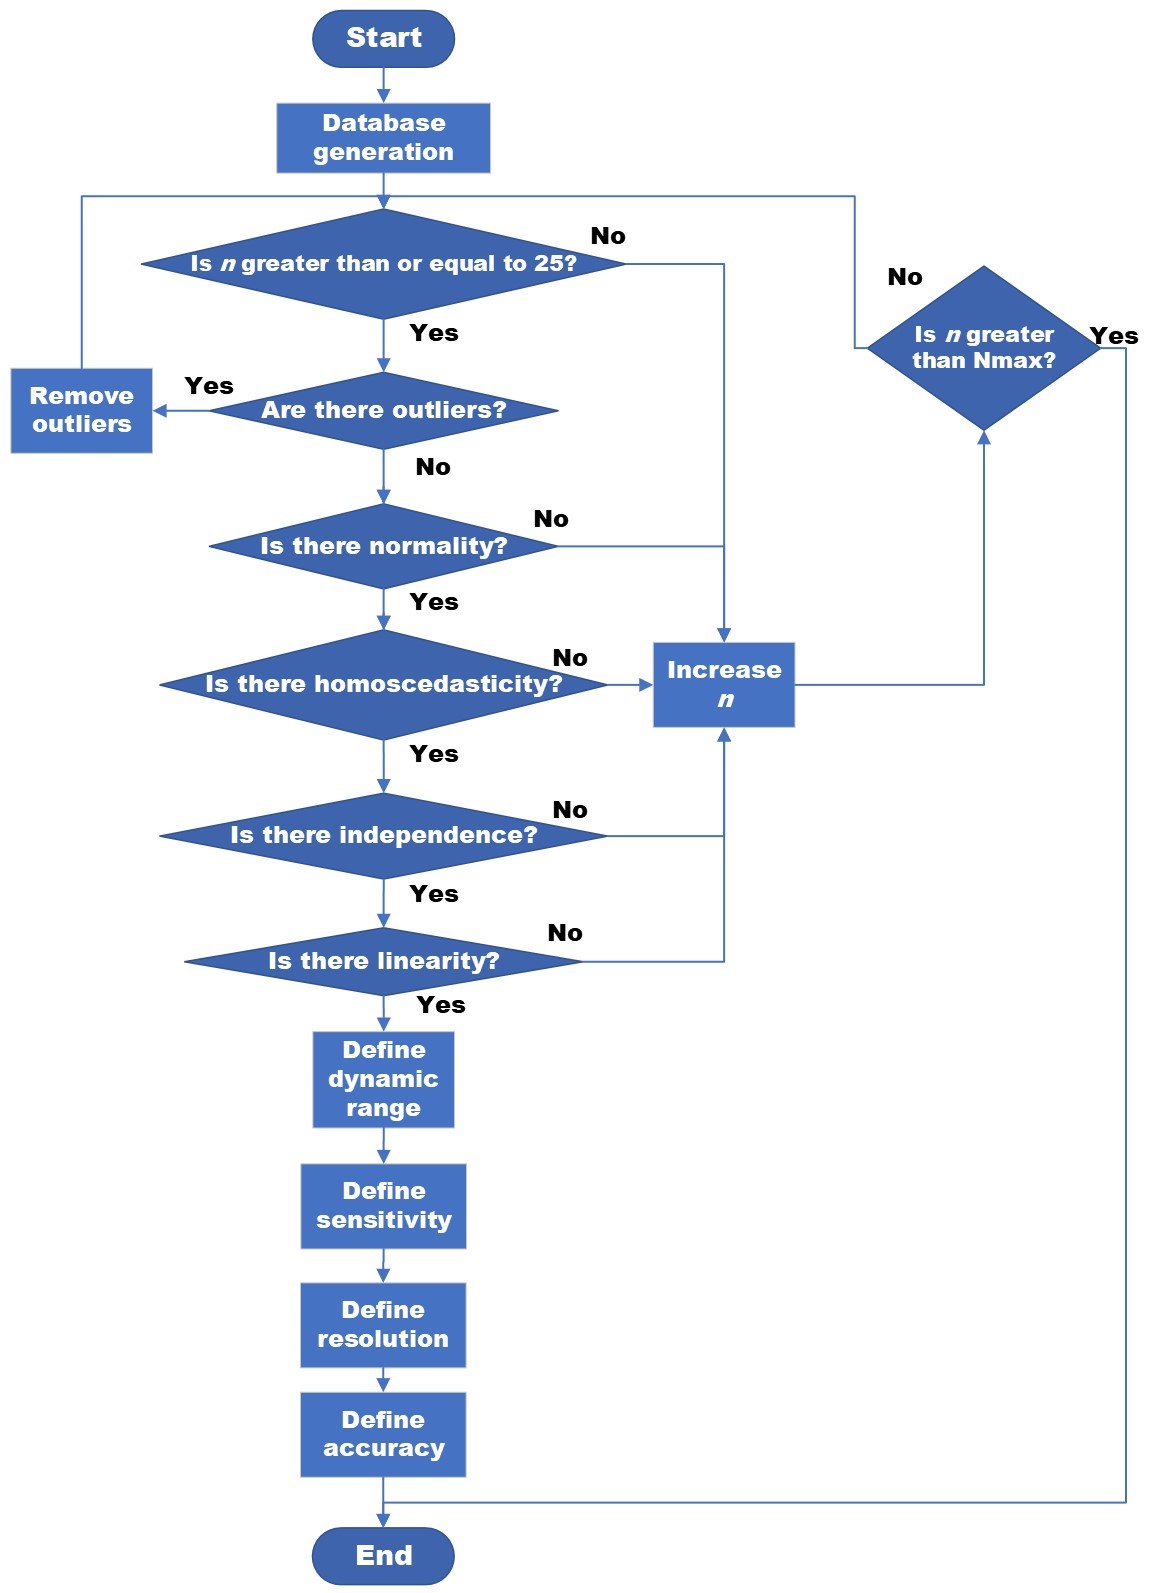
Figure 1. Flowchart of the proposed methodology.
Table of Contents
- Simple No linear regression assumptions
- Simple No linear regression quality
- Database structure
- Installation
- Code example
Simple No linear regression assumptions
- Outlier: The term anomaly indicates that there is data that deviates significantly from the rest.
- Normality: refers to the normal distribution of errors or residuals.
- Homoscedasticity: is another simple linear regression assumption and indicates whether the variance of the residuals is the same across different groups in the database.
- Independence: refers to the absence of temporal correlation between residuals.
Simple No linear regression quality
- Dynamic range: is defined as the range of values of the variable to be predicted within which linearity exists.
- Maximum Sensitivity: is defined as the maximum value of the change in the variable to be predicted with respect to the predictor.
- Resolution: is the ability of the measurement system to faithfully detect and indicate small changes in the characteristics of the measurement result.
- Accuracy: is the degree of agreement between the result of a measurement and a true value of the measurand.
Database structure
The "snl_exp_regression_quality" program works with two databases. The first database contains all repetitions for the variable X (see Figure 2(a)), and the second database contains all repetitions for the variable Y (see Figure 2(b)). Figure 2 illustrates an example of how to organize the data to use the program effectively.
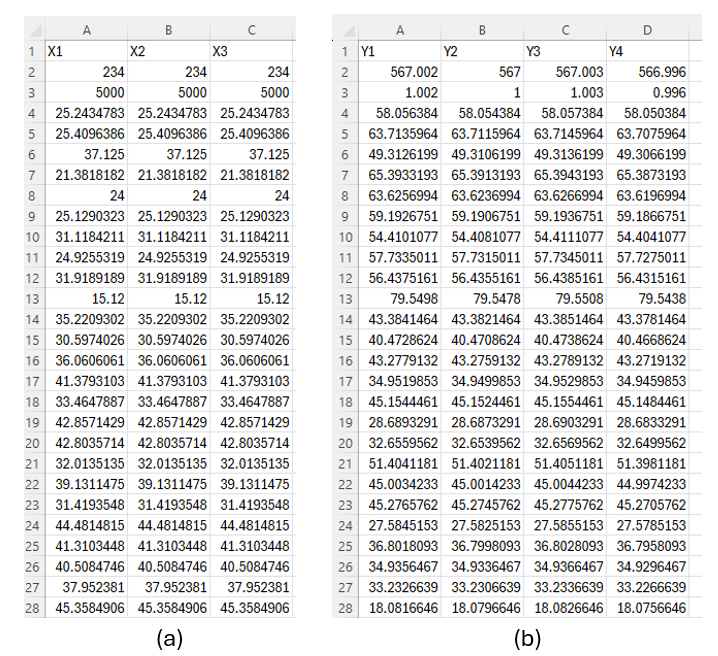
Figure 2. Example: (a) database for X, and (b) database for Y.
Installation
Instructions on how to install the project. For example:
pip install snl-exp-regression-quality
Code example
For instance, the following code can be executed in Google Colab. Simply copy and paste it into a new Colab notebook.
#--------------------------------------------------------------------------------------------------
# 1): Load libraries:
#--------------------------------------------------------------------------------------------------
from snl_regression_quality.snl_regression import SnlRegression
from snl_regression_quality.modules.methods.reading_data import ReadingData


#--------------------------------------------------------------------------------------------------
# 2): Initialization of input parameters:
#--------------------------------------------------------------------------------------------------

path_x_dataset = 'data_X.csv'
path_y_dataset = 'data_Y.csv'
significance_level = 0.05

# Uncomment a Single Model to Run:

#model_form = "concave_increasing"
#model_form= "convex_increasing"
#model_form = "convex_decreasing"
model_form= "concave_decreasing"

#--------------------------------------------------------------------------------------------------
# 3): Load and read data:
#--------------------------------------------------------------------------------------------------

x_values,y_values ,x_mean, y_mean = ReadingData(path_x_dataset,path_y_dataset,example=True).run()

#--------------------------------------------------------------------------------------------------
# 4): execute code:
#--------------------------------------------------------------------------------------------------

SnlRegression(x_values,y_values,x_mean,y_mean,model_form,significance_level).run()
Release history Release notifications | RSS feed


Download files
Download the file for your platform. If you're not sure which to choose, learn more about installing packages.
Source Distribution
Built Distribution
Filter files by name, interpreter, ABI, and platform.
If you're not sure about the file name format, learn more about wheel file names.
Copy a direct link to the current filters
File details
Details for the file snl_exp_regression_quality-0.1.4.tar.gz.
File metadata
- Download URL: snl_exp_regression_quality-0.1.4.tar.gz
- Upload date:
- Size: 3.1 kB
- Tags: Source
- Uploaded using Trusted Publishing? No
- Uploaded via: twine/6.1.0 CPython/3.10.16
File hashes
| Algorithm | Hash digest | |
|---|---|---|
| SHA256 |
6265b91063b97506138c0b9b07039e3a5cfb3ac0e4e2200dd2b2059964dff413
|
|
| MD5 |
e547be6a672fb2dc144b7480cc0297b4
|
|
| BLAKE2b-256 |
f3d39e0b343269ca672194fe1c2611bdd0dcfc684a05e36facf779a52f852bf5
|
File details
Details for the file snl_exp_regression_quality-0.1.4-py3-none-any.whl.
File metadata
- Download URL: snl_exp_regression_quality-0.1.4-py3-none-any.whl
- Upload date:
- Size: 3.0 kB
- Tags: Python 3
- Uploaded using Trusted Publishing? No
- Uploaded via: twine/6.1.0 CPython/3.10.16
File hashes
| Algorithm | Hash digest | |
|---|---|---|
| SHA256 |
781f42c3d2c5aa3d932c22bb9ede4b8af388378e6ef2719069e7a74a30eedcc3
|
|
| MD5 |
ff25088b420c15cebbf49e64238f4526
|
|
| BLAKE2b-256 |
3b4244cb5ba0c596d192682b29603ad446d40ee84da38058aa6a5581c49c96fb
|


