

spanda
Find out who calls a function — and be told, plainly, when nobody can know.
Deterministic static analysis for Python that reports its own blind spot, instead of reporting zero.





uv tool install spanda-graph
Every static analyser has a blind spot. Ask most of them who calls an event
hook, a route handler, or anything reached through getattr, and you get
0 callers — which reads as safe to delete. It isn't. It means the tool
couldn't see.
spanda reports that difference:
$ spanda callers . _apply_rls_context

models.py:57  function _apply_rls_context

  no static callers found

  ...but this symbol is dispatched at runtime. Whatever calls it is not
     visible in the source, so the count above is not the whole story.
That is the whole idea. Everything else is in service of it.
No LLM calls, no network, no telemetry. Zero runtime dependencies — standard library only. Same input, same output, every time.
Why this exists
You inherit a Python service with a thousand files and four years of history. Somewhere in it is code nothing has called in three years, and you cannot tell which — so you delete none of it.
grep gives you forty hits: a third in tests, a third in strings, the rest in
an __init__.py that re-exports the name one more hop. And the one caller that
actually matters is a Celery task, a Django signal, or a route handler that no
line of code names at all.
So the file stays. Every file stays. That is how a codebase gets to a thousand files.
Ask an agent instead, and it reads fifteen files to answer one question, spends the context you needed for the real work, and still finishes with "it appears to be unused."
The answer that made this necessary
An existing code-graph tool, evaluated on a production FastAPI and SQLAlchemy
backend. Asked what would break if _apply_rls_context changed, it reported:
affects 1 symbols
That function has zero static callers by design. It is registered with
@event.listens_for(...) and fires on every transaction begin in the system.
No call edges became no impact — on one of the highest-blast-radius functions
in the codebase.
grep finds nothing there either. The difference is that an empty grep result
makes you open the file and see the decorator, whereas a formatted impact
report reads like finished analysis. It converts "I found nothing" into
"there is nothing" — and it was blindest exactly where that stack is most
load-bearing: decorators, dependency injection, event hooks.
In fairness, that tool's caller lookup was substantially accurate, and mapping symbols to the tests that cover them was genuinely useful. The problem was not accuracy in the ordinary case. It was silence formatted as an answer in the case that mattered.
spanda exists to make that substitution impossible. Same function, same absence
of edges, opposite conclusion invited — the output at the top of this page is
that function. It is now one of the fixtures spanda is measured against, in
fixtures/README.md, alongside two other symbols that
are called at runtime and named by nothing.
What changes, measured
Both charts below are real measurements, taken with Claude Code working on a production Python codebase — not projections.
Answering costs a fraction of reading
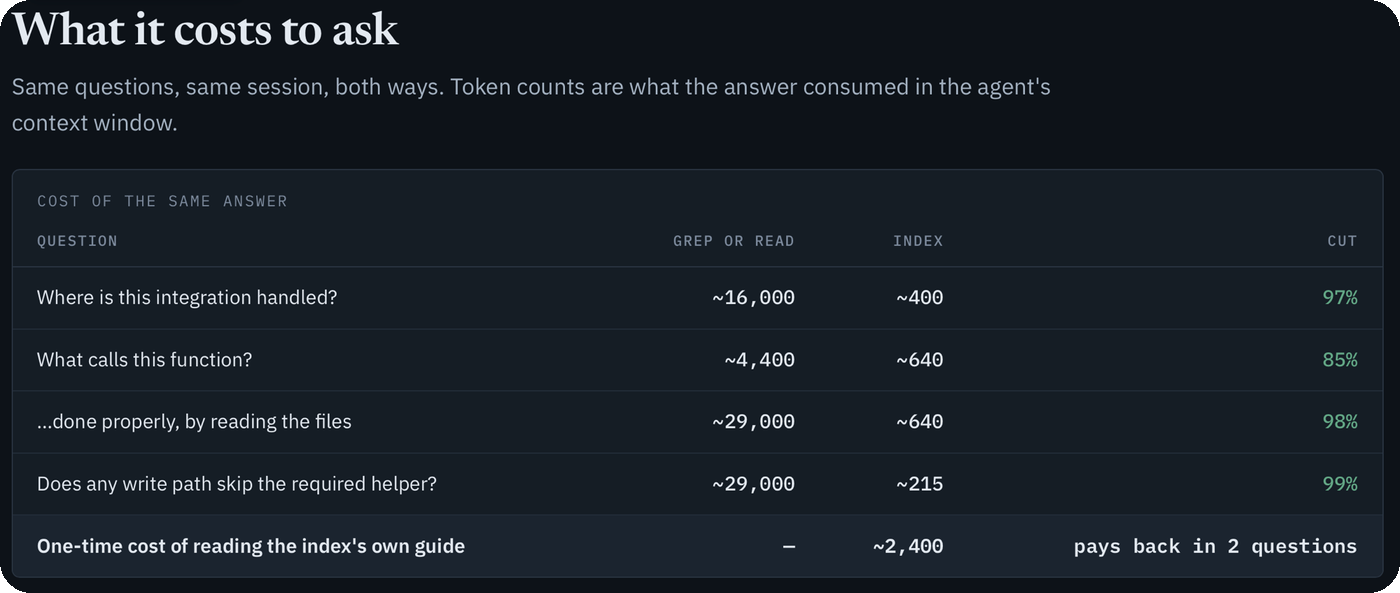
An index answers from a table rather than from the source. The agent stops opening files to work out what calls what, and the context it saves goes to the work you actually wanted done. Reading the index's own guide costs about 2,400 tokens once, and pays for itself by the second question.
What that saving is, and is not
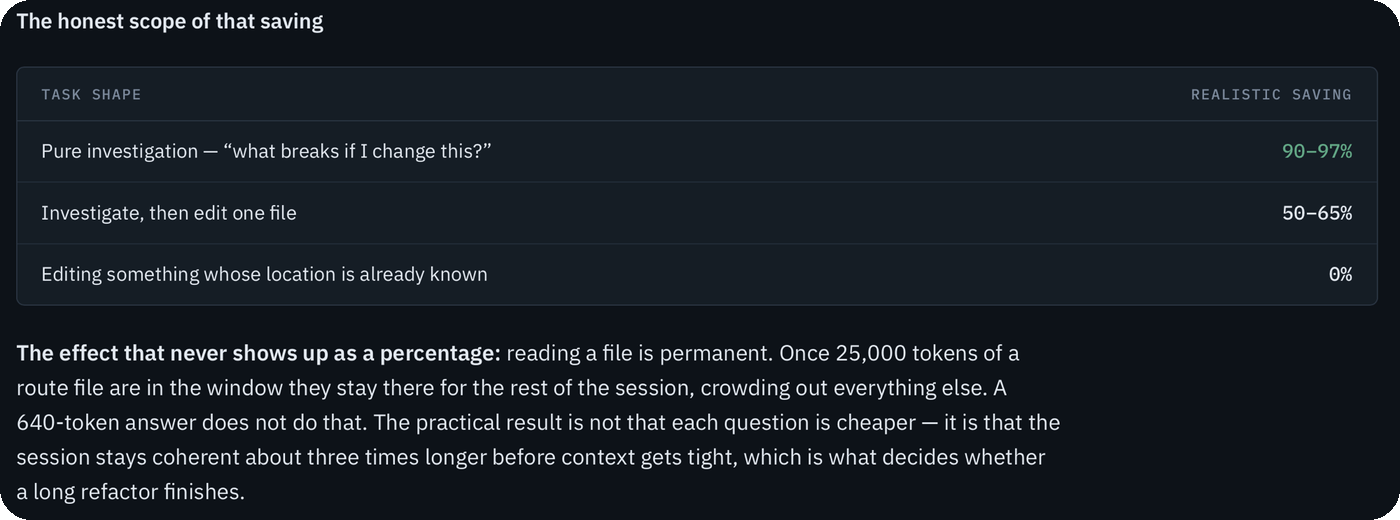
A 97% figure is true of one task shape and dishonest as a headline. If you already know which file to edit, an index saves you nothing at all.
The effect that never appears as a percentage is the one that matters most: reading a file is permanent. Those 25,000 tokens sit in the window for the rest of the session, crowding out everything after them. A 640-token answer does not. The practical result is not that each question is cheaper — it is that the session stays coherent roughly three times longer, which is what decides whether a long refactor finishes or dies halfway.
The "probably dead" list actually resolves
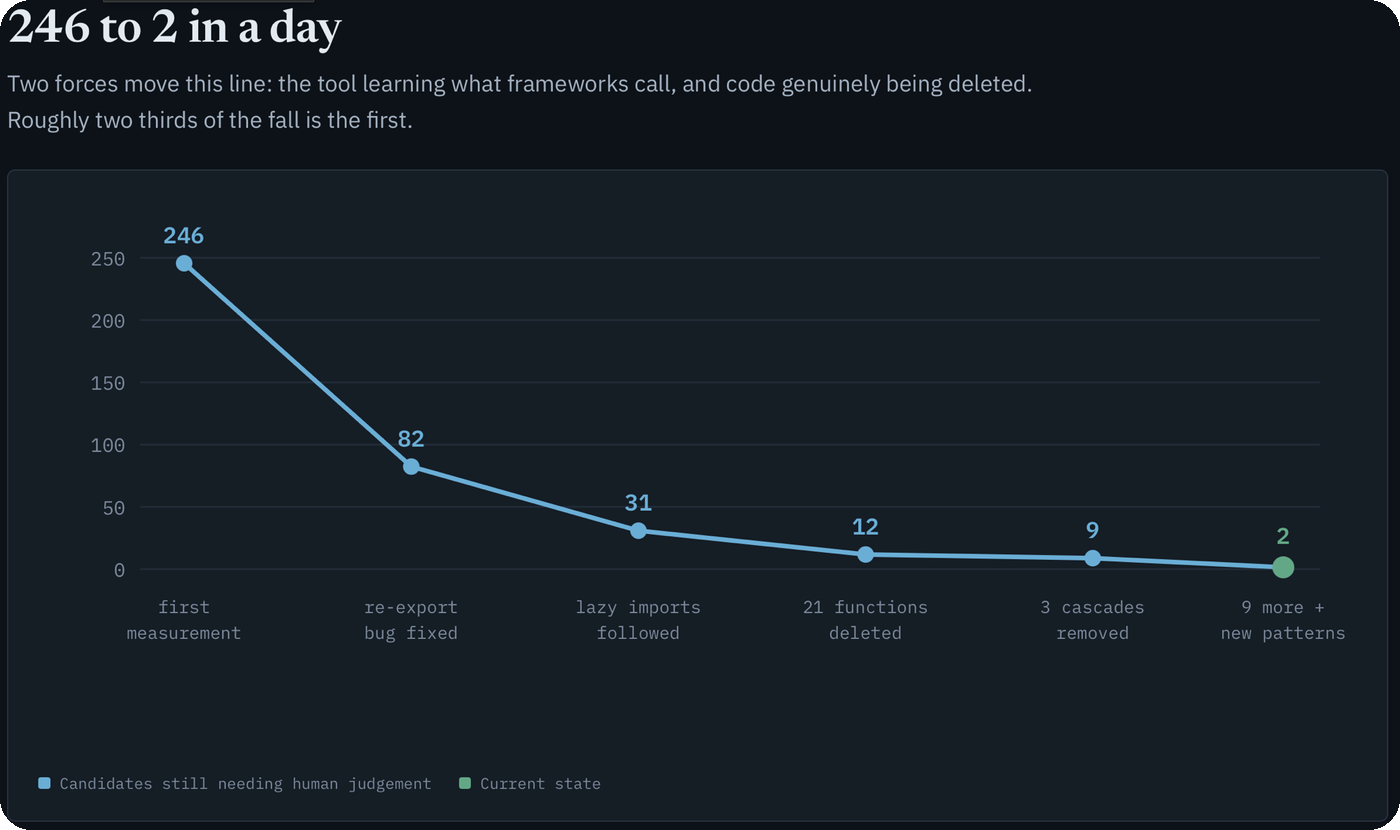
246 symbols with no visible caller, down to 2 in a day.
The important part is why it fell. Roughly two thirds of that drop is the tool learning what the frameworks in that codebase actually call — a re-export chain it was losing the trail on, lazy imports inside function bodies, one vetted decorator pattern at a time. Only the remaining third is code genuinely deleted.
That distinction is the entire point. A tool that had simply reported 246 dead symbols on day one would have been wrong about most of them, and confidently so.
What that day actually shipped
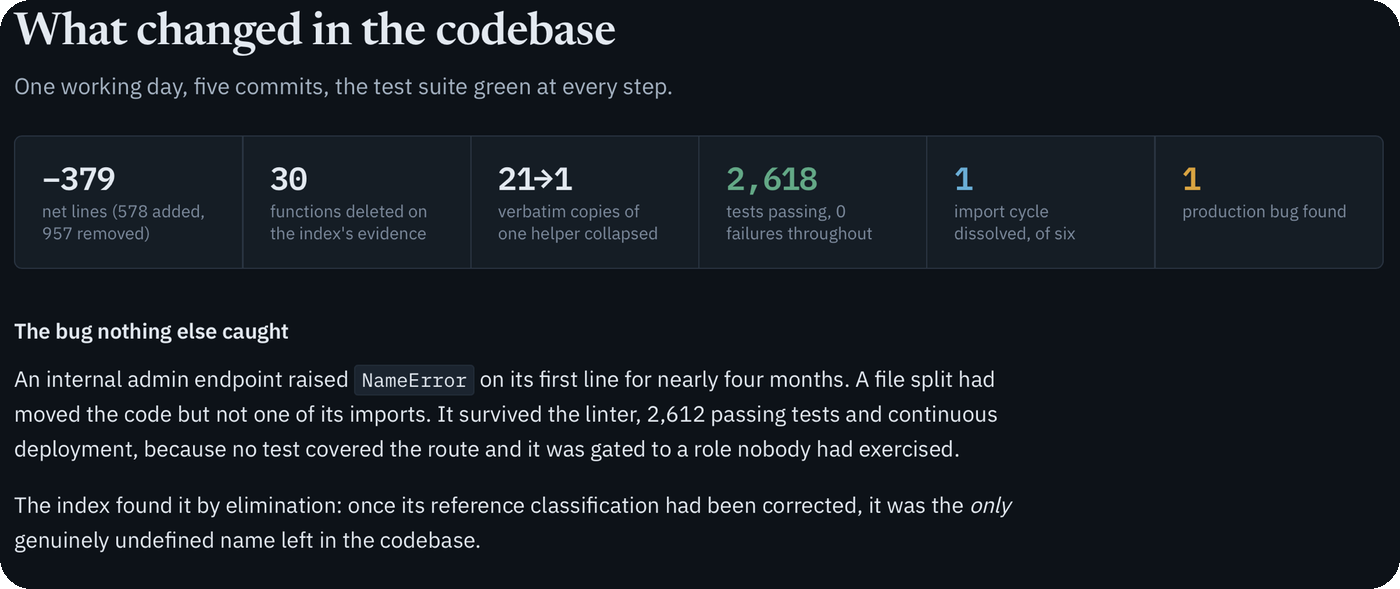
Five commits, one working day, the suite green at every step. The line that matters is the last one.
An internal admin endpoint had been raising NameError on its first line for
nearly four months. A file split moved the code but not one of its imports. It
survived the linter, 2,612 passing tests and continuous deployment, because no
test covered the route and it was gated to a role nobody had exercised.
Nothing found that bug. It fell out by elimination: once the index's reference classification was corrected, it was the only genuinely undefined name left in the codebase.
Install
uv tool install spanda-graph      # recommended: a standalone `spanda` on your PATH
pip install spanda-graph          # or into the current environment
The published distribution is spanda-graph; the command and the import
package are both spanda.
Other ways to install
uvx --from spanda-graph spanda gaps .        # try it without installing anything
uv add spanda-graph                          # as a project dependency
uv tool install git+https://github.com/pr0digy91/spanda    # from source, no release needed
pip install git+https://github.com/pr0digy91/spanda
To hack on it:
git clone https://github.com/pr0digy91/spanda && cd spanda
uv sync --all-extras && uv run spanda --help
Run it on the newest Python you have. A parser cannot read syntax from a release later than its own, so an old interpreter records valid files as syntax errors. 3.9 is the supported floor, not the version to use — and on macOS the built-in
python3is usually well behind.uv tool installanduvxfetch a current interpreter for you.
Using it, in order
Every command takes a path, and every command defaults to the current directory — so from inside the repository you are asking about, the path can be left off entirely. The examples below do exactly that.
1. Index the codebase
spanda index
Parses everything, stores it at .spanda/index.db inside the codebase itself,
and audits its own work: every name brought in by an import is traced to its
definition, and anything it could not place is reported rather than dropped.
Safe to re-run — symbols keep their identity across scans.
2. Find out what it cannot see
spanda gaps
Read this before you trust anything else. It is the map of the blind spot, grouped by why each symbol is invisible:
Decorated with something that dispatches at runtime — the framework calls these,
  and no reference in this codebase names them:

  models.py:57
      _apply_rls_context
      @event.listens_for(Session, 'before_flush')
  (4)

Decorated with something on neither list, and nothing names them. Not a claim
  that a framework calls these — a statement that spanda does not know. Vet, then
  add a line to dynamic_dispatch.txt either way:

  middleware.py:45
      nightly_cleanup
      @scheduler.scheduled_job('cron', hour=3)
  (1)

String literals that spell the name of a symbol defined elsewhere (heuristic —
  a name match is not a call, and must never become an edge):

  dynamic.py:14
      "on_created" names a symbol defined at handlers.py:9
  (3)
That last group is the one that makes dead-code detection dangerous:
handlers.on_created is called at runtime through a string in a dispatch
table. Nothing in the source names it. spanda will not call it dead, and will
not call it alive — it tells you where to look.
Add --unreferenced to also list symbols nothing references, split by whether
the silence is explained. Pass a path (spanda gaps ../other-repo) to ask about
somewhere else.
3. Ask about a specific symbol
spanda callers create_invoice
Gives you the callers it can prove, plus anything that might call it but cannot be proven to — with the reason attached, as in the example at the top.
4. Record what a person decides
Static analysis eventually runs out. When it does, someone looks at the symbol and decides — and that decision belongs in the index, not in memory:
spanda vet --alive "tasks.py::nightly_cleanup" --note "APScheduler, see config/jobs.py"
spanda vet
Re-running spanda vet checks every recorded decision against the newest scan:
which verdicts the code now contradicts, which patterns the alive ones imply (a
decorator vetted alive three times belongs in dynamic_dispatch.txt), and what
to look at next. --export and --from move verdicts between indexes.
What it refuses to guess
Four shapes make a caller invisible to any reader of the source. Each is reported as such, never as an absence:
| shape | example | what spanda says |
|---|---|---|
| Framework dispatch | @app.post(...), @event.listens_for(...) |
dispatched at runtime; callers not in the source |
| Runtime name assembly | getattr(mod, name), a dict of handler strings |
the call site is certain, the target is not |
| Inheritance from an absent base | overriding a method from an installed library | maybe inherited, not absent |
| Attribute on an unknown type | x.method() where x has no annotation |
unresolved, with the reason attached |
A heuristic stays labelled a heuristic and never becomes an edge in the graph.
Framework knowledge lives in dynamic_dispatch.txt as configuration, one glob
per line — and spanda parse ends with a census of every decorator your
codebase actually uses, so you grow that file from evidence rather than memory.
If you find a symbol reported with no callers that something really does call, please file it. That is the exact failure this project exists to eliminate.
Other questions it answers
| command | what it answers |
|---|---|
spanda loops |
where the loops are — including nesting that spans a function call, and database calls inside them |
spanda profile |
what the code keeps doing: re-implemented names, annotation rates, churn |
spanda drift |
what changed between two scans |
spanda backfill --last 10 |
replay past commits, so drift has real history to read today |
spanda imports |
which file each import points at, and what imports circularly |
spanda find "Order*" |
look up symbols by name |
spanda scans |
every run, with its timestamp, commit and fingerprint |
spanda guide |
a note on reading this index, with its own numbers in it, written to .spanda/README.md |
spanda parse --out out/ |
one inspectable JSON record per source file, storing nothing |
spanda resolve --reasons 3 |
link every reference to a definition, listing the failures |
spanda loops reads nesting off the call graph, not just out of one file — a
one-loop function called from another loop is three deep, and no single file
shows that. Every line is a place to look, never a score: spanda computes no
complexity number, because a number invites a threshold and a threshold invites
gaming.
What it does not do
- No LLM calls, no network, no telemetry. This is the deterministic layer. A description layer would consume its output, not live inside it.
- Python only, and no framework-specific parsing. Framework knowledge enters as configuration, never as code.
- No type inference. Annotations are used where the code provides them; where it does not, the reference is reported unresolved rather than guessed.
- No refactoring. spanda reads; it never edits your code.
- No quality score or grade.
Notes on the index
- Lives at
<path>/.spanda/index.db, inside the codebase it describes — one authoritative index per codebase..spanda/ignores itself with a.gitignoreof*: an index is derived data and never belongs in a commit. - Re-indexing is incremental in a git repository — only what changed is re-read, which is the difference between 52 seconds and 12 minutes over 425 commits.
- Memory depends on the largest file, not the codebase. Indexing streams one file at a time: 680 files index in 52 MB and about 3 seconds.
- A syntax error is recorded, not fatal. The file is marked unparseable with the interpreter's message, and the run completes.
- History lives in the index, not in filenames.
spanda scanslists every run with its timestamp, commit and content fingerprint. - Nothing is async, deliberately: parsing is CPU-bound and never waits, so async would add machinery and no speed.
Contributing
Bug reports and pull requests are welcome — see CONTRIBUTING.md.
License
MIT — see LICENSE.
1 maintainer

Download files
Download the file for your platform. If you're not sure which to choose, learn more about installing packages.
Source Distribution
Built Distribution
Filter files by name, interpreter, ABI, and platform.
If you're not sure about the file name format, learn more about wheel file names.
Copy a direct link to the current filters
File details
Details for the file spanda_graph-0.2.0.tar.gz.
File metadata
- Download URL: spanda_graph-0.2.0.tar.gz
- Upload date:
- Size: 133.9 kB
- Tags: Source
- Uploaded using Trusted Publishing? Yes
- Uploaded via:
twine/7.0.0 CPython/3.13.14
File hashes
| Algorithm | Hash digest | |
|---|---|---|
| SHA256 |
1d247c21179a385d7bddb70af089cadbe9eb2b4c2f1db130dedf83a48fa799bb
|
|
| MD5 |
604ef33ae283a761b7af557192dff80b
|
|
| BLAKE2b-256 |
f8ee5e25657ddab61eb760cbd60e6db4ee3b94412b7104bf2fdc5317e75f3018
|
Provenance
The following attestation bundles were made for spanda_graph-0.2.0.tar.gz:
Publisher:
publish.yml on pr0digy91/spanda
-
Statement:
-
Statement type:
https://in-toto.io/Statement/v1 -
Predicate type:
https://docs.pypi.org/attestations/publish/v1 -
Subject name:
spanda_graph-0.2.0.tar.gz -
Subject digest:
1d247c21179a385d7bddb70af089cadbe9eb2b4c2f1db130dedf83a48fa799bb - Sigstore transparency entry: 2698439221
- Sigstore integration time:
-
Permalink:
pr0digy91/spanda@33edb05365ee7b151e8f823cf90c983dc5d9195f -
Branch / Tag:
refs/tags/v0.2.0 - Owner: https://github.com/pr0digy91
-
Access:
public
-
Token Issuer:
https://token.actions.githubusercontent.com -
Runner Environment:
github-hosted -
Publication workflow:
publish.yml@33edb05365ee7b151e8f823cf90c983dc5d9195f -
Trigger Event:
release
-
Statement type:
File details
Details for the file spanda_graph-0.2.0-py3-none-any.whl.
File metadata
- Download URL: spanda_graph-0.2.0-py3-none-any.whl
- Upload date:
- Size: 101.6 kB
- Tags: Python 3
- Uploaded using Trusted Publishing? Yes
- Uploaded via:
twine/7.0.0 CPython/3.13.14
File hashes
| Algorithm | Hash digest | |
|---|---|---|
| SHA256 |
b00a314ac6f6696d0a4f1e3380adcf7f60e664744437fa851c77a96b5c20d4e6
|
|
| MD5 |
05571621eeda6ec15771cab24d1a9b99
|
|
| BLAKE2b-256 |
bc3ece688d0cb14c04eba38b444ca5ccb190bfb552f98de26ac84ffe42723321
|
Provenance
The following attestation bundles were made for spanda_graph-0.2.0-py3-none-any.whl:
Publisher:
publish.yml on pr0digy91/spanda
-
Statement:
-
Statement type:
https://in-toto.io/Statement/v1 -
Predicate type:
https://docs.pypi.org/attestations/publish/v1 -
Subject name:
spanda_graph-0.2.0-py3-none-any.whl -
Subject digest:
b00a314ac6f6696d0a4f1e3380adcf7f60e664744437fa851c77a96b5c20d4e6 - Sigstore transparency entry: 2698439254
- Sigstore integration time:
-
Permalink:
pr0digy91/spanda@33edb05365ee7b151e8f823cf90c983dc5d9195f -
Branch / Tag:
refs/tags/v0.2.0 - Owner: https://github.com/pr0digy91
-
Access:
public
-
Token Issuer:
https://token.actions.githubusercontent.com -
Runner Environment:
github-hosted -
Publication workflow:
publish.yml@33edb05365ee7b151e8f823cf90c983dc5d9195f -
Trigger Event:
release
-
Statement type:














