A tool for analyzing Spark History Server data and identifying optimization opportunities


Project description
Spark Analyzer
Analyze your Apache Spark applications for performance bottlenecks, resource inefficiencies, and optimization opportunities. Get actionable insights from your Spark History Server data with detailed stage-level analysis and recommendations.
Quick Start - No Registration: Run spark-analyzer analyze --save-local for immediate analysis.
Enhanced Analysis (optional): Obtain your ID for cost estimation and deeper analysis of your data.
Features
- Workflow Classification: Automatically categorizes Extract, Transform, and Load operations in Spark jobs
- Stage-Level Analysis: Detailed performance metrics and resource utilization analysis
- Storage Format Detection: Identifies Parquet, Delta, Hudi, and Iceberg usage patterns
- Privacy Controls: Configurable data hashing for masking sensitive information
- Local & Browser Modes: Support for direct access and browser-based Spark History Server interfaces
- Offline Analysis: Run completely offline with
--save-localflag for local data processing and reporting. No data leaves your environment. - Report Generation: Excel output with detailed optimization recommendations
What You'll Get
Ready to analyze your Spark applications?
Quick Start
# Install
pip install spark-analyzer

# Configure connection to your Spark History Server
spark-analyzer configure

# Local analysis (no registration required)
spark-analyzer analyze --save-local

# Generate Excel report
spark-analyzer report --input analysis_data.json --output my_report.xlsx

# Enhanced analysis with cost insights (if you have an ID)
spark-analyzer analyze
Installation
# Create and activate a virtual environment (recommended)
python3 -m venv myenv
source myenv/bin/activate  # On Windows: myenv\Scripts\activate

# Install the package
pip install spark-analyzer
Note: If you encounter "externally-managed-environment" errors, use a virtual environment as shown above.
Commands
The tool uses a subcommand structure for organization:
# Main commands
spark-analyzer                   # Default: runs analyze command
spark-analyzer analyze           # Explicit analyze command
spark-analyzer configure         # Configuration wizard
spark-analyzer report            # Generate acceleration reports
spark-analyzer readme            # Show the README documentation

# Get help
spark-analyzer --help            # Show general help
spark-analyzer analyze --help    # Show analyze command help
spark-analyzer configure --help  # Show configure command help
spark-analyzer report --help     # Show report command help
Usage
Basic Analysis
# Run with saved configuration
spark-analyzer

# Run with explicit analyze command
spark-analyzer analyze

# Run in local mode
spark-analyzer analyze --local

# Run in browser mode
spark-analyzer analyze --browser

# Run with local data saving (no upload)
spark-analyzer analyze --save-local

# Run with privacy protection
spark-analyzer analyze --opt-out name,description,details
Configuration
# Basic configuration
spark-analyzer configure
First-time users: The tool automatically runs the configuration wizard to set up connection mode and Spark History Server URL. Cost Estimator ID is optional for enhanced features.
Subsequent runs: Uses saved configuration and runs immediately.
Configuration file: Settings are saved to ~/.spark_analyzer/config.ini and can be manually edited if needed.
Runtime options (not saved in configuration):
--opt-out: Privacy protection settings--save-local: Local data saving without upload
Documentation: Use spark-analyzer readme to view the full documentation in your terminal.
Report Generation
# Generate Excel report (no data leaves your environment)
spark-analyzer report --input your_data.json --output report.xlsx

# Batch processing multiple files
spark-analyzer report --input "*.json" --output-dir ./reports/

# Get help
spark-analyzer report --help
The Excel report provides comprehensive Spark performance analysis. Optional: Send your report to spark-analyzer-admin@onehouse.ai for advanced optimization recommendations or technical consultation.
Connection Modes
The tool supports two connection modes:
Local Mode
Use when you have direct access to the Spark History Server (port forwarding or SSH tunnel).
-
Configure:
spark-analyzer configure -
Manual Configuration (optional): Edit
~/.spark_analyzer/config.ini:[server] # Standard installation base_url = http://localhost:18080 # Port forwarding # base_url = http://localhost:8080/onehouse-spark-code/history-server
-
Run:
spark-analyzer analyze --save-local  # Local analysis
# or
spark-analyzer analyze               # Enhanced analysis (prompts for ID if needed)
Browser Mode
Use when accessing Spark History Server through a browser (e.g., EMR interface).
-
Configure:
spark-analyzer configure -
Runtime Configuration: URLs and cookies are collected at runtime for security.
-
Get Browser Cookies:
- Open Spark History Server in browser
- Open developer tools (F12)
- Go to Network tab and click any request
- Find "Cookie" header in Request Headers
- Copy the entire cookie string
-
Run:
spark-analyzer analyze --save-local  # Local analysis
# or
spark-analyzer analyze               # Enhanced analysis (prompts for ID if needed)
Supported Platforms
The tool supports various Spark environments including EMR, Databricks, and other Spark History Server implementations. The configuration wizard will guide you through the specific setup steps for your environment.
Data Collection
Collected Information
Application-Level Data
- Application ID, name, start/end times
- Executor count and core allocation
- CPU and memory usage metrics
Stage-Level Data
- Stage ID, attempt information, names, descriptions
- Task counts and executor assignments
- Performance metrics (duration, CPU time)
- Execution plans and stack traces
Derived Metrics
- Workflow type classification (Extract, Transform, Load)
- Storage format detection
- Resource utilization analysis
- Performance bottleneck identification
Privacy Controls
Use --opt-out to hash sensitive fields:
# Hash all potentially sensitive fields
spark-analyzer analyze --opt-out name,description,details

# Hash only stage names
spark-analyzer analyze --opt-out name

# Hash only stage descriptions
spark-analyzer analyze --opt-out description
Available Options:
name: Stage names →name_hash_[numeric_hash]description: Stage descriptions →description_hash_[numeric_hash]details: Execution plans →details_hash_[numeric_hash]
Example:
- Original:
"stage_name": "show at Console.scala:14" - Hashed:
"stage_name": "name_hash_1002607082777652347"
Data Usage
- Purpose: Performance analysis and optimization recommendations
- Processing: Remote analysis data is processed by Onehouse's cloud infrastructure to generate personalized reports. With
--save-localmode, all processing happens locally - no data is transmitted. - Security: Data transmitted over HTTPS by configuring cost estimator ID is stored in Onehouse's secure cloud environment
- Retention: Analysis data is deleted once the report is emailed to you
Enterprise Considerations
Data Collection
- Uses Python's built-in
hash()function for consistent hashing - Tool does not collect any PII. Only stated data from Spark is processed/collected.
- Stage content may contain file paths, table names, or query fragments. Turn on privacy options if they are sensitive.
- Anonymous usage data collected via Scarf for tool improvement and analytics
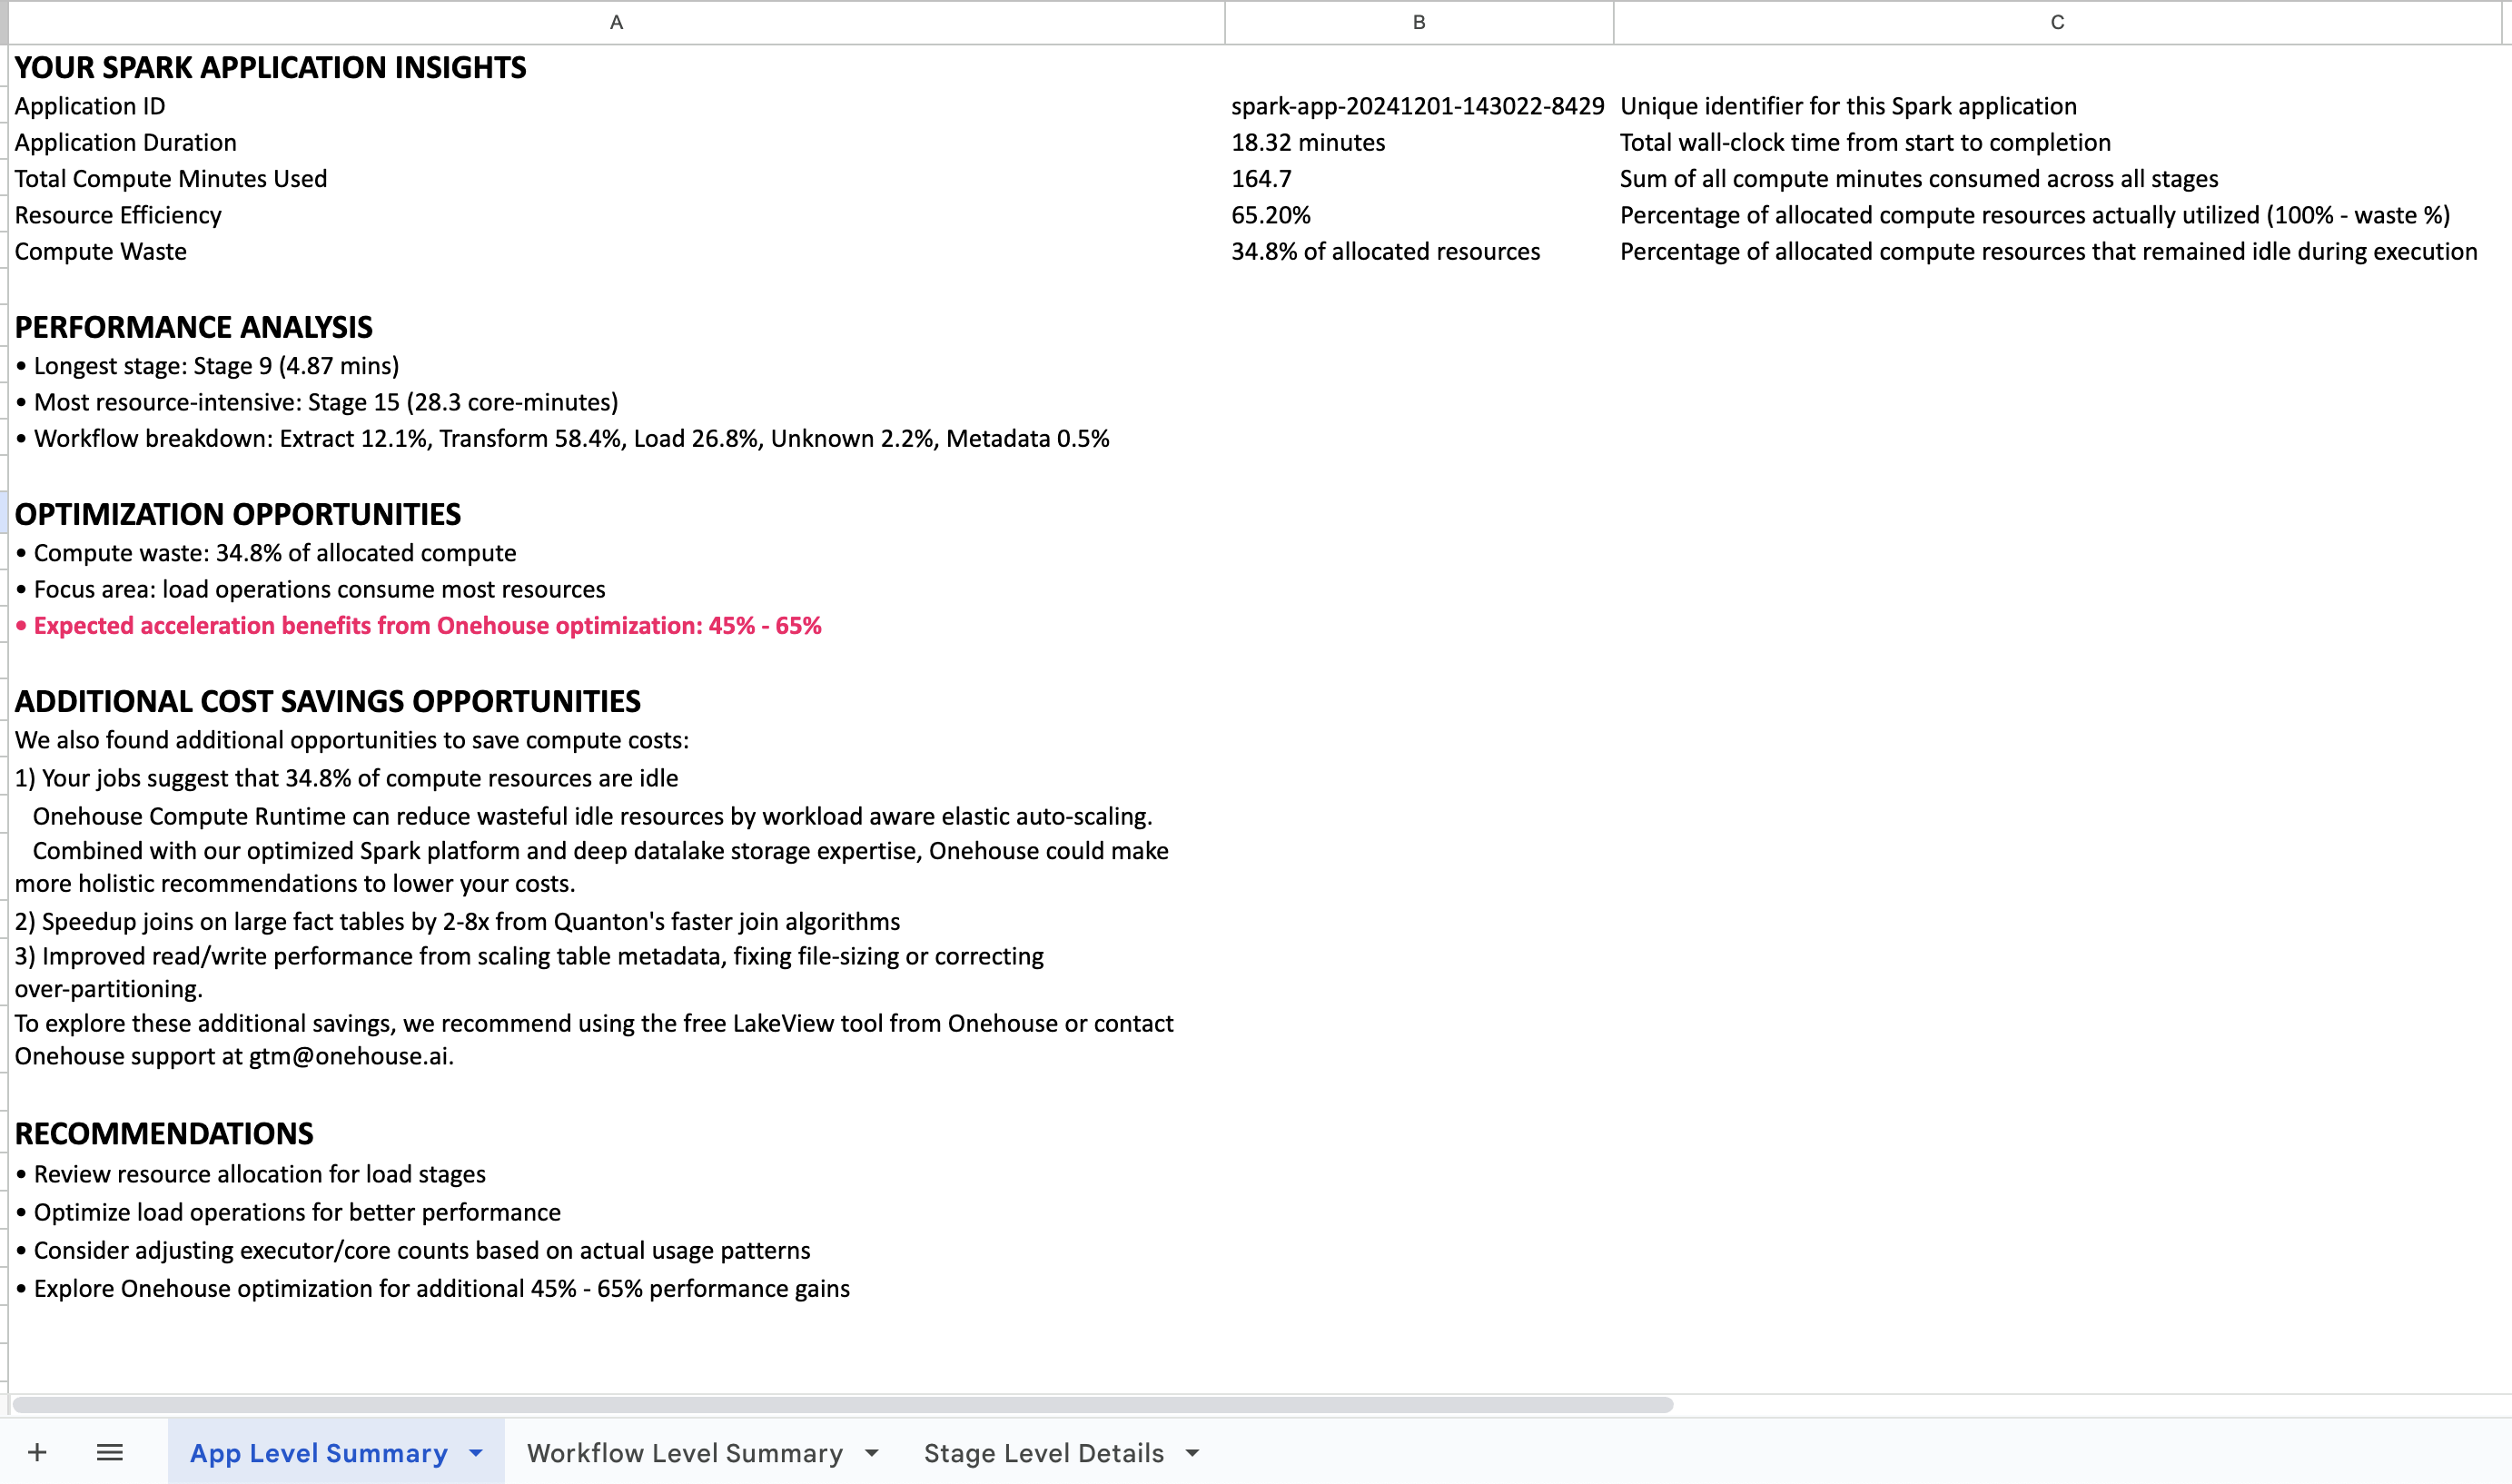
Report Output
Excel Report Structure
- Application Level: Overall metrics and acceleration summary
- Workflow Level: Breakdown by workflow type (Extract, Transform, Load, Metadata)
- Stage Level: Individual stage analysis with optimization recommendations
Troubleshooting
Common Issues
- Externally-managed-environment: Use virtual environment
- Connection Errors: Verify Spark History Server URL and port
- Authentication Issues: Ensure fresh cookies for browser mode
- Permission Errors: Check file write permissions for local mode
Debug Mode
# Enable debug logging
spark-analyzer configure --debug
spark-analyzer analyze --debug
Support
For questions, issues, or technical support, contact Onehouse support at spark-analyzer-admin@onehouse.ai.

Release history Release notifications | RSS feed


Download files
Download the file for your platform. If you're not sure which to choose, learn more about installing packages.
Source Distribution
Built Distribution
Filter files by name, interpreter, ABI, and platform.
If you're not sure about the file name format, learn more about wheel file names.
Copy a direct link to the current filters
File details
Details for the file spark_analyzer-0.1.30.tar.gz.
File metadata
- Download URL: spark_analyzer-0.1.30.tar.gz
- Upload date:
- Size: 450.6 kB
- Tags: Source
- Uploaded using Trusted Publishing? No
- Uploaded via: twine/6.2.0 CPython/3.14.0
File hashes
| Algorithm | Hash digest | |
|---|---|---|
| SHA256 |
4cf81885589b35a98b356c3d3e87f7a9fa1099c12b2309d89b36449918dfa1fe
|
|
| MD5 |
081a74659b7b3548af33e5887f56f7ca
|
|
| BLAKE2b-256 |
d85e3e6161c32949e2a0bf3216b4839b3f3854313690ed0072e75fef5c67d409
|
File details
Details for the file spark_analyzer-0.1.30-py3-none-any.whl.
File metadata
- Download URL: spark_analyzer-0.1.30-py3-none-any.whl
- Upload date:
- Size: 457.2 kB
- Tags: Python 3
- Uploaded using Trusted Publishing? No
- Uploaded via: twine/6.2.0 CPython/3.14.0
File hashes
| Algorithm | Hash digest | |
|---|---|---|
| SHA256 |
1ce5828588f59590272672acc683c5e6fd445116c42bd5b7084ecfeebfd54c6c
|
|
| MD5 |
68f323a58bd304d71d40bee54891b385
|
|
| BLAKE2b-256 |
a0a92e0ea847616097aa79e4ad95a41d49e8fdd8850718d4532c2e0184a40f3e
|


