
SPARK-SMI
A terminal-based system monitor (TUI) built for NVIDIA Grace Blackwell (GB10) and hybrid ARM architectures — because
nvidia-smialone doesn't tell the full story.






Demo
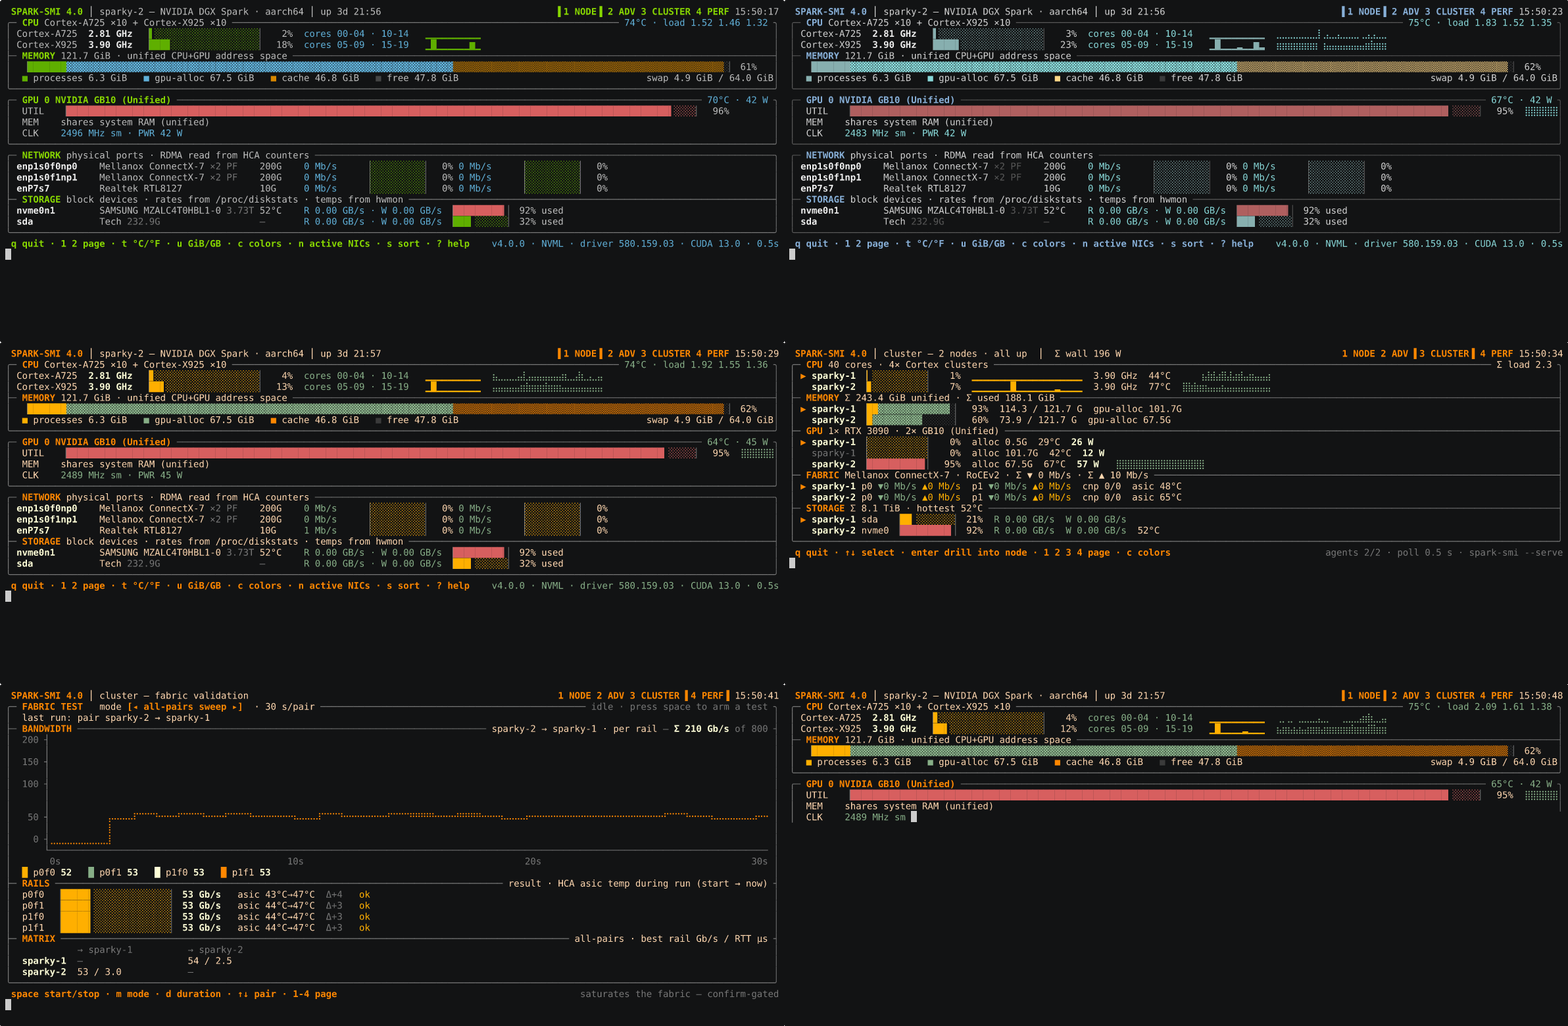
Live mode on a DGX Spark with an RTX 3090 attached — paging through the overview, the advanced panels, the cluster fleet view, and a fabric bandwidth test, then cycling color themes. Everything on screen is real hardware telemetry; nothing in this project is mocked or simulated.
Why SPARK-SMI?
The NVIDIA DGX Spark (GB10) is a unique system — a Grace Blackwell chip with
unified CPU+GPU memory, hybrid Cortex-X925/A725 core clusters, and high-speed
MT2910 200G networking. Standard tools like nvidia-smi, htop, and nvtop
were not built with this topology in mind. SPARK-SMI was — but it's not
hardcoded to it. Every piece of layout is driven by what the box in front of
it actually reports, so the same binary also renders something sane on a
plain x86 desktop with one consumer GPU.
| What it handles correctly | Standard tools |
|---|---|
| Hybrid P-core / E-core CPU clusters (ARM or Intel) | ❌ |
| GB10 unified memory (CPU+GPU shared) | ❌ |
| RDMA/RoCE-aware NIC bandwidth (bypasses the kernel netdev counters) | ❌ |
| Mixed GPU architectures in one system | ❌ |
| NVML with graceful CLI fallback | ✅ |
Zero system dependencies beyond psutil + pynvml |
✅ |
Four pages
Page 1 — Overview (1): CPU clusters with per-core load, MEMORY with a
segmented used/cache/free bar, one card per GPU (utilization, memory, clocks,
power), NETWORK (physical ports, RX/TX bars), STORAGE (block devices,
temperature, R/W rates, usage). This is the "glance at it and know the
system's state" page.
Page 2 — Advanced (2): per-GPU detail (clocks, PCIe generation/width/
throughput, power vs. limit, thermal trip points, throttle reasons,
persistence/compute-mode/ECC state, running processes), a PCIE LINKS
panel covering every PCIe endpoint in the system — storage/NVMe, network,
GPU — regardless of what's actually plugged into a given slot (see "PCIe
link monitoring" below), per-PF NIC detail (RDMA counters, CNP/ECN marks,
discards, ASIC temperature), every thermal zone and named hwmon device, and
NVMe SMART health. This is also where the interactive power/clock knobs
live (see below).
Page 3 — Cluster (3, needs --cluster): every node in the cluster on
one screen, each section (CPU / MEMORY / GPU / FABRIC / STORAGE) stacking one
row per node so you compare members down a column instead of tabbing between
hosts. Up to 8 nodes it's a sections view; beyond that it becomes a compact
fleet matrix plus an alerts panel. ↑/↓ selects a node and Enter drills
into that node's page 1. See "Cluster mode" below.
Page 4 — Fabric validation (4, needs --cluster with 2+ members): the
one page that actuates. It runs real RDMA bandwidth and latency tests
between nodes — per rail, node-to-node, or all nodes at once — and charts the
result live while correlating each NIC's ASIC temperature against sustained
load. Every run is behind an explicit confirm. See "Fabric validation" below.
PCIe link monitoring
Any PCIe slot can carry more than one kind of device over its lifetime — on
the reference DGX Spark this project runs on, the M.2 slot currently holds an
external RTX 3090 instead of the boot NVMe (which moved to a USB enclosure).
SPARK-SMI doesn't care which occupant is in a slot: page 2's PCIE LINKS panel
walks every endpoint under /sys/bus/pci/devices (storage, network, GPU) and
reports its negotiated link generation/width against its own declared
maximum, whatever the device happens to be.
This matters because of a known failure mode: a GPU can enter a power-draw
safety mode where its link downtrains to gen1 ×4 and stays there under
load. A plain idle downtrain (any PCIe device dropping link speed to save
power while idle) is completely normal and shown only as a dim
idle downtrain note. SPARK-SMI only raises the loud
⚠ gen1 under load — power safety mode? alert (red, on both the PCIE LINKS
row and that GPU's page-2 detail panel, plus a page-1 GPU-card warning row)
once the low-generation state has persisted for 3+ consecutive samples
while the GPU is genuinely busy (util ≥20%) — so a routine idle dip never
false-positives, but a GPU wedged at gen1 mid-workload gets flagged loudly
and stays flagged until it recovers.
Capability-driven, not hardcoded
Every collector probes what the hardware actually supports once, at
startup, into a small .caps dict, and the page builders consult it before
drawing anything. A missing sensor doesn't print N/A in a field that looks
broken — the field is simply absent.
The clearest example is the fan. On the GB10 (and any SoC matching the
unified-memory heuristic below), there is no independent fan controller NVML
or nvidia-smi can query — caps["fan"] comes back False, and the GPU
card's FAN field is dropped from that row entirely rather than showing a
permanent, misleading 0% or N/A. Drop the same code onto a machine with a
real fan-equipped GPU and the field reappears on its own — nothing about the
rendering path changed, only what the probe returned.
The same pattern holds everywhere: power_draw/power_limit are probed
independently (GB10 reports draw but not limits), mem_local flips to
False on any GPU name matching GB\d{2,3} (unified memory — system RAM is
shown instead, with "(Unified)" appended to the name), pcie/clocks gate
the page-2 detail rows, and spbm/RDMA/SMART availability each gate their
own panels or rows the same way. Page 2's power/clock knobs go a step
further and gate on writability, not just readability — see "Power tuning
notes" below.
Universal hardware detection
Nothing about topology is assumed; it's discovered at import/startup:
- CPU clusters — cores are grouped by actual silicon type: ARM MIDR
(implementer + part, translated to marketing names like Cortex-X925) on
ARM,
/sys/devices/cpu_core/cpu_atommasks for Intel P/E hybrids, or one flat "CPU Cores" group otherwise. Interleaved core layouts (the real DGX Spark alternates A725/X925 across the core ID space) are handled — the per-core grid shows absolute core IDs, not a relabeled contiguous range. - GPUs — NVML first, CLI (
nvidia-smi --query-gpu) fallback per field, "N/A" only as a last resort. Multiple GPUs of different architectures (a GB10 iGPU alongside a discrete card) render side by side without either needing special-case code. - NICs — physical interfaces come from
/sys/class/net, hardware names come from PCI vendor/device IDs (/sys/class/net/<i>/device/vendor|device) against a small built-in table (Mellanox, Realtek, Intel, Broadcom, MediaTek, Aquantia, NVIDIA) with a/usr/share/hwdata/pci.idslookup and then the kernel driver name as further fallbacks — so an unrecognized NIC still gets a sensible label instead of nothing. Multi-port cards (e.g. a dual-port ConnectX-7) are grouped by PCI slot into one row. - Storage — every physical block device under
/sys/block(loop/ram/dm devices skipped), model/size from sysfs, temperature from whichever hwmon matches it (NVMe controllers), usage from the largest mounted partition'sstatvfs. - Thermal zones — every
/sys/class/thermalzone plus every named/sys/class/hwmondevice's temperature channels. Zones sharing a generic type (several unlabeledacpitzzones, as on GB10) are relabeled Zone-A/Zone-B/… in zone order so they stay distinguishable.
Density tiers
The layout re-evaluates every frame against the terminal's current width — resize the window and it adapts live, no restart needed:
| Tier | Width | Behavior |
|---|---|---|
compact |
< 84 cols | Condensed layout: two NIC/disk entries per cell-row, GPU fields folded onto fewer lines. |
standard |
84–110 cols | Full field set, but GPU cards and THERMALS/SMART stack full-width instead of side-by-side. |
wide |
> 110 cols | The full multi-column layout; content is capped at 160 columns and centered on wider terminals. |
Resizing is live — the same running process, no restart, reflowing between wide, standard, and compact as the window changes. Every width below shows a complete page; the layout condenses (two NICs per row, CPU clusters onto one line) rather than clipping anything away:
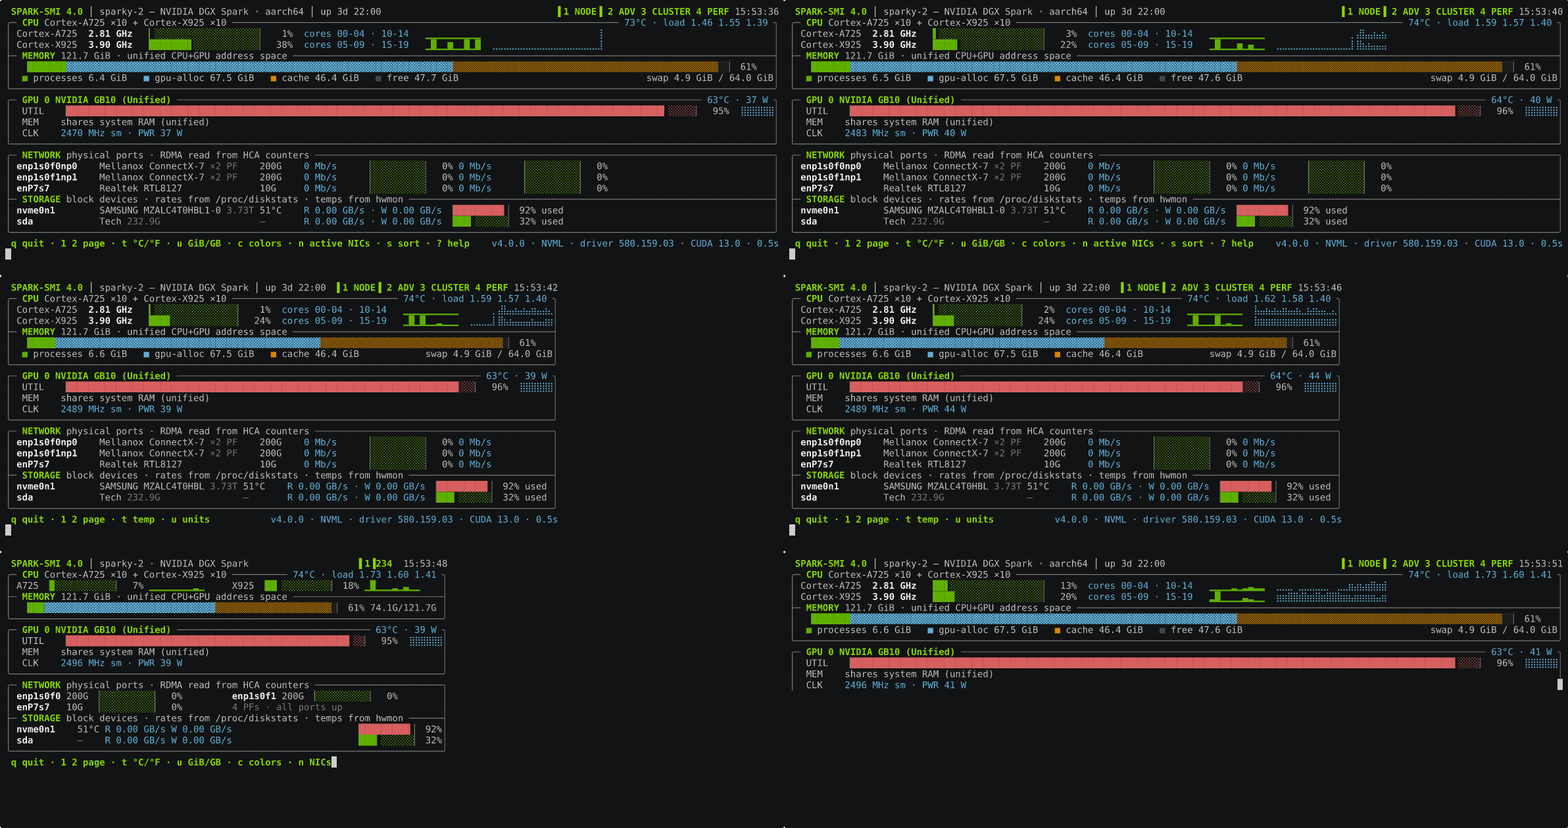
If a tier's content still doesn't fit the available height, things degrade further in this order: sparklines drop first, then the memory legend row, then NIC rows collapse into a single summary line.
Bar rendering itself has a separate three-tier auto-detection (sub-cell
eighths resolution on UTF-8 terminals, whole-cell blocks on framebuffer
consoles whose font lacks eighth-block glyphs, or plain-ASCII [||| ]
forced by --ascii, a non-UTF-8 stdout, or SPARK_SMI_ASCII) — independent
of the density tier, since it's about glyph support, not screen space.
The RDMA/HCA-counter story
On a machine with RDMA-capable NICs (Mellanox ConnectX and similar), GPU
traffic over RoCE/NCCL/GPUDirect bypasses the kernel's normal network stack
entirely — it never touches the netdev's rx_bytes/tx_bytes counters that
psutil, ifconfig, or ip -s link read. A monitor that only reads netdev
counters will show near-zero traffic on a link that's actually saturated.
SPARK-SMI reads the HCA's own hardware counters instead, wherever an
RDMA device is present: /sys/class/infiniband/<hca>/ports/<n>/hw_counters/
exposes port_rcv_data/port_xmit_data in 4-byte-word units (per the
InfiniBand spec — multiplied by 4 to get bytes), and these count RoCE traffic
that the kernel netdev stats miss. Every other NIC falls back to the normal
psutil netdev counters. RX and TX are kept as separate rates throughout
(never summed into one "throughput" number), and a counter reset from a
driver reload is clamped to zero instead of showing a giant negative-delta
spike.
Page 2's NIC panel goes further: per-PF congestion/ECN counters (CNP sent/
handled, ECN marks, buffer discards) straight from the same hw_counters
directory, plus ASIC temperature from the NIC's own hwmon device.
Keys
| Key | Page | Action |
|---|---|---|
q |
all | Quit |
1 / 2 |
all | Switch page (overview / advanced) |
3 |
all | Cluster page (only live with --cluster; inert otherwise) |
4 |
all | Fabric validation page (only live with --cluster and 2+ members; inert otherwise) |
t |
all | Toggle temperature units (°C / °F) |
u |
all | Toggle memory units (GiB / GB, decimal) |
c |
all | Cycle color theme (see "Themes" above; capital T is an undocumented alias) |
? |
1 / 2 | Toggle the help overlay (any key dismisses it) |
n |
1 | Show active NICs only |
s |
1 | Sort NIC rows by current rate (max of RX/TX), descending — toggle back to detection order |
Tab |
2 | Select GPU (when more than one) |
P |
2 | Focus/cycle the power-limit knob (GPU limit → PL1 → PL2 → SYSPL1 → SYSPL2, as available) |
C / M |
2 | Focus the SM / memory clock-lock knob |
R |
2 | Arm a clock reset (confirm required) |
X |
2 | Toggle GPU persistence mode (confirm required) |
← / → |
2 | Step the focused knob's pending value |
Enter |
2 | Apply the focused knob (raises a y/N confirm) |
Enter |
3 | Drill into the selected node's page 1 (remote sample; knobs disabled) |
↑ / ↓ |
3 | Select a node |
a |
3 | Fleet matrix (>8 nodes) only: show alerting nodes only |
o |
3 | Fleet matrix only: cycle sort column (name / GPU / power / alerts-first) |
Esc |
2 / 3 | Cancel the pending step or confirm (page 2) / back out of a node drilldown to the cluster page |
space |
4 | Start a fabric test (raises a y/N confirm) / stop one immediately, no confirm needed to abort |
m |
4 | Cycle test mode: one pair / all-pairs sweep / all-nodes burst |
d |
4 | Cycle test duration: 10s / 30s / 60s per pair |
↑ / ↓ |
4 | Select which pair to run (pair mode only) |
Page 4 (fabric validation) is confirm-gated for a reason: it drives real RDMA traffic between nodes and can saturate the fabric. See "Fabric validation" below before running one on a shared cluster.
Knobs only ever appear when they're actually writable for the hardware in front of you (see "Power tuning notes"), and applying one always goes through an explicit confirm prompt before anything is written. Knobs are always local-only: drilling into a remote node's page 2 (cluster mode) shows that node's data read-only, with a "knobs are local-only" note in the footer.
Themes
Ten named color themes, each a full remapping of the dashboard's 9 color
slots (bar fill, labels, warn/critical, frame dimming, accents, etc.) —
spark (green, the original default), nord (blue), dracula (magenta),
solarized (cyan), gruvbox (yellow), mono (grayscale), amber,
ice (cyan), sunset (magenta), cyber (cyan).
--theme <name>picks one for the session;--theme list(or--themes) prints the ten names and exits.$SPARK_SMI_THEMEsets the default when--themeisn't passed.- In live mode (
-l), theckey cycles through them (wrapping back tosparkaftercyber) — a footer toast confirms the new name for a few ticks. Lowercasecis deliberate: it's distinct from page 2's capitalC(SM clock-lock knob focus), so theme cycling works on both pages without stealing that binding. Terminals below 256-color fall back to each theme's basic-8 approximation automatically, same as the default theme always has.
spark-smi --theme nord
spark-smi --theme list
SPARK_SMI_THEME=dracula spark-smi -l
CLI flags
spark-smi [options]

  -l, --loop       live mode: curses TUI, refreshed continuously
  -n <secs>        refresh rate in seconds (default: 1)
  -p, --page <n>   which page to render in snapshot mode: 1 overview (default),
                   2 advanced (GPU detail, NIC/thermal/SMART panels),
                   3 cluster (requires --cluster), or 4 fabric validation
                   (requires --cluster with 2+ members; snapshot mode only
                   ever shows the last recorded run -- it never starts one)
  --theme <name>   color theme (default: spark; or $SPARK_SMI_THEME)
  --theme list     print the available theme names, one per line, and exit
  --ascii          force plain-ASCII bars/frames (no UTF-8 box drawing)
  --json           print one sample as JSON (+ node/model/version/ts) and exit
  --serve [PORT]   read-only HTTP sample server (default port 8817);
                   GET /sample, GET /healthz. $SPARK_SMI_TOKEN, if set, is
                   required as the X-Spark-Token header on /sample
  --serve-verbose  log one line per request to stderr (--serve only)
  --cluster HOSTS  cluster mode: page 3 shows every node in HOSTS (comma-
                   separated "host"/"host:port"/"ssh:host" entries, or
                   "@file" -- one entry per line, # comments). Bare
                   --cluster (no value) tries ~/.config/spark-smi/cluster
  -h, --help       show this help and exit
Snapshot mode (no -l) renders once and prints ANSI to stdout — pipe it, log
it, script it, same as nvidia-smi.
Cluster mode
Point one spark-smi at several nodes and page 3 turns into a fleet view:
# on each node you want to monitor from elsewhere:
spark-smi --serve                      # serves GET /sample + /healthz on :8817

# on the node you're watching from:
spark-smi -l --cluster sparky-1,sparky-2,sparky-3,sparky-4
spark-smi -l --cluster @~/.config/spark-smi/cluster   # or bare --cluster to try that path
spark-smi --cluster sparky-1,sparky-2 --page 3         # one-shot snapshot (2s poll cap)
hostpollshttp://host:8817/sample;host:portoverrides the port;ssh:hostfalls back tossh -o BatchMode=yes host spark-smi --jsonper tick — fine for bootstrapping a small cluster, not a substitute for--serveat any real scale. The entry matching the local hostname reads the local dashboard's own state directly instead of going over the network.- Up to 8 nodes: a SECTIONS view, one row per node under CPU / MEMORY / GPU / FABRIC / STORAGE. More than 8: a FLEET matrix (one compact row per node) plus an ALERTS panel (unreachable · temp ≥ 80°C · CNP storm · link down · disk ≥ 85%).
- A node that stops answering is marked stale (dim "unreachable Ns" row with its last-seen values) after 3× the poll interval — the render loop never blocks on the network; it always draws whatever the background poller last collected.
$SPARK_SMI_TOKEN, if set, is sent as theX-Spark-Tokenheader on every poll and required by--serveon the polled side (both ends read the same variable).
Fabric validation
Page 4 (4, live mode, --cluster with 2+ members) drives real RDMA/network
stress tests between cluster nodes and shows the results live: a per-rail
bandwidth chart, HCA ASIC temperature correlated against sustained load, and
an all-pairs latency/bandwidth matrix with an anomaly callout for a cable or
transceiver that's dragging the fleet down.
This page ACTUATES. Unlike every other page in spark-smi, opening it
doesn't just read sensors — pressing space and confirming with y starts a
test that saturates the fabric between the nodes involved. Nothing runs on
its own:
- Snapshot mode (no
-l) only ever shows the last recorded run — there is no code path from--page 4to starting a test. - Live mode requires the explicit
space→y/Nconfirm sequence (same ethos as the page-2 power/clock knobs). The confirm prompt warns when any cluster member's GPU looks busy (>10% util or a running compute process), so you don't accidentally flood the fabric under someone else's job. spaceagain while a test is running stops it immediately — no confirm needed to abort — and tears down every server/client process it started, on every node involved.
Requirements: perftest (ib_write_bw/ib_write_lat) on every node for
RDMA rails — falls back to iperf3 for a rail with no RDMA device. The
viewing node also needs passwordless (BatchMode=yes) SSH to every other
member; a node testing against itself, or the local node acting as one side
of a pair, runs the command locally instead of over SSH.
Modes (m cycles): pair (one src→dst, all its rails in parallel),
sweep (every ordered pair, sequentially — the default), burst (every node
pushes to its ring successor simultaneously; the aggregate is the sum of
everything observed at once). Duration (d cycles): 10s / 30s / 60s per
pair.
Results are appended to ~/.local/share/spark-smi/fabric-tests.jsonl (one
JSON line per completed pair) so the MATRIX panel and page-4's idle state
survive a restart — the bandwidth/temperature numbers come from the same
RDMA HCA counters and per-rail ASIC temp page 2 already reads, sampled once a
second during the run; perftest's own summary line is parsed only as a
secondary cross-check, never the primary source.
# on the node you'll drive tests FROM, in addition to the cluster-mode setup above:
ssh-copy-id sparky-2   # and every other member -- BatchMode=yes SSH must work unattended
sudo apt install perftest   # or iperf3, for rails with no RDMA device

spark-smi -l --cluster sparky-1,sparky-2,sparky-3,sparky-4
# press 4, then space, then y to run the default all-pairs sweep
Screenshots
All four captured on a DGX Spark with an RTX 3090 attached, mid-workload —
and each in a different color theme, since that's a c keypress away.
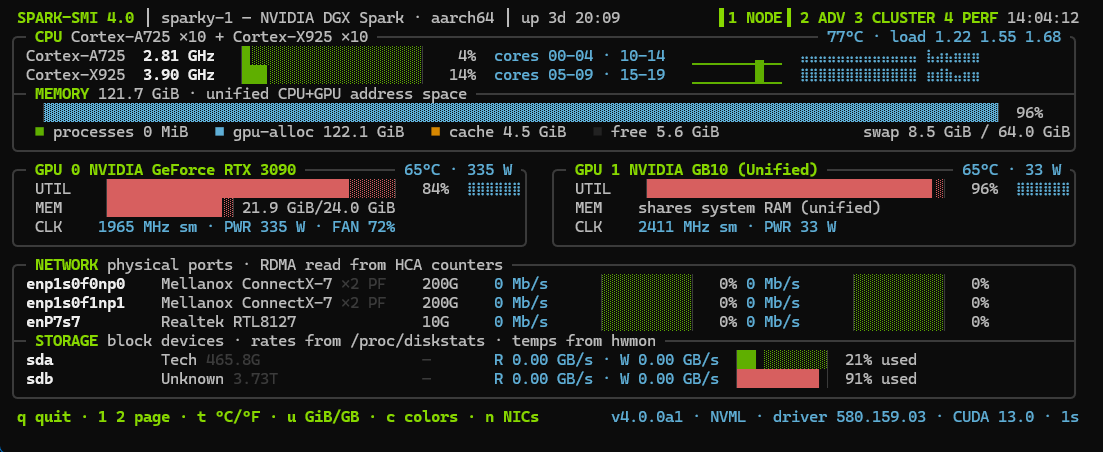
Page 1 — Overview. Hybrid Cortex-X925/A725 clusters, unified memory split into process/GPU/cache segments, both GPUs side by side, RDMA-aware NIC rates, storage.
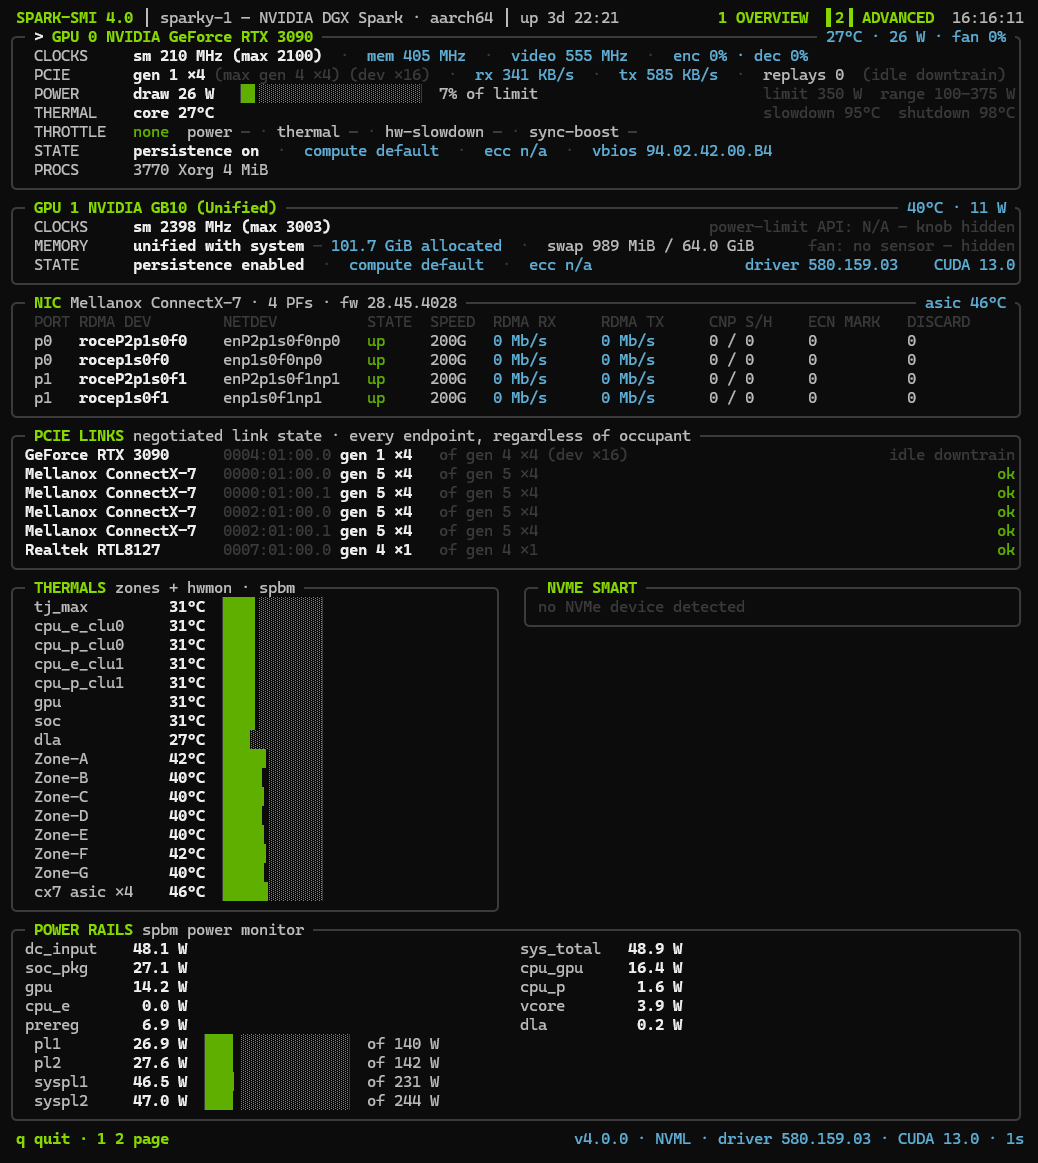
Page 2 — Advanced. Per-GPU clocks/PCIe/throttle/process detail, every
PCIe endpoint's negotiated link state, per-PF RDMA and congestion counters,
every thermal zone, NVMe SMART, and the spbm power rails with their knobs.
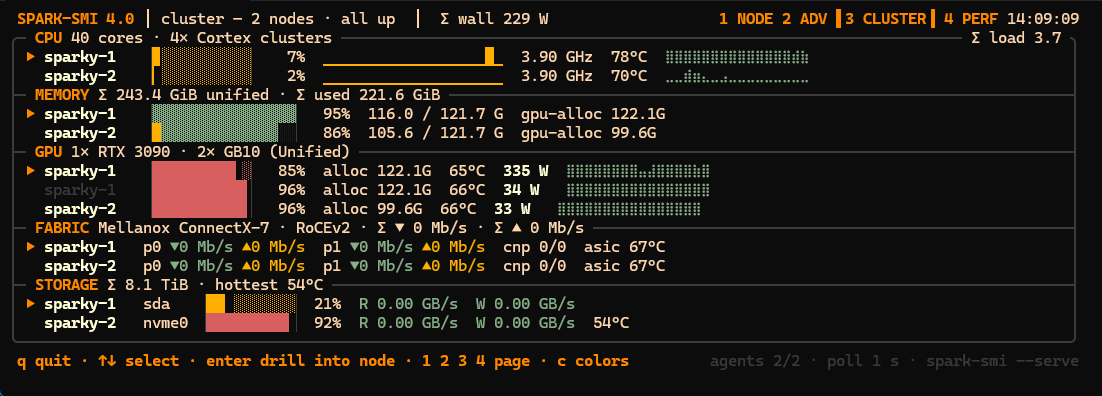
Page 3 — Cluster. Two nodes compared down each column, with a mixed-GPU fleet summary and per-node totals in the section headers.
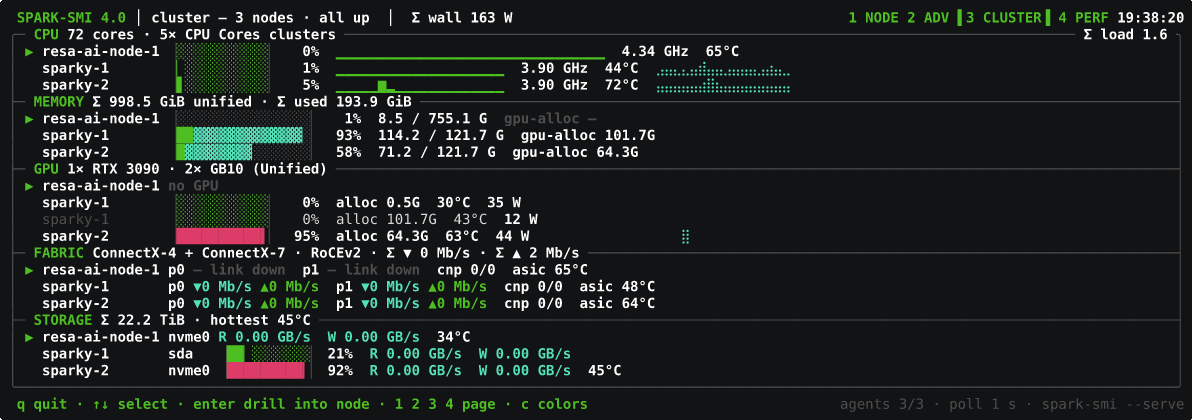
Nothing about that view is DGX-specific. Here is the same page across a
deliberately mismatched fleet — an x86_64 AMD EPYC server with no usable
NVIDIA driver alongside two aarch64 Sparks — 72 cores and 998 GiB summed
across three machines, ConnectX-4 and ConnectX-7 on the same fabric row, and
a GPU section that counts 1× RTX 3090 · 2× GB10 rather than assuming
they're all alike:
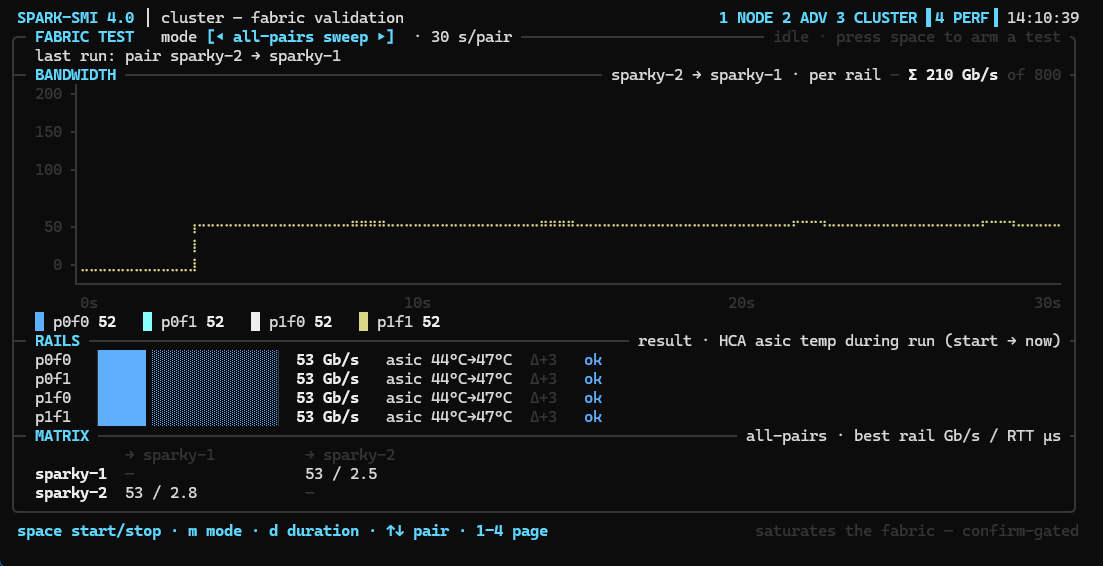
Page 4 — Fabric validation. Four rails driven concurrently, charted live, with ASIC temperature tracked across the run and an all-pairs bandwidth/latency matrix. The 53 Gb/s-per-rail figure here is real: four rails sharing one PCIe gen5 ×4 uplink, which is exactly the kind of ceiling this page exists to expose.
Prerequisites
- Linux for full fidelity — the collectors read
sysfs,hwmon,/proc, and/sys/class/infiniband. aarch64 and x86_64 both work. - Python 3.8+ (developed and tested on 3.12, the DGX Spark's system Python).
- NVIDIA driver with
nvidia-smionPATH— used as a per-field fallback when NVML is unavailable, and by the page-2 clock/persistence knobs. GPU panels simply don't appear if there's no NVIDIA GPU; everything else still renders.
Optional, each unlocking a specific feature: perftest (page-4 fabric
tests), the spbm driver (power rails + PL knobs on DGX Spark), and
passwordless SSH between nodes (cluster/fabric modes).
Install
Heads up for DGX Spark / Ubuntu 24.04 users: the system Python is marked externally managed (PEP 668), so a bare
pip install spark-smiis refused witherror: externally-managed-environment. That's the OS protecting itself, not a problem with this package. Usepipxor a venv below.
pipx — recommended
Installs into its own isolated environment and puts spark-smi on your
PATH, without touching system packages:
sudo apt install pipx          # once
pipx install spark-smi
pipx ensurepath                # once; then re-open the shell
spark-smi -l
venv
If you'd rather not install pipx:
python3 -m venv ~/.venvs/spark-smi
~/.venvs/spark-smi/bin/pip install spark-smi
~/.venvs/spark-smi/bin/spark-smi -l

# optional: make it a one-word command
echo "alias spark-smi='~/.venvs/spark-smi/bin/spark-smi'" >> ~/.bashrc
source ~/.bashrc
pip
On distros that don't mark their Python externally managed (and inside any activated venv or conda env), the plain install works as expected:
pip install spark-smi
spark-smi        # snapshot: render once, print, exit
spark-smi -l     # live mode
From source
git clone https://github.com/chappa-ai-llc/spark-smi.git
cd spark-smi
python3 -m venv venv
./venv/bin/pip install -r requirements.txt
./venv/bin/python3 spark-smi.py -l
Upgrading
pipx upgrade spark-smi                      # pipx
~/.venvs/spark-smi/bin/pip install -U spark-smi   # venv
4.0 is a drop-in upgrade from 3.x: same package name, same command, no
config files to migrate. The dashboard is reorganized into pages — what 3.x
showed on one screen is now page 1, and 2/3/4 reach the new ones.
Windows / macOS
Not the target platform, but useful for working on the UI: snapshot mode
renders a degraded psutil + nvidia-smi view, and live mode needs a curses
implementation. On Windows:
pip install spark-smi windows-curses
Linux-only panels (thermal zones, RDMA counters, SMART, power rails) are absent there because the sysfs paths they read don't exist — the same capability model that hides a missing fan sensor hides them.
Optional: spbm driver on DGX Spark
The DGX Spark's board-management/power-rail sensor isn't exposed by any
in-tree kernel driver — spark_hwmon
adds it as an out-of-tree spbm hwmon module via DKMS:
git clone https://github.com/antheas/spark_hwmon.git
cd spark_hwmon
sudo dkms install .
Once the module is loaded, SPARK-SMI picks it up automatically — nothing to
configure. THERMALS gets spbm's labeled zone names (e.g. cpu_e_clu0,
tj_max) listed first, and page 2's POWER RAILS panel gains the PL1/PL2/
SYSPL1/SYSPL2 power-rail readouts and, if the sysfs cap files are
writable, their tuning knobs (see below).
Secure Boot: an out-of-tree DKMS module is unsigned by default. With
Secure Boot enabled, the kernel will refuse to load it unless you either sign
it yourself and enroll the signing key (MOK) or disable Secure Boot in the
BIOS. This is a property of Secure Boot, not something SPARK-SMI or
spark_hwmon can work around.
⚠ Disclaimer — the knobs write real hardware
Most of SPARK-SMI only reads sensors. Two features do not:
- Page 2's power and clock knobs change the operating point of real
silicon — GPU power limits, SM/memory clock locks, board power rails
(
PL1/PL2/SYSPL1/SYSPL2), persistence mode. - Page 4's fabric tests drive real RDMA traffic that can saturate the network between nodes.
Raising a power limit or locking clocks can destabilise a running workload, increase temperatures and power draw, and — sustained, outside the vendor's defaults — stress hardware in ways its warranty may not cover. Lowering a limit can silently slow a job you didn't know was running. Nothing here overrides your hardware vendor's own limits, and nothing here can protect you from a setting your machine can't sustain.
Use these features entirely at your own risk. SPARK-SMI is provided under the MIT License, "AS IS", without warranty of any kind — see LICENSE. The authors and contributors accept no liability for damage to hardware, lost work, corrupted data, or downtime arising from use of these features. If you are not comfortable with that, simply don't use them: every read-only panel works exactly the same without ever touching a knob.
What the tool does on your behalf to keep this honest:
- Nothing is ever written without an explicit
y/Nconfirm — arrow keys only ever edit an in-memory pending value. - The confirm prompt itself carries a
! WARNING: writes hardwarebanner, so the warning appears at the moment of the write, not just here. - A knob that isn't writable on your system is shown greyed out with the reason, rather than silently failing.
- Snapshot mode never constructs the knob UI at all, so a scripted
spark-smirun cannot write anything. - Knobs are always local-only — drilling into a remote node in cluster mode gives you that node's data read-only.
Power tuning notes
- Wi-Fi/BT radio (BIOS): the DGX Spark's onboard Wi-Fi/Bluetooth radio
can be disabled in the BIOS/firmware setup. Doing so hands its power
budget back to the SoC/GPU. From SPARK-SMI's side this is invisible
bookkeeping — the radio's NIC row simply disappears from the NETWORK panel
(it's discovered from
/sys/class/netlike everything else, so an absent interface just isn't there to list). Re-enable it in the BIOS and the row reappears on the next detection pass, no restart of SPARK-SMI required since interface enumeration re-runs each tick's sample. - PL1/PL2 knobs (page 2): with the
spbmdriver installed and itspowerN_capsysfs files writable (root,sudo, or a udev rule granting write access), page 2 exposes thePL1/PL2/SYSPL1/SYSPL2rail power-limit knobs alongside the per-GPU power limit under thePkey. Every write goes through NVML/nvidia-smi/sysfs only after an explicity/Nconfirm — SPARK-SMI never writes anything on its own, and a knob that isn't writable on your system (wrong permissions, driver not loaded) is shown but grayed out with the reason rather than silently doing nothing.
Tested Hardware
4.0 was developed against the first machine below and deliberately validated against the second — a box with a different CPU vendor, different NIC generations, and no working NVIDIA driver at all — because "universal detection" is a claim worth testing rather than asserting.
Primary — NVIDIA DGX Spark (×2, clustered)
| Component | Details |
|---|---|
| SoC | GB10 Grace Blackwell (sm_121), Cortex-X925 ×10 + Cortex-A725 ×10 |
| Memory | 121.7 GiB unified CPU+GPU |
| External GPU | RTX 3090 (sm_86) — mixed architecture, one dashboard. Attached via the M.2 slot; the same slot could carry OCuLink or USB4 instead. However it's attached, the PCIE LINKS panel reports the negotiated truth |
| NICs | ConnectX-7 ×4 PFs (200G, socket-direct across 2 QSFP ports), Realtek RTL8127 (10G) |
| OS / Driver / CUDA | Linux 6.17.0-1021-nvidia · 580.159.03 · 13.0 |
Validation — AMD EPYC server, no NVIDIA driver
| Component | Details |
|---|---|
| CPU | AMD EPYC 9135 16-Core (32 threads), x86_64 |
| Memory | 755.1 GiB |
| GPU | None usable — nvidia-smi present but unable to reach a driver |
| NICs | ConnectX-4 ×2, ConnectX-6 Dx ×2 (100G), Realtek USB 1G |
| Storage | KIOXIA NVMe ×2 + md RAID |
| OS | Ubuntu 24.04.4, Linux 6.8.0 |
Every GPU panel drops out on the EPYC box, k10temp and the KIOXIA SMART
data appear in their place, and the ConnectX-4/6 cards are named from the
same PCI-ID path the ConnectX-7s use. That round-trip found four real bugs,
all fixed in 4.0 — see the changelog.
Roadmap
- REST API / Prometheus Exporter — Expose a lightweight JSON HTTP endpoint for Grafana and Prometheus integration
- CSV Logging Mode —
--csvflag to pipe raw metrics to stdout or file for external processing - PyPI Package —
pip install spark-smione-liner install - Capability-driven universal detection — CPU/GPU/NIC/storage/thermal topology discovered at runtime, not hardcoded to one machine
- Page 2 advanced panels + power/clock knobs — per-GPU detail, per-PF RDMA counters, thermal/SMART, interactive power/clock control
- Multi-node Support — Monitor clustered DGX Spark nodes from a single dashboard
About
Built by chappa-ai-llc — a solo homelab project born out of frustration with existing tools on novel hardware.
Full release history in the changelog. Bugs and feature requests go to GitHub Issues.
If this saved you time, a ⭐ on the repo is appreciated.
License
MIT — see LICENSE for details.
1 maintainer

Metadata
1 maintainer
Release files for spark-smi 4.0.0
For a detailed explanation of source distributions (sdists) and built distributions (wheels), please see the package formats documentation.
Source distribution (sdist)
| File | Size | Uploaded | |
|---|---|---|---|
| spark_smi-4.0.0.tar.gz | 156.3 kB | Details |
Built distribution (wheel)
| File | Interpreter | ABI | Platform | Reset |
|---|---|---|---|---|
| spark_smi-4.0.0-py3-none-any.whl | Python 3 | none | any | Details |
Total release size: 292.3 kB
Release files / spark_smi-4.0.0.tar.gz
| Download URL | spark_smi-4.0.0.tar.gz |
|---|---|
| Size | 156.3 kB |
| Tags | Source |
|
SHA-256 checksum How to use checksums |
382c937e35cef0b3ba3af03275b63307844c261f8117ed7ef0673e2a024acefc
|
|
BLAKE2b-256 checksum How to use checksums |
e7a8a6c54fe33049e9bcca3b85d50337567cc720809ecdb9a1a22fa2cc8633d6
|
| Upload date | |
|
Uploaded using Trusted Publishing? What is trusted publishing? |
No |
| Uploaded via |
twine/7.0.0 CPython/3.13.3
|
Release files / spark_smi-4.0.0-py3-none-any.whl
| Download URL | spark_smi-4.0.0-py3-none-any.whl |
|---|---|
| Size | 136.0 kB |
| Tags | Python 3 |
|
SHA-256 checksum How to use checksums |
78c2a2eb369cf9705374e12d0602c6647cfb6e76b0bc73908220e9b97a47259d
|
|
BLAKE2b-256 checksum How to use checksums |
bb2ded7e497f4b0a0cffa6d6140e78b57302d0d90182fee5a65de8d5f1eabd64
|
| Upload date | |
|
Uploaded using Trusted Publishing? What is trusted publishing? |
No |
| Uploaded via |
twine/7.0.0 CPython/3.13.3
|














