3D ST Visualization in Jupyter

Project description
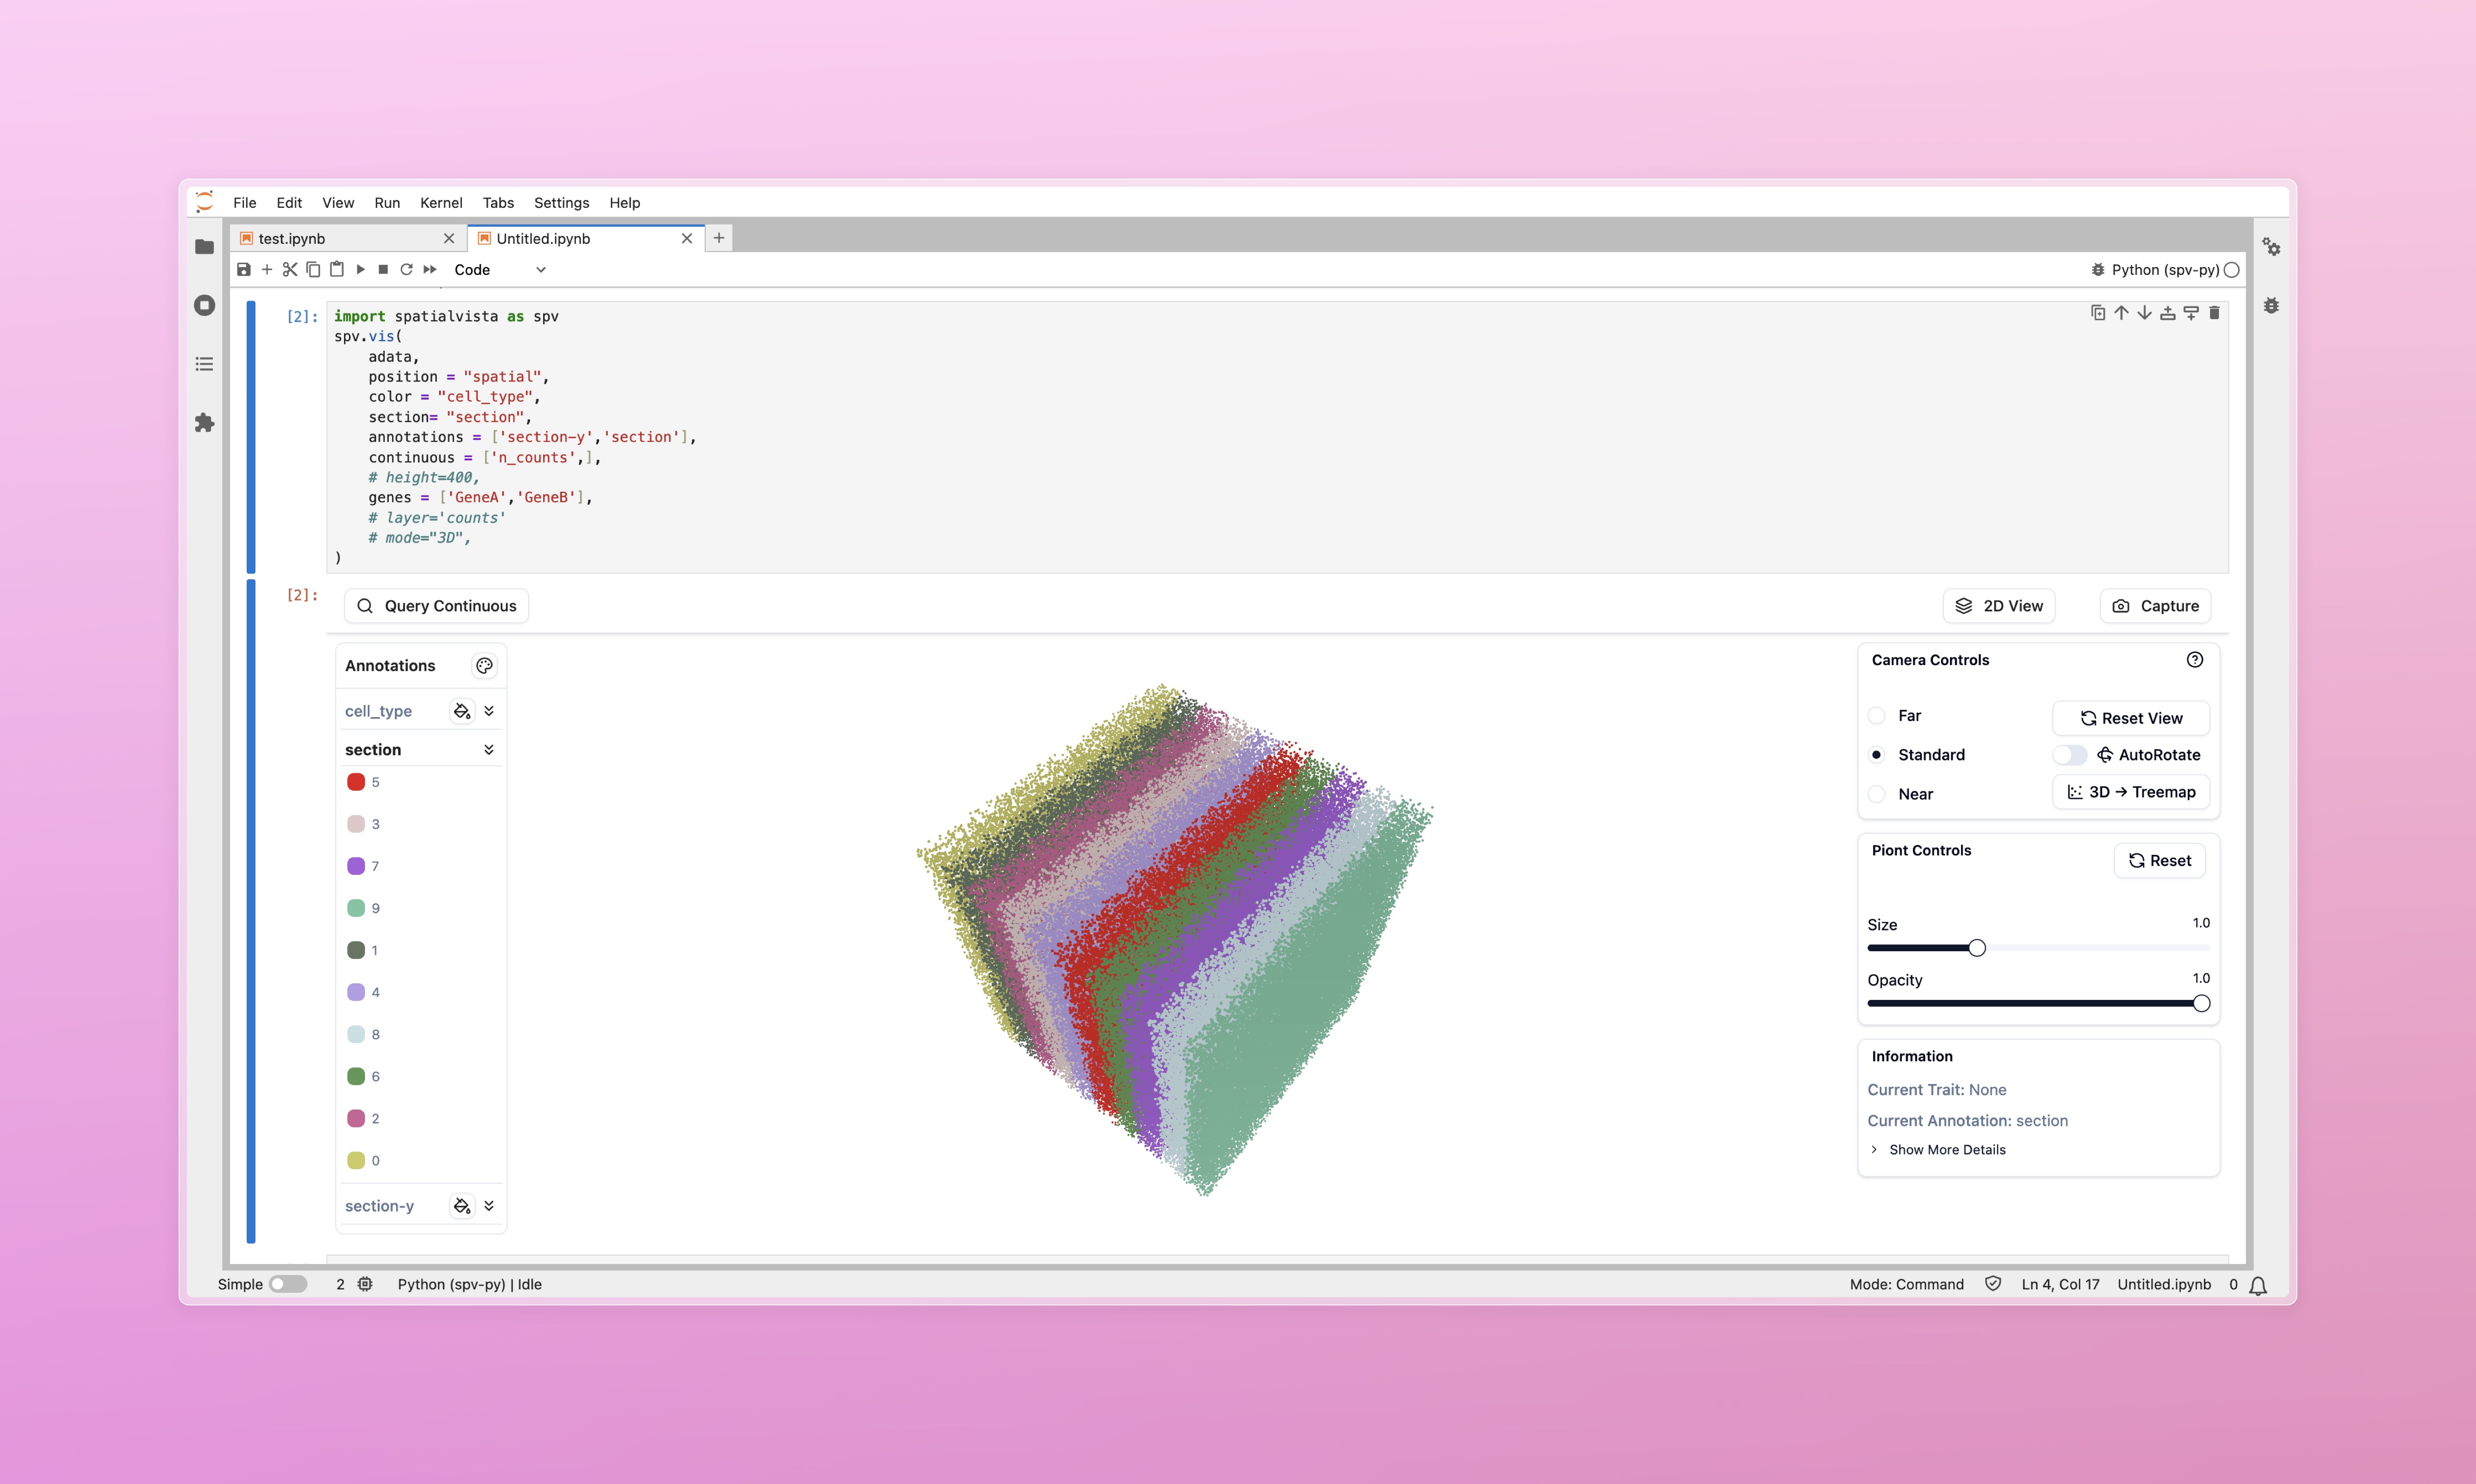
SpatialVista - Interactive 3D Spatial Transcriptomics Visualization in Jupyter


Overview
SpatialVista is an interactive 3D spatial transcriptomics visualization tool designed specifically for Jupyter Notebook/Lab. It seamlessly integrates into your data analysis workflow, providing efficient and intuitive exploration of spatial omics data.
✨ Key Features
- 🚀 High-Performance Rendering - WebGL-based 3D rendering supporting millions of cells
- 📊 Multi-Dimensional Data Display - Support for categorical annotations, continuous values, gene expression, and more
- 🎨 Interactive Controls - Real-time adjustment of colors, transparency, point size, and other parameters
- 🔬 2D/3D View Switching - Flexible switching between 3D point cloud and 2D slice views
- 🧬 Gene Expression Query - Quick visualization of spatial expression patterns for any gene
- 📐 Multiple Layout Modes - Support for original coordinates, 2D Treemap, histogram, and more
- 🎯 Precise Filtering - Filter data points by category, numerical range, and other conditions
- 💾 One-Click Screenshots - Easily save current views for publications and reports
🎯 Use Cases
SpatialVista is particularly suitable for:
- Spatial Transcriptomics Data Exploration - Visium, MERFISH, seqFISH, STARmap, and other technologies
- Single-Cell Spatial Data Analysis - Visualize spatial distribution of cell types
- Tissue Architecture Studies - Explore molecular features of tissue regions
- Gene Expression Pattern Analysis - View spatial expression of specific genes
- Data Quality Control - Quickly check data integrity and outliers
🚀 Quick Start
Installation
pip install spatialvista
Basic Usage
Launch your jupyter notebook or jupyter lab. And play with SpatialVista!
import spatialvista as spv
import numpy as np

# Create minimal test data
class FakeAnnData:
    def __init__(self, n: int):
        self.obsm = {"spatial": np.random.rand(n, 3)}
        self.obs = {"celltype": np.random.choice(["A", "B", "C"], n)}
        self.var_names = []
        self.X = None
        self.n_obs = n
adata = FakeAnnData(n=10_000)

# Create visualization
spv.vis(adata, position="spatial", color="celltype")


import scanpy as sc
# Load yout real data
adata = sc.read_h5ad("spatial_data.h5ad")

# Create interactive visualization
spv.vis(
    adata,
    position="spatial",  # obsm key containing spatial coordinates
    color="celltype",    # Default annotation for coloring
    height=600               # Widget height in pixels
)
That's it! 🎉
📚 Core Features
1. Categorical Annotation Visualization
# Color by cell type
widget = spv.vis(
    adata,
    position="spatial",
    color="celltype",
    annotations=["leiden", "tissue_region"]  # Additional annotations to load
)
2. Continuous Value Visualization
# Visualize continuous values (e.g., QC metrics)
widget = spv.vis(
    adata,
    position="spatial",
    color="celltype",
    continuous=["total_counts", "n_genes"]  # Continuous value fields
)
3. Gene Expression Visualization
# View expression patterns of specific genes
widget = spv.vis(
    adata,
    position="spatial",
    color="celltype",
    genes=["Pecam1", "Cd3e", "Epcam"],  # Gene list
    layer="normalized"  # Optional: use specific layer if available
)
4. 2D/3D View Switching
# If data has section information, switch to 2D view in UI
widget = spv.vis(
    adata,
    position="spatial",
    color="celltype",
    section="slice_id",  # Section identifier field for section browser
)
🎨 Interactive Controls
Once displayed, the widget provides rich interactive controls for exploring your data:
- Navigate in 3D space (rotate, pan, zoom)
- Switch between annotations and customize colors
- Query continuous values and gene expression
- Filter by thresholds and hide specific categories
- Adjust visualization parameters (size, opacity, layout)
- Export screenshots
🤝 Contributing & Support
Issues and Pull Requests are welcome!
- GitHub: https://github.com/JianYang-Lab/spatial-vista-py
- Documentation: https://spatial-vista-py.readthedocs.io
📄 License
SpatialVista is open-sourced under the MIT License.
Built with ❤️ by WenjieWei@YangLab
Release history Release notifications | RSS feed


Download files
Download the file for your platform. If you're not sure which to choose, learn more about installing packages.
Source Distribution
Built Distribution
Filter files by name, interpreter, ABI, and platform.
If you're not sure about the file name format, learn more about wheel file names.
Copy a direct link to the current filters
File details
Details for the file spatialvista-0.1.1.tar.gz.
File metadata
- Download URL: spatialvista-0.1.1.tar.gz
- Upload date:
- Size: 693.0 kB
- Tags: Source
- Uploaded using Trusted Publishing? No
- Uploaded via: twine/6.2.0 CPython/3.10.16
File hashes
| Algorithm | Hash digest | |
|---|---|---|
| SHA256 |
b2400912ccc0fa154adca37c0be56f014e12ebfc8daab1e78e32bb4f88aceedb
|
|
| MD5 |
e4972277eb866e6e75d78af4cb33df68
|
|
| BLAKE2b-256 |
b1d8c8aa3612047cc109d2b09a4b38d6bddf7882c20a28db4d0515de3d7fe62b
|
File details
Details for the file spatialvista-0.1.1-py3-none-any.whl.
File metadata
- Download URL: spatialvista-0.1.1-py3-none-any.whl
- Upload date:
- Size: 700.7 kB
- Tags: Python 3
- Uploaded using Trusted Publishing? No
- Uploaded via: twine/6.2.0 CPython/3.10.16
File hashes
| Algorithm | Hash digest | |
|---|---|---|
| SHA256 |
1ead02aa7b8d3c952fa069964921e0e57279af265da1be8240dcd5a04d69ec8d
|
|
| MD5 |
7ec3a42eb7201c02b7b42f90f62e99c7
|
|
| BLAKE2b-256 |
dfc42b8d6ea5efeb041b88c2de781c572f6f324111fdaa90ecfb63092b871b6b
|


