
XmR charts with Plotly

Project description
spc_plotly
spc_plotly is a Python helper library for creating XmR Charts according to the theories of Statistical Process Control using the Plotly library.
XmR Charts allow the viewer to quickly identify signals in a data set and ignore routine variation.
Installation
pip install spc-plotly
Usage
from spc_plotly import xmr
import pandas as pd

counts = [
    2478, 2350, 2485, 2296, 2359, 2567, 3089, 2668, 1788, 2854,
    2365, 1883, 1959, 1927, 2640, 2626, 2144, 2409, 4412, 3287,
    3049, 3364, 3078, 2972, 3415, 2753, 3102, 2191, 3693, 4385,
    4699, 3031, 2659, 3885, 2628, 2621, 3071, 2002
]
periods = [
    '2021-01', '2021-02', '2021-03', '2021-04', '2021-05', '2021-06',
    '2021-07', '2021-08', '2021-09', '2021-10', '2021-11', '2021-12',
    '2022-01', '2022-02', '2022-03', '2022-04', '2022-05', '2022-06',
    '2022-07', '2022-08', '2022-09', '2022-10', '2022-11', '2022-12',
    '2023-01', '2023-02', '2023-03', '2023-04', '2023-05', '2023-06',
    '2023-07', '2023-08', '2023-09', '2023-10', '2023-11', '2023-12',
    '2024-01', '2024-02'
]
data = pd.DataFrame({
    "Period": periods,
    "Count": counts
})

xmr_chart = xmr.XmR(
    data=data,
    x_ser_name="Period",
    y_ser_name="Count",
    x_cutoff="2023-06",
    date_part_resolution="month", # This should match your data
    custom_date_part="",
    xmr_function="mean"
)

xmr_chart.mR_limit_values
# {
#   'mR_xmr_func': 571.8918918918919,
#   'mR_upper_limit': 1868.9427027027025,
#   'xmr_func': 'mean'
# }
xmr_chart.npl_limit_values
# {
#   'y_xmr_func': 2820.6315789473683,
#   'npl_upper_limit': 4341.864011379801,
#   'npl_lower_limit': 1299.3991465149359,
#   'xmr_func': 'mean'
# }
xmr_chart.signals
# {'anomalies': [(datetime.datetime(2022, 7, 1, 0, 0), 4412, 'High'),
#   (datetime.datetime(2023, 6, 1, 0, 0), 4385, 'High'),
#   (datetime.datetime(2023, 7, 1, 0, 0), 4699, 'High')],
#  'long_runs': [[('2021-11', 2365, 'Low'),
#    ('2021-12', 1883, 'Low'),
#    ('2022-01', 1959, 'Low'),
#    ('2022-02', 1927, 'Low'),
#    ('2022-03', 2640, 'Low'),
#    ('2022-04', 2626, 'Low'),
#    ('2022-05', 2144, 'Low'),
#    ('2022-06', 2409, 'Low')]],
#  'short_runs': [[('2023-04', 2191, 'High'),
#    ('2023-05', 3693, 'High'),
#    ('2023-06', 4385, 'High'),
#    ('2023-07', 4699, 'High'),
#    ('2023-08', 3031, 'High')],
#   [('2021-11', 2365, 'Low'),
#    ('2021-12', 1883, 'Low'),
#    ('2022-01', 1959, 'Low'),
#    ('2022-02', 1927, 'Low'),
#    ('2022-03', 2640, 'Low')]]}

xmr_chart.xmr_chart
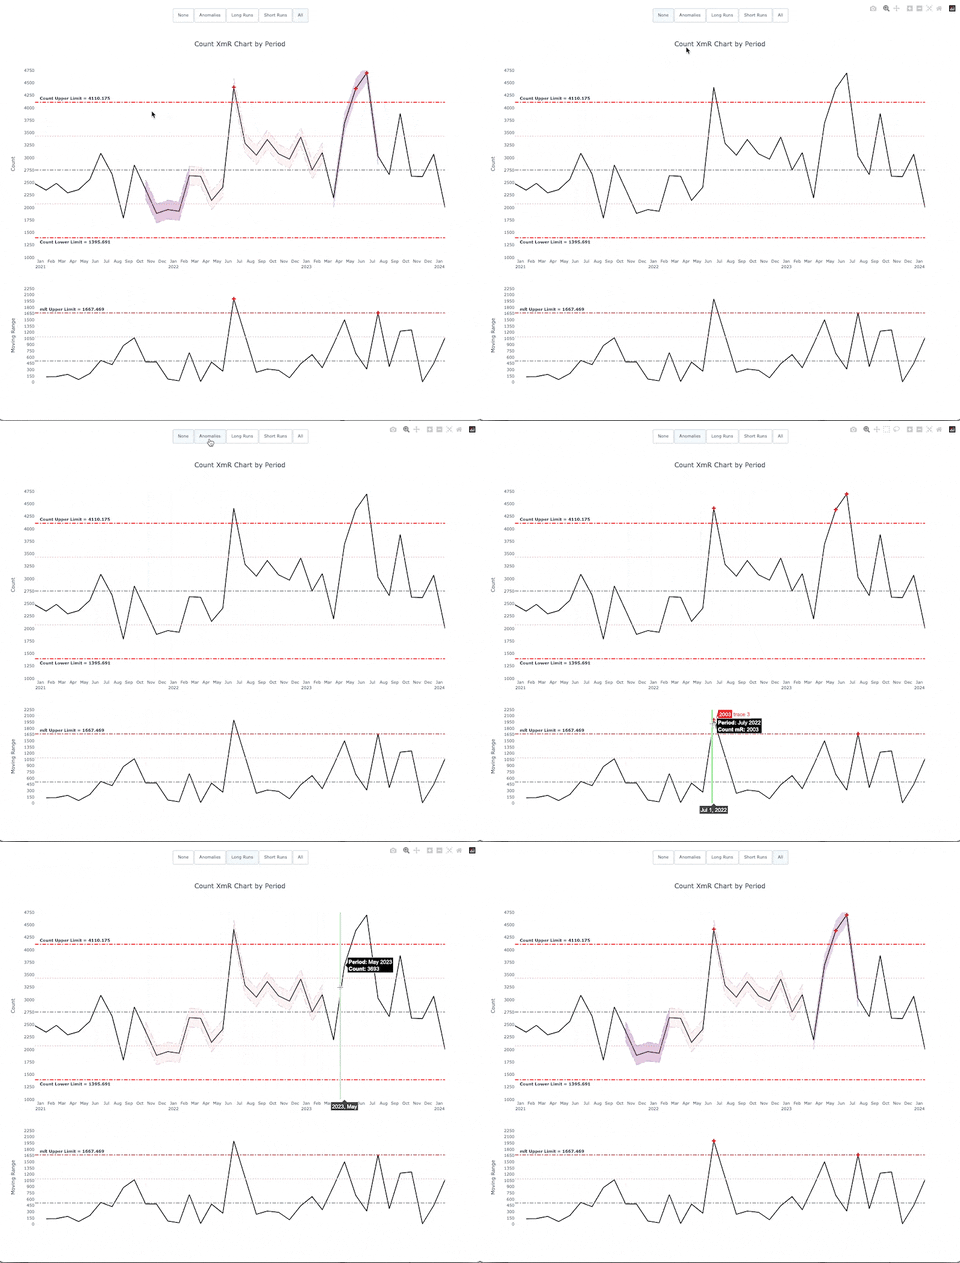
For reference, please read Making Sense of Data by Donald Wheeler and Twenty Things You Need To Know
Sloped Limits
Some data naturally increases over time, e.g., price of some goods. When modeling this data, you should use sloped limit lines to identify signals.
xmr_chart = xmr.XmR(
    data=data,
    x_ser_name="Period",
    y_ser_name="Count",
    x_cutoff="2023-06",
    xmr_function="mean"
    sloped=True
)

Use the Median
If your data contains extreme outliers, you can update the xmr_function parameter to "median"
xmr_chart = xmr.XmR(
    data=data,
    x_ser_name="Period",
    y_ser_name="Count",
    x_cutoff="2023-06",
    xmr_function="median"
    sloped=False
)
Calculate Limits from Subset of Data
If you want to calculate the limits from a subset of your data, use the x_cutoff parameter.
xmr_chart = xmr.XmR(
    data=data,
    x_ser_name="Period",
    y_ser_name="Count",
    x_cutoff="2023-06",
    xmr_function="median"
    sloped=False
)
This will include all data up to, and including, "2023-06". If no value is passed, the limits will be calculated using all data. Currently, this does not support an x_start, so I would recommend filtering the passed-in dataframe to start at the desired period.
Dependencies
Plotly, Pandas, and Numpy


Download files
Download the file for your platform. If you're not sure which to choose, learn more about installing packages.
Source Distribution
File details
Details for the file spc_plotly-0.2.1.tar.gz.
File metadata
- Download URL: spc_plotly-0.2.1.tar.gz
- Upload date:
- Size: 17.0 kB
- Tags: Source
- Uploaded using Trusted Publishing? No
- Uploaded via: twine/5.0.0 CPython/3.10.5
File hashes
| Algorithm | Hash digest | |
|---|---|---|
| SHA256 |
18e2badf239e83b50f9d5230e9b7345b52ea9b7beeb2c438ebfc61770068b485
|
|
| MD5 |
c62ede72e33a7eec7ed4c7d27c493263
|
|
| BLAKE2b-256 |
82056dc65e3cd00e486fdde5bd91f44631b450733c4e32f23fad2781cea3d50c
|






