
specterm1d

A terminal-based viewer for 1D spectra, with IRAF splot's keybindings.
Opens anything specutils can read — IRAF multispec, tabular-fits,
wcs1d-fits, SDSS, HST/COS, HST/STIS, JWST, APOGEE and more — plus pypeit's
OneSpec and spec1d products, including echelle files with their orders
grouped by object.
The point is to keep the splot muscle memory intact while drawing a real
matplotlib figure in the terminal, rather than an ASCII approximation of one.
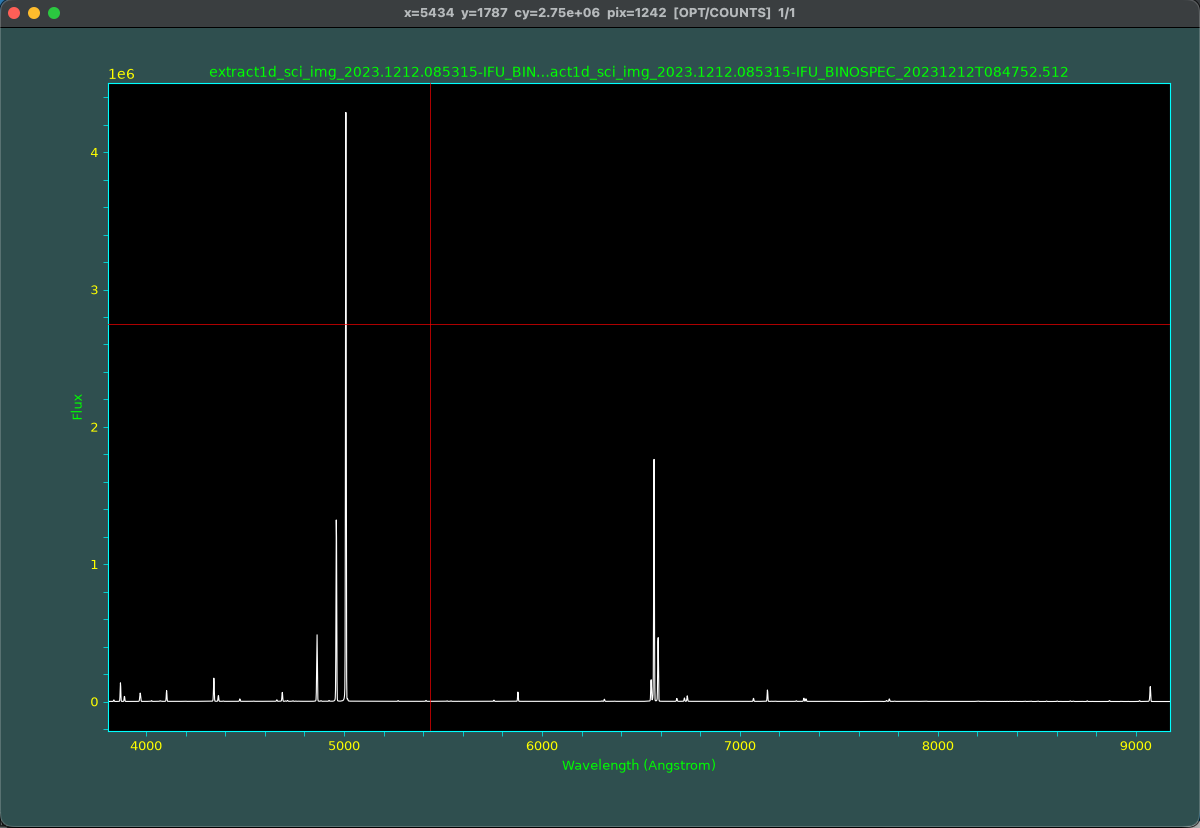
A BINOSPEC IFU extraction in the graphics window. The crosshair is what you
place measurements with; the live x/y/pix readout sits in the title bar,
where your eye already is.
Install
pip install specterm1d                 # general FITS spectra
pip install 'specterm1d[pypeit]'       # adds OneSpec and spec1d support
pip install 'specterm1d[sixel]'        # optional libsixel encoder
pypeit is deliberately optional. Nothing imports it at module scope, so the tool works as a general FITS viewer without it, and files it cannot open are reported clearly rather than crashing on an import.
Requires Python 3.13+ and numpy 2.5+.
Quick start
specterm1d spec1d_J0935+0924.fits # or the short alias: st1d
Arrow keys move a crosshair, ? pages the full keymap, q quits.
| Flag | Effect |
|---|---|
--renderer kitty|iterm2|sixel|gui|text |
force a backend instead of probing |
--theme NAME |
colour theme: xgterm (default), dark (default under text), or a matplotlib style |
--units nm |
start in other dispersion units (um, GHz, anything astropy knows) |
--mouse / --no-mouse |
override click/drag positioning (on for inline graphics) |
--format NAME |
force a loader instead of sniffing the file |
--log FILE |
measurement log path (default splot.log) |
--cursor FILE |
replay a keystroke script instead of reading the keyboard |
--dump OUT.png |
render one frame to a PNG and exit; needs no terminal |
--dump-size WxH |
pixel size for --dump (default 1200x700) |
--debug |
show full tracebacks instead of one-line errors |
Terminal support
One matplotlib figure is rendered to an RGBA buffer, and five interchangeable
backends put those pixels on screen. Axes, tick labels, error bands and fit
overlays therefore look the same everywhere; what changes is the fidelity,
and - for the text backend alone - the palette it opens in.
| Terminal | Backend | Notes |
|---|---|---|
| kitty, Ghostty, WezTerm | kitty graphics | pixel-exact; PNG transport |
| iTerm2 | graphics window | its inline image path leaks; see below |
| Windows Terminal 1.22+, foot, xterm, Konsole, mlterm, contour | sixel | detected via Primary Device Attributes |
| stock macOS Terminal, GNOME Terminal, Alacritty | graphics window | no graphics protocol exists; see below |
| ssh with no display, tmux over ssh | text | always available |
The text backend is first-class, not a stub - it is what runs wherever
neither an inline protocol nor a window is available, and it needs nothing
from the terminal but Unicode and colour. Each cell becomes one of eight
Block Elements glyphs that split it on a 2x2 grid, one group of subpixels
drawn in the foreground colour and the rest in the background, for
2*cols x 2*rows effective pixels. Four subpixels admit eight distinct
splits, so the best one is found by trying all of them. Frames are diffed so
a redraw costs only the cells that changed, and there is an xterm-256 path as
well as truecolor, since Terminal.app never gained 24-bit colour.
Four subpixels sharing two colours is an approximation, and a cheap one here. On a 4097-pixel UVES order in a 116x43 Terminal.app window a screen column carries 18 spectrum pixels; measured against a full-resolution render of the same view, that coarse grid accounts for essentially all of the error (RMS 53.5, against 53.6 for the same grid with exact colour). Two colours per cell is not much of a constraint when a curve over a flat background is two colours already. The glyphs are U+2596..U+259F, Unicode 1.0, present in SF Mono, Menlo and DejaVu Sans Mono.
Even at 2*cols x 2*rows there is no room for matplotlib's own axis
decoration: a 4pt tick label is 5.6 px tall, which is a smear across three
cells at any font size. So the figure is rendered full bleed with nothing but
data, and the terminal paints the spines, tick marks, labels, title and legend
as its own glyphs at your font size. The curve ends up with more pixels than
it had when matplotlib was spending margins on labels nobody could read.
Under tmux, nothing the terminal answers describes the terminal, so specterm1d asks tmux instead.
kitty graphics need allow-passthrough. Add this to ~/.tmux.conf:
set -g allow-passthrough on
Every graphics escape is then wrapped in tmux's DCS passthrough and handed to the terminal outside; without the option tmux discards them and you get a window or the text backend. An unwrapped APC is worse than useless there — tmux eats the introducer and prints the payload into your status line.
Under tmux the mouse is coarse, and the arrow keys are not. tmux has no
SGR-Pixels mouse mode — asked about DECSET 1016 it answers "never heard of
it" — so it reports the pointer in whole cells, and a click lands on a cell
boundary rather than where you aimed. This matters for anything you place by
eye: a continuum level for a gaussian fit, the edges of an equivalent-width
region. Click to get close, then nudge with the arrow keys, which move
the crosshair by 0.2% of the visible range (5% with shift) and are far finer
than a cell. --gui is the way out if you want true pixel pointing under
tmux; the graphics window has its own mouse and tmux is not in the way of it.
Expect some flicker as well. Each frame is a few hundred KB of base64 that tmux parses and re-emits in 4 KB pieces, interleaved with its own screen updates. tmux also does not know an image is present, so a pane repaint (a resize, a pane switch, leaving copy mode) blanks the plot until the next keystroke redraws it.
The sixel bit in the Device Attributes reply describes tmux, which
answers it whenever tmux was built with --enable-sixel, with no client
attached at all. So it is checked against what tmux says its client can do
(#{client_termfeatures}). Otherwise you get the placeholder tmux draws for
an image it cannot pass on — SIXEL IMAGE (134x44) padded out with + until
it fills the window — instead of a plot.
--renderer kitty or --renderer sixel forces the issue where the probe is
too cautious. Naming a backend also stops the graphics probes being sent at
all - nothing but the choice of renderer reads them - which keeps the screen
clean on a terminal that prints an unrecognised query instead of swallowing
it. Stock Terminal.app is one: it answers a kitty graphics probe with the
probe.
Two-window mode
Terminals with no inline-graphics protocol get a real matplotlib window
instead of block glyphs. This is what IRAF splot did on a
Tektronix-emulating terminal like xgterm: you point at a feature in the
graphics window and press a key, while prompts and measurement results
scroll past in the text terminal.
The terminal is a plain scrolling transcript in this mode — no full-screen
layout, no raw mode, no pinned status line. The live x/y/pix readout
moves to the window title, where your eye already is. ? and :show scroll
past rather than paging.
Every binding means the same thing in both modes; that is the point.
| terminal | renderer |
|---|---|
| kitty, Ghostty, WezTerm | kitty protocol, inline |
| iTerm2 | graphics window (--renderer iterm2 to force inline) |
| xterm with sixel | sixel, inline |
| Terminal.app, GNOME Terminal, Alacritty | graphics window |
| xterm on Linux with X11 | graphics window |
| ssh with no display, tmux over ssh | text |
Inline graphics still win where the terminal supports them — one window beats two — with iTerm2 the one exception. The text backend is the last resort: correct everywhere, comfortable nowhere.
Why iTerm2 gets a window
iTerm2 never frees an inline image. Every distinct frame costs it about a
decoded bitmap of resident memory for the life of the session, so panning a
spectrum grows the terminal process by roughly 1.7 MB per keystroke — measured
over 100 cursor moves on iTerm2 3.6.11, against 0.05 MB/frame for the same
loop drawing text. kitty's protocol replaces a placement in situ through a
stable image id and does not do this; OSC 1337 has neither an id nor a delete
verb, and nothing the application can send collects the images. Its sixel path
leaks too, at 4 MB/frame, so both inline backends step aside where a window is
available. --renderer iterm2 still forces the inline path.
This is not specific to specterm1d. It has been reported upstream twice — #3943 in 2015 and #10420 in 2022, the latter reaching about 20 GB and surviving a scrollback clear and a session close — and closed both times. The behaviour is still present in 3.6.11, and has driven a machine into the OOM killer at 138 GB. There is no open upstream issue to wait on, so the window is where iTerm2 stays.
To force either mode:
specterm1d --gui spec1d.fits              # or --renderer gui
specterm1d --renderer text spec1d.fits
The window opens at 1200x800 and is then yours to resize; resizing re-renders
at the new size. If no window can be opened — no DISPLAY, no usable
toolkit — specterm1d prints one line to stderr and falls back to the text
backend rather than refusing to start.
Keys
The complete reference is in the key and command reference. The most-used:
| Key | Action |
|---|---|
<space> |
report the cursor position and nearest pixel |
a |
expand between two marks; the same point twice autoscales everything |
c / r |
clear all windowing / redraw keeping it |
z , . |
zoom by two about the cursor; pan left; pan right |
( ) # |
previous / next spectrum; go to one by index or name |
e |
equivalent width by summation |
m |
mean, RMS and S/N over a region |
k + g/l/v |
fit a gaussian, lorentzian or voigt profile |
h + a/b/c/l/r/k |
equivalent width from a measured width |
s |
boxcar smooth |
U |
undo the last transform |
w |
the gtools window submode |
: |
colon commands (:units nm, :sigma, :sky, :mask, …) |
q |
next input spectrum, then exit |
Multi-point commands are explicit: press the command key to arm it, then mark
each point with <space>. The crosshair's y matters — e, k and h
take their continuum from the cursor's y at each marked point, which is what
IRAF's sumflux.x does with eqy1/eqy2.
Colours
The default palette is xgterm's, because that is the window splot was read in for thirty years: a cyan box on black, yellow numbers, green captions, and a white spectrum on a DarkSlateGray surround. It is high contrast by design - these are the X11 primaries, chosen to stay legible on a CRT across a room.
specterm1d --theme dark spec.fits        # blue on charcoal; the pre-1.0 look
specterm1d --theme ggplot spec.fits      # or any matplotlib style name
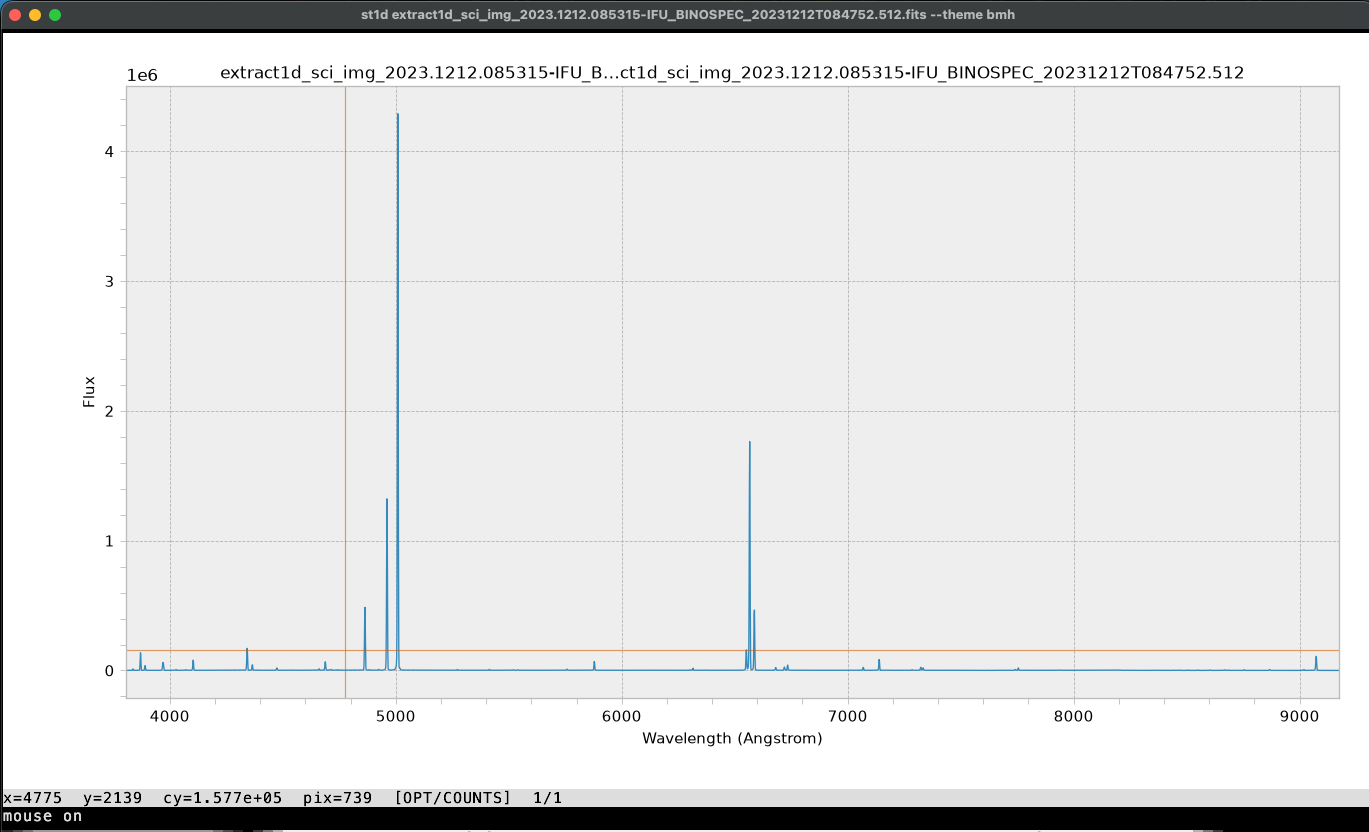
The same extraction under --theme bmh. A matplotlib style brings its grid
across as well as its colours - the dashed rules here, drawn under the
spectrum.
The text backend is the exception: it defaults to dark. Its decoration is
terminal text around a plot of 2x2 block glyphs, and xgterm's palette asks
more of that than it can give - three inks around the box, and a slate
surround meeting a black plot on a seam the quantizer has to resolve. dark
is one foreground on one ground, which is the same simplification the backend
already is. --theme xgterm overrides it, as an explicit --theme overrides
any default.
A theme names colours by role, and every backend honours all of them: the
matplotlib figure, the terminal-drawn chrome of the text backend, and the
sixel palette, which is derived from the active theme rather than fixed.
| Role | xgterm | What it draws |
|---|---|---|
figure |
DarkSlateGray | around the box - and the ground the text chrome sits on |
plot |
black | inside the box |
spine |
cyan | spines, tick marks, the │ └ ┬ ┤ glyphs |
tick_label |
yellow | the numbers on the axes |
text |
green | title, axis labels, legend |
line |
white | the spectrum |
sigma |
light blue | the error band |
mask / fit |
red / magenta | masked columns, fitted profiles |
cursor |
red | crosshair and markers |
overlay |
yellow, coral, magenta | overlay arrays |
grid |
none | rules across the plot, where a matplotlib style asks for them |
--dump and --cursor keep xgterm whichever backend they borrow. What they
write is a full matplotlib figure, so tying its palette to a renderer picked
for needing no terminal would leave a dumped PNG disagreeing with the window
showing the same data.
--theme also accepts any name in matplotlib.style.available - ggplot,
dark_background, Solarize_Light2, tableau-colorblind10 and the rest.
Misspell one and the error lists the full set. A style's colours and its
grid come across; its fonts, line widths and padding do not, because those
are tuned here against the terminal's pixel budget, where a stylesheet written
for a page would put a 12 pt label on an 86 px figure. The grid keeps the
style's own colour, dashes, weight and stacking order - ggplot without its
white rules is not ggplot - with one exception: under the text backend the
terminal draws the tick marks from tick values of its own, and a grid ruled
anywhere but on them would read as a fault rather than a style. The roles a
stylesheet has no opinion about are derived from the ones it does - the error
band is the line blended halfway into the plot background, and the mask takes
the warmest colour in the style's property cycle.
There is no per-role override on the command line. A script that wants one builds the theme itself - roles are ordinary dataclass fields:
from dataclasses import replace

from specterm1d import theme

theme.use(replace(theme.XGTERM, name="mine", line="#ffff00"))
Not implemented yet
These keys are registered and report "not implemented in v1" when pressed. They are never silently absent and never rebound to something else, so muscle memory cannot misfire:
d deblend · t ICFIT · f arithmetic · i write to file ·
j set pixel to cursor · x etch-a-sketch · p linear wavelength scale ·
u user coordinate scale · y standard-star overplot
Differences from splot
Three, stated plainly:
- The cursor is always keyboard-driven and optionally mouse-driven. Arrow
keys move a 2D crosshair by 0.2% of the visible range, 5% with shift.
Inline Kitty, sixel and iTerm2 graphics enable click/drag positioning and
draw the full crosshair by default. Terminals that answer DECRQM for DECSET
1016 - kitty, ghostty and the sixel terminals among them - report the
pointer in pixels rather than cells, so the cursor tracks it instead of
snapping to the character grid. Terminals that do not, and tmux, which
has no pixel mouse mode at all, keep cell coordinates: click to get
close and then nudge with the arrows, which are finer than a cell. The
text backend leaves mouse reporting off, having no pixels to place. Use
--no-mouseor:mouse nowhen you want the terminal's normal text selection instead. %cycles the extraction/calibration variant (OPT/COUNTS,BOX/COUNTS,OPT/FLAM, …) rather than an image band, which is the useful analogue for pypeit products.Uundoes a transform.splothas no equivalent: there,sis destructive with no recovery short of reloading the file.
Beyond that, four display features splot had no data for: a one-sigma error
band (:sigma), masked-pixel highlighting (:mask), sky/telluric/model
overlays (:sky, :telluric, :model), and inverse-variance weighting of
profile fits.
Measurement log
Measurements append to splot.log in IRAF's own column formats, taken from
anshdr.x, eqwidth.x, gfit.x and avgsnr.x — including the detail that
the m key suppresses the column header. Existing log-parsing scripts keep
working:
    center      cont      flux       eqw      core     gfwhm     lfwhm
    5183.6     1.234    -0.456      0.37
avg:        1.5  rms:       0.25   snr:     6.00
:nolog stops writing, :log resumes, and :# some text adds a comment.
Batch use
--cursor replays a keystroke script, reproducing splot's cursor
parameter. Combined with --dump it runs with no terminal at all:
cat > measure.txt <<'EOF'
5200 1.0 e
5200 1.0 <space>
5400 1.0 <space>
EOF

specterm1d spec.fits --cursor measure.txt --log out.log --dump frame.png
Licence
BSD-3-Clause.
1 maintainer

Download files
Download the file for your platform. If you're not sure which to choose, learn more about installing packages.
Source Distribution
Built Distribution
Filter files by name, interpreter, ABI, and platform.
If you're not sure about the file name format, learn more about wheel file names.
Copy a direct link to the current filters
File details
Details for the file specterm1d-0.2.0.tar.gz.
File metadata
- Download URL: specterm1d-0.2.0.tar.gz
- Upload date:
- Size: 415.4 kB
- Tags: Source
- Uploaded using Trusted Publishing? Yes
- Uploaded via:
twine/7.0.0 CPython/3.13.14
File hashes
| Algorithm | Hash digest | |
|---|---|---|
| SHA256 |
3b3862f008d9e381ca2bc56439cb196dfa8f515914ea793f8e10bddc0ebda139
|
|
| MD5 |
8aaf0a2245311450b866698ae4d6824b
|
|
| BLAKE2b-256 |
650efab3e83b9520b374dd8d663e9d20a24caedc720fd312d3fc310c0b642c46
|
Provenance
The following attestation bundles were made for specterm1d-0.2.0.tar.gz:
Publisher:
release.yml on tepickering/specterm1d
-
Statement:
-
Statement type:
https://in-toto.io/Statement/v1 -
Predicate type:
https://docs.pypi.org/attestations/publish/v1 -
Subject name:
specterm1d-0.2.0.tar.gz -
Subject digest:
3b3862f008d9e381ca2bc56439cb196dfa8f515914ea793f8e10bddc0ebda139 - Sigstore transparency entry: 2681009353
- Sigstore integration time:
-
Permalink:
tepickering/specterm1d@929792ba0f3cb78ac655a6529e3c78da72768d04 -
Branch / Tag:
refs/tags/v0.2.0 - Owner: https://github.com/tepickering
-
Access:
public
-
Token Issuer:
https://token.actions.githubusercontent.com -
Runner Environment:
github-hosted -
Publication workflow:
release.yml@929792ba0f3cb78ac655a6529e3c78da72768d04 -
Trigger Event:
push
-
Statement type:
File details
Details for the file specterm1d-0.2.0-py3-none-any.whl.
File metadata
- Download URL: specterm1d-0.2.0-py3-none-any.whl
- Upload date:
- Size: 89.8 kB
- Tags: Python 3
- Uploaded using Trusted Publishing? Yes
- Uploaded via:
twine/7.0.0 CPython/3.13.14
File hashes
| Algorithm | Hash digest | |
|---|---|---|
| SHA256 |
085ecd9f75de2aec11f4a4c8e9efa65f5b40bbc4e927a7821583ff9f633b30de
|
|
| MD5 |
8140ee8a7ea8b489b1c6dcb5da7e0ded
|
|
| BLAKE2b-256 |
b841c194ec2ffe71c6c7f1b92e5f442a7018577043e68a16c317edaaac392393
|
Provenance
The following attestation bundles were made for specterm1d-0.2.0-py3-none-any.whl:
Publisher:
release.yml on tepickering/specterm1d
-
Statement:
-
Statement type:
https://in-toto.io/Statement/v1 -
Predicate type:
https://docs.pypi.org/attestations/publish/v1 -
Subject name:
specterm1d-0.2.0-py3-none-any.whl -
Subject digest:
085ecd9f75de2aec11f4a4c8e9efa65f5b40bbc4e927a7821583ff9f633b30de - Sigstore transparency entry: 2681009499
- Sigstore integration time:
-
Permalink:
tepickering/specterm1d@929792ba0f3cb78ac655a6529e3c78da72768d04 -
Branch / Tag:
refs/tags/v0.2.0 - Owner: https://github.com/tepickering
-
Access:
public
-
Token Issuer:
https://token.actions.githubusercontent.com -
Runner Environment:
github-hosted -
Publication workflow:
release.yml@929792ba0f3cb78ac655a6529e3c78da72768d04 -
Trigger Event:
push
-
Statement type:














