
spectral-forensics



Is that FLAC actually a re-wrapped mp3? Every lossy encoder throws away everything above a cutoff, and that cliff survives conversion back into a lossless container. This scans a whole library and tells you which files to look at — and it says out loud what it cannot catch.
→ Try it in your browser — drop a file in for the verdict and its spectrogram, STFT or reassigned. Nothing is uploaded.
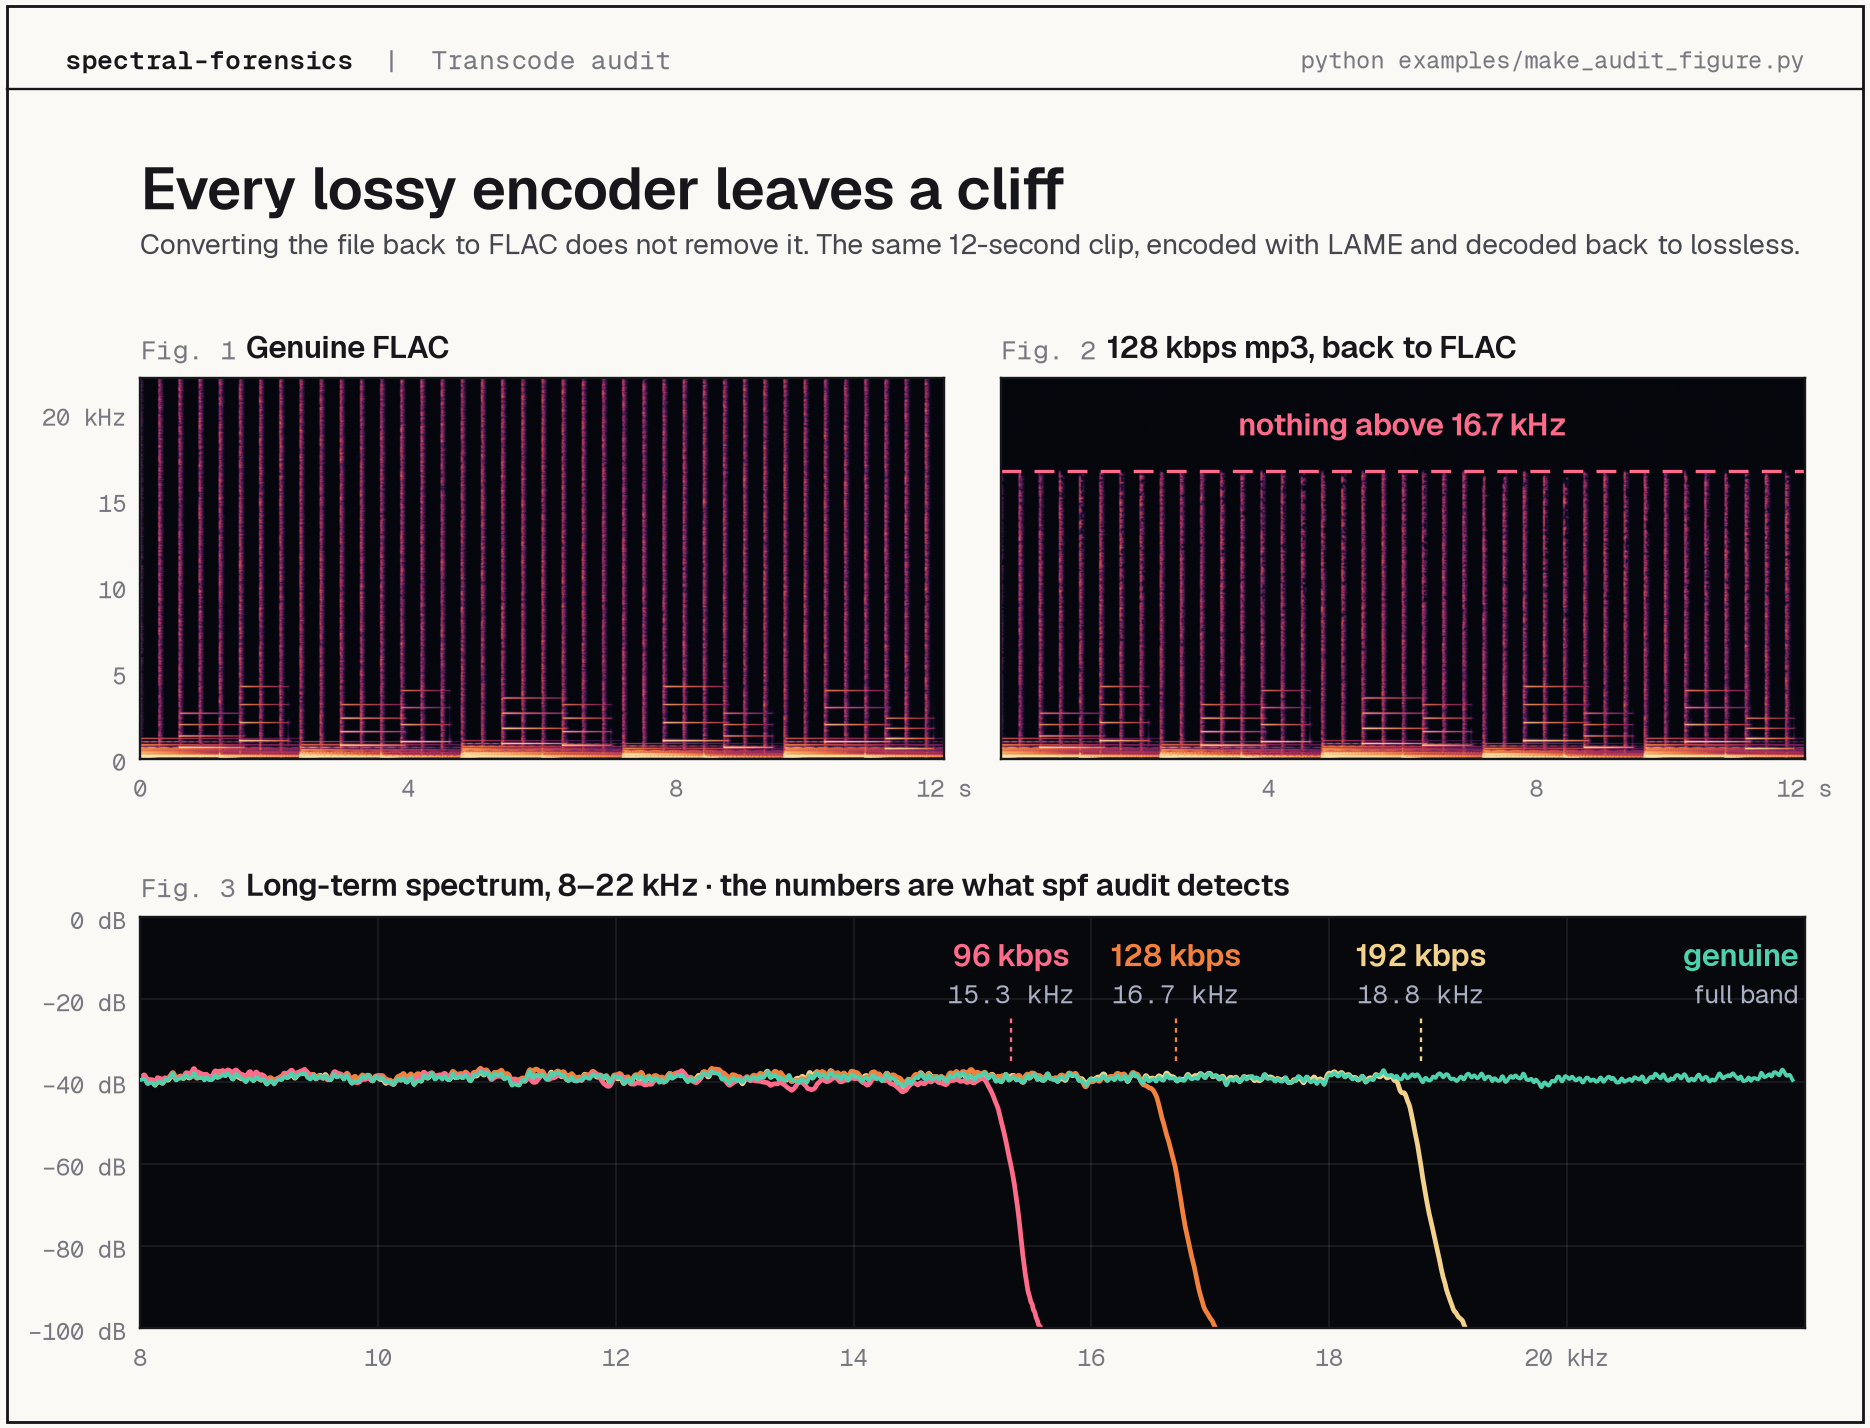
Top: the same 12-second clip as a genuine FLAC and after a 128 kbps mp3
round trip. Everything above 16.7 kHz is gone, and converting back to FLAC
does not bring it back. Bottom: the clip encoded with LAME at 96, 128 and
192 kbps, then decoded back to FLAC. Below each cutoff the curves cannot be
told apart from the genuine one; above it, each encoder's brick wall stands
where spf audit says it does. Rebuild it with
python examples/make_audit_figure.py (needs ffmpeg with libmp3lame).
That detector is one of four things built on the same spectral machinery. The other three: editing sound in the frequency domain and inverting back to a waveform, sharpening a spectrogram past the time–frequency uncertainty limit, and rendering posters and spectrum video.
Install
pip install spectral-forensics
Python 3.11 or newer. Installs as spf (or the full spectral-forensics).
ffmpeg is optional — it is needed for video output and for decoding some
mp3/m4a files. Check what you have:
spf check
From source, if you want the examples and tests:
git clone https://github.com/shianjeng/spectral-forensics.git
cd spectral-forensics
python3 -m venv .venv && source .venv/bin/activate
pip install -e ".[dev]"
python examples/make_demo_audio.py      # the demo track used below
What it does
| Command | Purpose |
|---|---|
audit |
Detect lossy transcodes across a music library |
edit |
Edit in the frequency domain, reconstruct with the original phase |
sonify |
Encode an image into a spectrum and resynthesise it as audio |
reassign |
Reassigned spectrogram — resolution beyond Δt·Δf ≥ 1 |
poster |
Static sonogram (STFT / mel / CQT) |
video |
Spectrum video with the original audio muxed in |
compare |
Side-by-side window-length comparison |
check |
Report the environment: Python version, ffmpeg, which features work |
1. Is it really lossless?
spf audit ~/Music --recursive --verbose
✓ 01 - genuine.flac         cut= 22.1k
⚠ 02 - suspicious.flac      cut= 16.0k   90%  → mp3 ~128 kbps
? 03 - borderline.flac      cut= 18.8k   55%  → mp3 ~192 kbps
· 04 - honest.mp3           cut= 16.0k
Try it without installing anything
shianjeng.github.io/spectral-forensics runs the same cutoff, steepness and intensity-stereo tests in the browser using the Web Audio API. The file is decoded and analysed locally and never leaves the machine.
Below the verdict sits the spectrogram, where an mp3's lowpass is visible as a flat ceiling. It is STFT or reassigned (section 3), with 512 / 2048 / 8192-sample windows, a log or linear frequency axis, the four palettes, an adjustable dynamic range and the detected cutoff marked. Hover over it to read time, frequency and level. Click to play from that point.
With nothing loaded the page sits at zero: the verdict reads "No audio", the figures are dashes, and both plots show empty axes. Drop a file, or pick one of three examples: a clip after a 128 kbps mp3 round trip, the genuine FLAC it was encoded from, and a synthetic sweep with tones and clicks for comparing window lengths. Each is decoded once, so switching back is instant, and Clear returns the page to zero. The long-term spectrum overlays the genuine FLAC as a green reference line. On the mp3 example the two curves coincide up to 16.7 kHz and then only one of them carries on, which is the whole argument in one picture. Hover over it to read both levels at any frequency. Drag across it to zoom into a band, or drag a box to zoom both axes; double-click resets, and Near the cutoff jumps straight to the cliff. The level axis fits whatever is in view, so no curve is clipped, and the handle underneath resizes the plot.
Drop several files, or a whole folder, and the page audits them one after
another into a table: verdict, cutoff, the encoder setting that cutoff
implies, and how much was analysed. Only suspect & likely hides the rest,
Export CSV saves the table under the same field names as
spf audit --json, and clicking a row opens its full report and spectrogram
underneath. Nothing is uploaded here either, though for a library of
thousands of files the command line is faster.
Every example has its own link:
?sample=mp3,
?sample=genuine,
?sample=synth.
The page is in English, Chinese and Japanese (?lang=en, zh or ja). Its
fonts are served from the repository, so apart from GitHub Pages itself it
makes no network requests at all.
The JavaScript is held to the Python, not just modelled on it.
tests/test_web_parity.py feeds identical signals to both, asserts they land
on the same FFT bin and reach the same verdict on the bundled samples.
tests/test_web_spectrogram.py checks the STFT bin for bin against
librosa.stft, and each reassigned point against
librosa.reassigned_spectrogram. The samples are rebuilt with
python examples/make_web_samples.py.
Porting it paid for itself immediately: the JavaScript version disagreed with
Python on a 16 kHz brick wall, and Python was the one that was wrong.
librosa.stft pads both ends by default, and the step at the padding boundary
is broadband, so the first and last frames have a full spectrum. On short
clips those two frames carry enough weight in the 95th percentile to hide the
cutoff entirely. Passing center=False fixed it and made the result
independent of clip length.
Three independent pieces of evidence, because any one alone produces false positives — old recordings and solo acoustic material genuinely lack high frequencies:
- Cutoff frequency — the highest frequency still carrying real energy, from a 95th-percentile long-term spectrum. A percentile rather than a mean, because quiet passages drag the mean into the noise floor, while a plain maximum chases single transients.
- Steepness — how much further the level falls within 1 kHz above the cutoff. An encoder's brick wall drops 20 dB or more; natural rolloff does not.
- Intensity stereo — lossy codecs collapse L/R into mono-plus-weight at
high frequencies, so the side signal
(L−R)/2vanishes above some frequency. Independent of the lowpass, and hard to fake.
Verdicts come in three tiers: ⚠ suspect (a lowpass and a brick wall,
usually landing on a known encoder cutoff), ? likely (a lowpass with no
corroborating evidence), and ✓ clean. The middle tier exists so that
genuinely dull recordings are flagged for a listen rather than accused.
It also catches the reverse: an mp3 declaring 320 kbps whose spectrum only supports 128 kbps was re-encoded from a low-bitrate source.
Validation
Ground truth built with ffmpeg — one source encoded at several cutoffs, then converted back to FLAC:
| File | True cutoff | Detected | Verdict |
|---|---|---|---|
original.wav |
none | 22.1 kHz | ✓ clean |
genuine.flac |
none | 22.1 kHz | ✓ clean |
cut_15000.flac |
15.0 kHz | 15.3 kHz | ⚠ → ~112 kbps |
cut_16000.flac |
16.0 kHz | 16.0 kHz | ⚠ → ~128 kbps |
cut_17500.flac |
17.5 kHz | 17.4 kHz | ⚠ → ~160 kbps |
cut_19000.flac |
19.0 kHz | 18.8 kHz | ⚠ → ~192 kbps |
Compared with existing tools
Spek draws you a spectrogram and leaves the judgement to you — excellent for a single file, useless for a library of forty thousand. fakin' the funk?! automates the judgement but is closed-source and Windows-only. This project gives you an open-source CLI that scans a whole tree, reports the implied bitrate, exports a shareable HTML report, and — the part most tools skip — states its own failure modes.
Batch reports
spf audit ~/Music --recursive --html report.html
A single self-contained HTML file: every flagged track gets its own long-term spectrum with the detected cutoff marked, so the evidence travels with the verdict instead of scrolling out of a terminal.
The 20 kHz problem
A steep rolloff is not proof of compression. Mastering chains and some ADC anti-aliasing filters lowpass the signal too, and one of the places they do it is around 20 kHz — which is also where LAME puts the cutoff at 320 kbps. In the frequency domain those two are the same picture.
Measured on synthetic lossless files with a brick wall at various frequencies:
| Lowpass | Verdict |
|---|---|
| 21.5 kHz | ✓ clean |
| 21.0 kHz | ✓ clean |
| 20.5 kHz | ? likely |
| 20.0 kHz | ? likely |
| 19.0 kHz | ⚠ suspect |
| 16.0 kHz | ⚠ suspect |
Two rules keep this honest. Anything within 1.2 kHz of Nyquist counts as full
band, so an ADC filter at 21 kHz never scores at all. And between 19.8 and 21.6
kHz the "lands on a known encoder cutoff" bonus is withheld and the verdict is
capped at likely unless something independent of the lowpass — intensity
stereo — corroborates it. The ground-truth table above is unchanged by these
rules: every genuinely transcoded file is still caught.
Credit for the question goes to a reader who pointed out that ADCs brickwall too. They were right that the reasoning needed stating; the specific case they raised (21 kHz) was already handled, and looking into it found the real gap at 20 kHz.
Known limitation
Encoders that apply no hard lowpass — ffmpeg's native AAC at higher
bitrates, Opus — slip past the cutoff test, and in a bench run the tool
called such a file clean. The lowpass-independent test currently shipped
(intensity stereo) does not help for mono material. Spectral-hole and
MDCT-periodicity detectors were prototyped and did not separate the classes
on the test material, so they are not shipped. Read a ✓ as "no lowpass
evidence", not as proof of provenance.
2. Invertible editing
The spectrogram stops being the end of the pipeline and becomes an editable medium. Two reconstruction paths, for two different situations:
Phase-preserving (edit) — only the magnitude is changed, the original
phase is kept, and the inverse STFT runs directly. Every masking operation
goes this way. With an identity mask the round trip is exact to within
numerical precision:
||y' − y|| / ||y|| = 1.3e-08 (−158 dB)
spf edit track.wav --reject 2000:4000          # drop a band
spf edit track.wav --keep 80:250               # isolate the bass
spf edit track.wav --denoise
spf edit track.wav --mask painted.png          # paint in any image editor
Band rejection measured on a three-tone mixture: target band down more than 30 dB, neighbouring bands within 5 % of their original energy.
Denoising is spectral gating with a minimum-statistics noise floor — for each frequency bin, a low percentile across the whole file, on the assumption that every bin falls quiet at some point. Honest numbers on a noisy version of the demo track:
| Input SNR | After | Δ |
|---|---|---|
| 17.0 dB | 16.9 dB | −0.2 |
| 9.1 dB | 11.8 dB | +2.7 |
| 3.1 dB | 6.5 dB | +3.4 |
It helps when there is real noise and mildly hurts when there is not — the gate's own distortion outweighs what it removes. Stationary material (a tone that never stops) breaks the minimum-statistics assumption outright, since the tone estimates itself as the noise floor; pass an explicit noise region instead.
Griffin-Lim (sonify) — when the magnitude is invented, no phase exists
to keep. Griffin-Lim alternates projections between "is a real signal" and
"has this magnitude" until a self-consistent phase falls out. It only
converges to a local solution, so a metallic quality is inherent, not a bug.
spf sonify photo.jpg --preview roundtrip.png

Input: an ordinary greyscale picture.
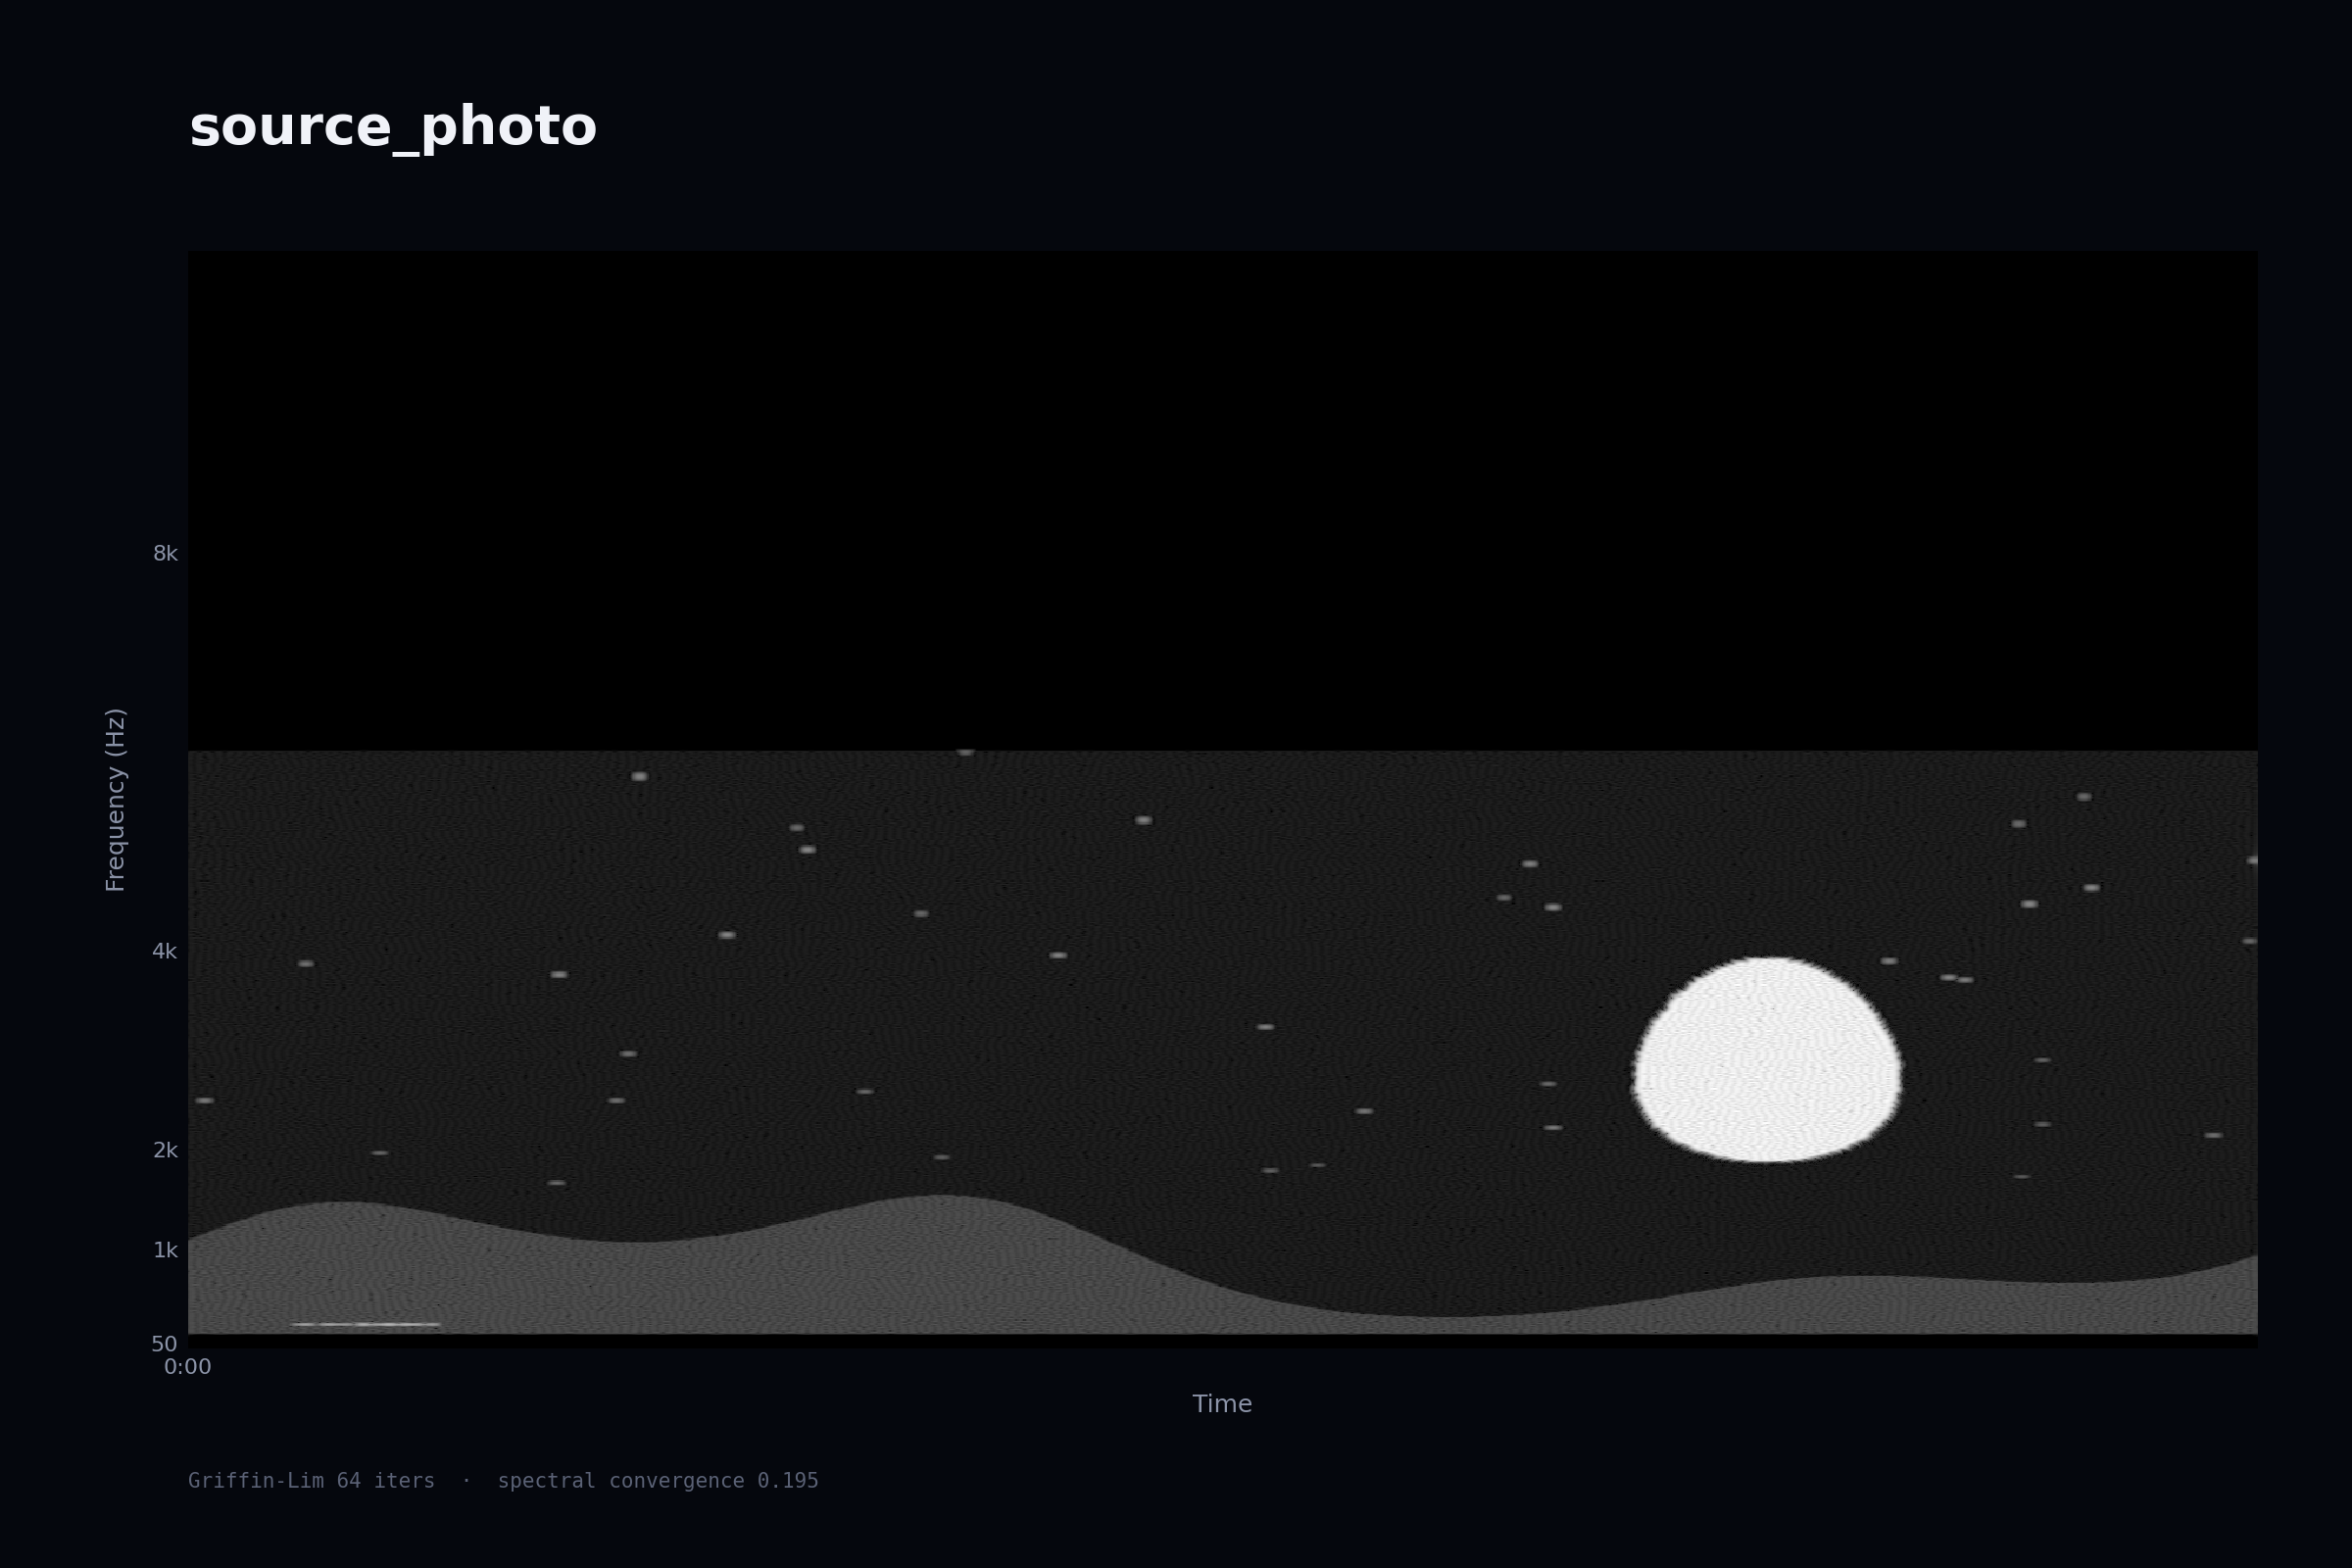
Output, round-tripped: the picture encoded as a magnitude spectrum, resynthesised into a 10-second wav, then re-analysed from the audio alone. The ridge, moon and stars survive the trip. Spectral convergence falls 0.345 → 0.241 → 0.207 → 0.196 at 1 / 8 / 32 / 64 iterations.
3. Reassigned spectrogram
A pure tone always draws as a band in a normal spectrogram. That width is imposed by the window, not by the signal — a direct consequence of
Δt = n_fft / sr Δf = sr / n_fft Δt · Δf = 1
But an STFT bin carries more than a magnitude: it carries a phase. Taking partial derivatives of that phase recovers where the energy inside the bin actually sits:
instantaneous frequency   ω̂ = ω − ∂φ/∂t
group delay               t̂ = t + ∂φ/∂ω
Move each bin's energy from its cell to (t̂, ω̂) and the picture becomes
sharper than the uncertainty bound. This is not a violation: the bound
constrains the width of a single time–frequency atom, not the precision
with which you can estimate the location of its energy — the same
distinction that lets centroid localisation beat the diffraction limit in
microscopy.
spf reassign track.flac --hop 256 --side-by-side
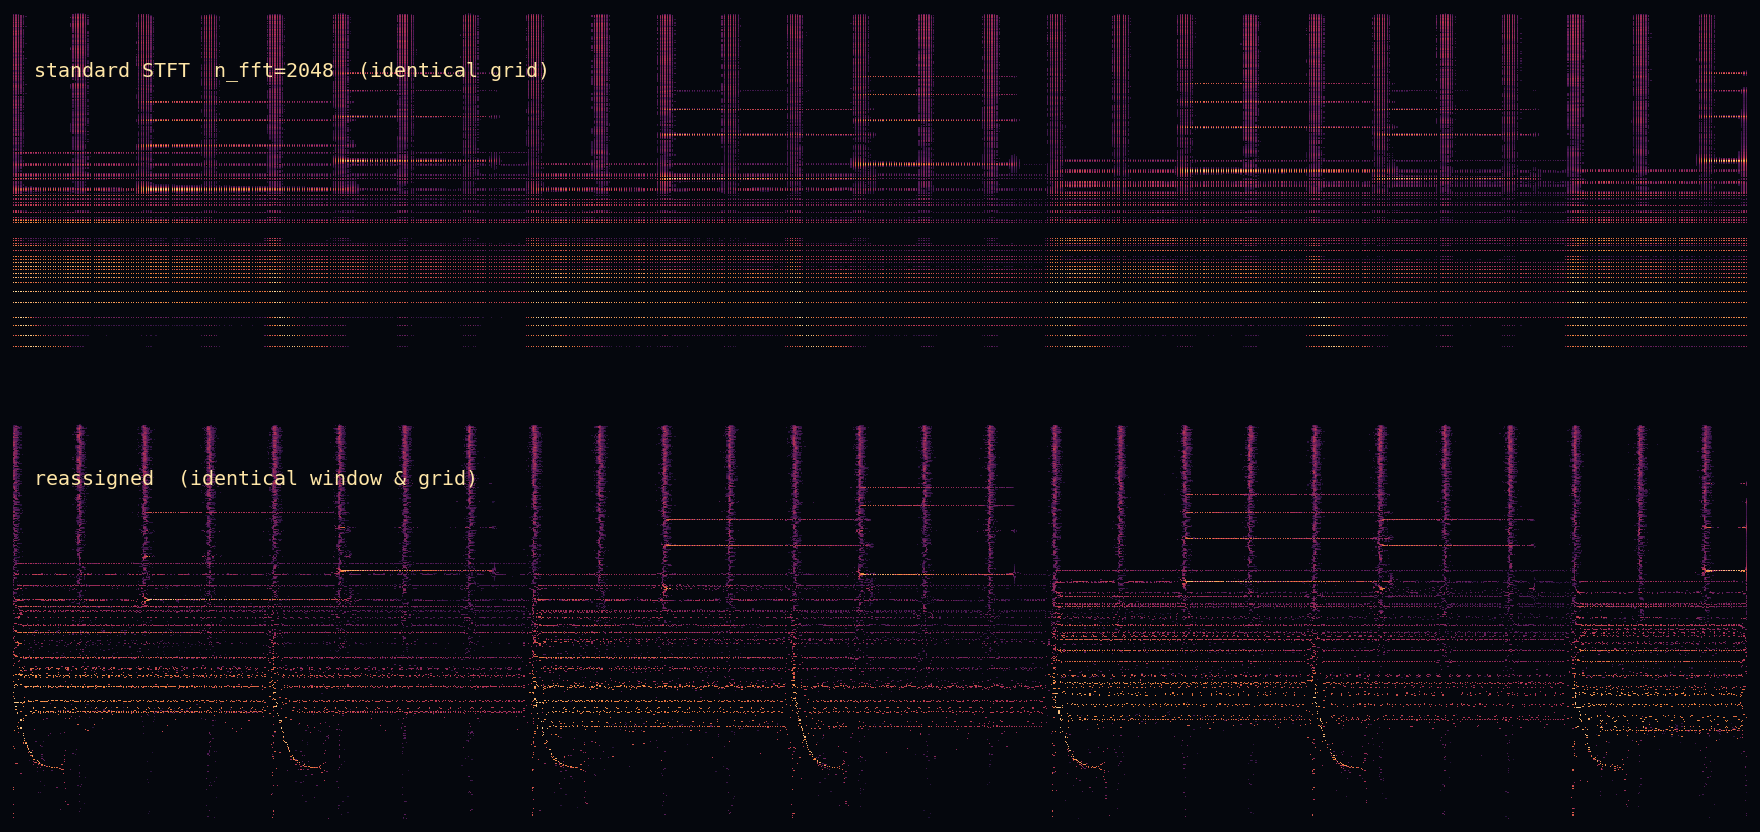
Same audio, same window, same grid. Top: conventional STFT. Bottom: after reassignment. The harmonics collapse to hairlines and the kick drum's pitch glide — invisible above — becomes a readable curve.
sharpness (spectral concentration): standard 5.116 → reassigned 5.389
A test states the claim numerically rather than leaving it to the eye: for a
1 kHz tone with n_fft=2048 at 22.05 kHz (Δf = 10.8 Hz), the
magnitude-weighted spread of reassigned frequency estimates stays under one
FFT bin.
Where it fails: reassignment relies on the phase derivative being
meaningful, so overlapping partials and low-SNR regions scatter. Anything
below --mag-top-db is discarded rather than plotted as noise.
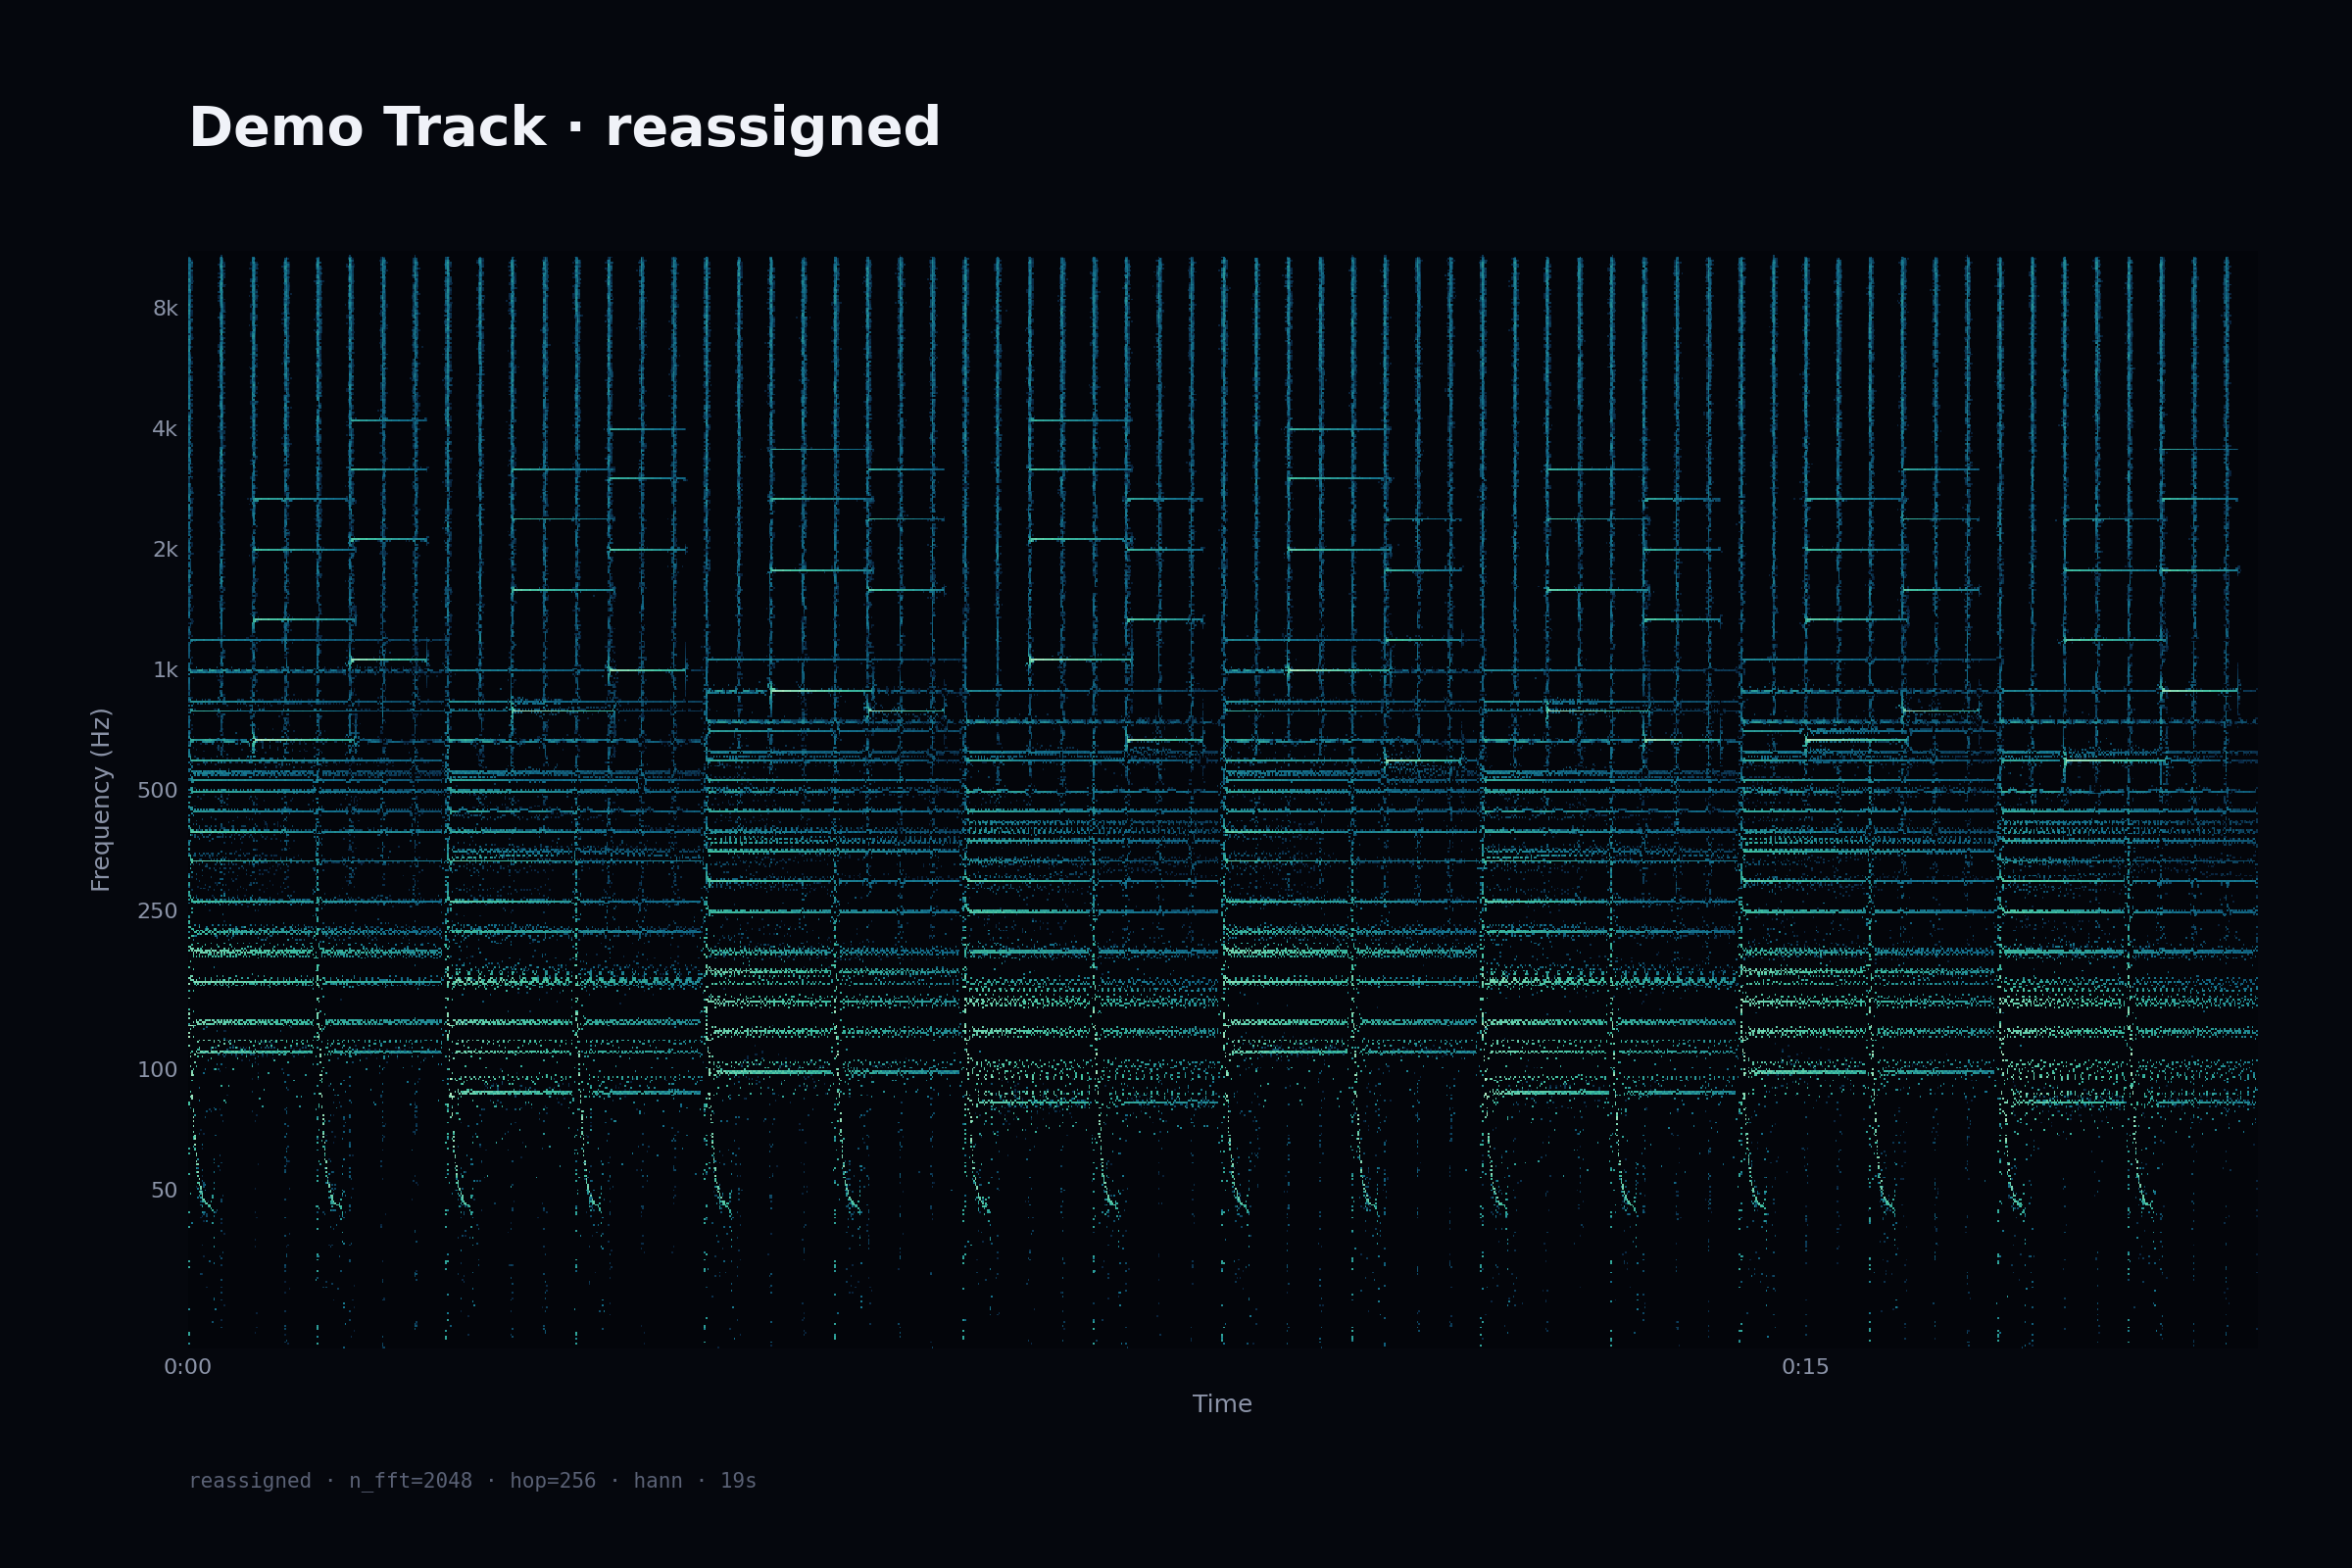
4. Posters, video, window comparison
spf poster  track.mp3 --transform cqt --palette bloom
spf video   track.mp3 --size 1920x1080 --fps 30 --bars 128
spf compare track.mp3 --n-ffts 512,2048,8192
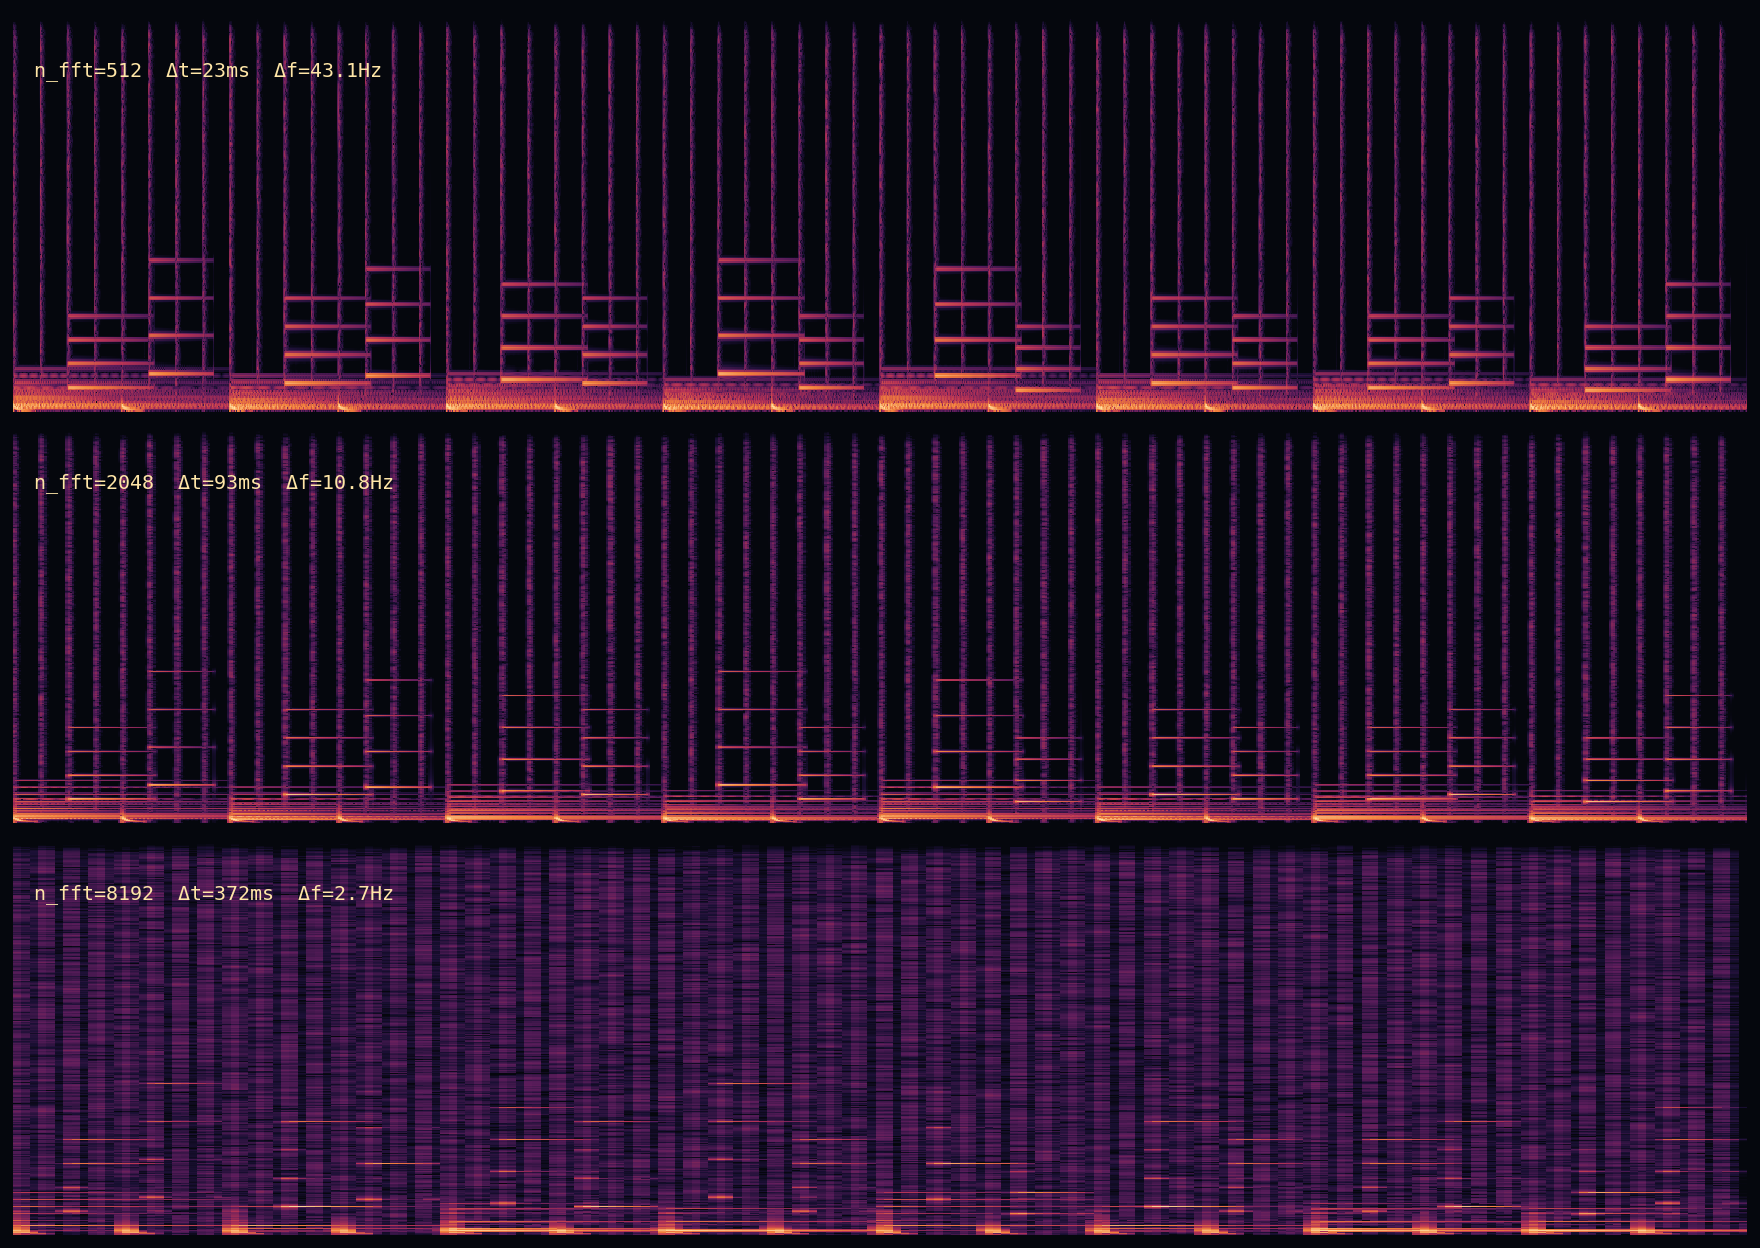
Short windows resolve every drum hit and smear the chords; long windows pin the harmonics to a few Hz and smear every transient across 372 ms. Δt·Δf = 1 throughout — no setting wins both.
Video frames are rasterised in pure NumPy and piped straight into ffmpeg
over stdin: no matplotlib per frame, no intermediate PNGs, faster than
realtime at 1280×720 / 30 fps.
Palettes (ember, abyss, mono, bloom) are perceptually monotonic.
jet is deliberately absent — its non-uniform lightness invents banding that
is not in the data.
Layout
spectral_forensics/
├── io.py          decode → mono → resample (ffmpeg fallback for m4a)
├── transform.py   STFT / mel / CQT      (numpy in, numpy out)
├── reassign.py    phase-derivative reassignment + rasterisation
├── invert.py      masking, spectral gating, Griffin-Lim, image → audio
├── audit.py       cutoff / steepness / intensity-stereo forensics
├── render.py      matrix → image        (no audio code)
├── video.py       ffmpeg pipe
└── cli.py         argparse entry point

docs/              the browser demo — static, served by GitHub Pages as is
├── analysis.js    audit + STFT + reassignment, ported from the Python above
├── app.js         the page
├── i18n.js        English / Chinese / Japanese strings
├── fonts/         Geist, Geist Mono (SIL OFL 1.1)
└── samples/       built by examples/make_web_samples.py
transform.py never imports matplotlib and render.py never imports
librosa, so either half is usable alone.
Tests
pytest -q # 69 passed
CI runs the suite on Python 3.11 through 3.14 on every push, and again every Monday. The weekly run exists because the dependencies carry no pinned versions: upstream drift should surface in CI before it surfaces in somebody's install. A preview job on Python 3.15 runs alongside; it may fail without blocking anything and shows which dependency has not caught up yet. Dependabot opens a pull request when a new major release falls outside one of the version caps, or when an action used by the workflows moves on. Release notes are in CHANGELOG.md.
What the suite asserts, beyond "it doesn't crash": Δt·Δf = 1 across window lengths; a 1 kHz tone peaking within one FFT bin; reassignment measurably sharpening a chirp on an identical grid; synthetic brick-wall cutoffs at 12/16/19 kHz recovered to within 500 Hz; a gentle 6 dB/oct rolloff not being flagged as an encoder cutoff; an exact STFT→ISTFT round trip; band rejection leaving neighbouring bands intact; Griffin-Lim error decreasing monotonically with iteration count; and the browser demo's JavaScript agreeing with the Python and with librosa, bin for bin.
The browser tests run the JavaScript under Node and skip when Node is absent,
which is convenient locally and dangerous in CI: a runner without Node would
report green while testing nothing. CI therefore installs Node and sets
SPF_REQUIRE_NODE=1, which turns that skip into a failure. It also
node --checks every script in docs/, since the page has no build step to
catch a syntax error first.
There are also CLI smoke tests that execute every subcommand. They exist
because --help passing proves nothing — argparse never invokes the handler,
so a subcommand whose handler had been deleted sailed through a --help
sweep and shipped broken.
What CI caught
Two real defects, both invisible on the development machine:
auditcrashed withNameError. Its handler'sdefline was lost in an earlier edit, leaving the body as unreachable code inside another function. The CLI smoke tests now cover this.- Griffin-Lim broke on librosa 0.x. The code passed librosa 1.0's
rngargument whilepyproject.tomldeclaredlibrosa>=0.10, where the same argument is calledrandom_state. Anyone installing within the declared range hit aTypeError. The 3.11 job resolved an older librosa and surfaced it; the seeding keyword is now detected at runtime.
Both share a shape worth naming: the declared support range was wider than the code actually supported, which is exactly the gap a single development environment cannot see.
References
The algorithms here are not mine; the implementation and the validation are.
- K. Kodera, R. Gendrin, C. de Villedary (1978). Analysis of time-varying signals with small BT values. IEEE Trans. ASSP 26(1), 64–76. — the original reassignment idea.
- F. Auger, P. Flandrin (1995). Improving the readability of time-frequency and time-scale representations by the reassignment method. IEEE Trans. Signal Processing 43(5), 1068–1089. — the general framework this implementation follows.
- D. Griffin, J. Lim (1984). Signal estimation from modified short-time
Fourier transform. IEEE Trans. ASSP 32(2), 236–243. — the phase
reconstruction used by
sonify. - R. Martin (2001). Noise power spectral density estimation based on optimal
smoothing and minimum statistics. IEEE Trans. Speech and Audio Processing
9(5), 504–512. — the noise floor used by
edit --denoise. - J. Brown (1991). Calculation of a constant Q spectral transform. JASA
89(1), 425–434. — the basis of
--transform cqt.
Roadmap
- Psychoacoustic masking overlay — dim what is physically present but inaudible, which is exactly what the encoder decided to throw away
- A lowpass-independent transcode detector that survives validation
- Interactive painting UI instead of round-tripping through a PNG mask
Licence
MIT. The demo track is generated by examples/make_demo_audio.py; do not
commit commercial recordings to this repository.
1 maintainer

Metadata
1 maintainer
Release files for spectral-forensics 0.4.2
For a detailed explanation of source distributions (sdists) and built distributions (wheels), please see the package formats documentation.
Source distribution (sdist)
| File | Size | Uploaded | |
|---|---|---|---|
| spectral_forensics-0.4.2.tar.gz | 61.6 kB | Details |
Built distribution (wheel)
| File | Interpreter | ABI | Platform | Reset |
|---|---|---|---|---|
| spectral_forensics-0.4.2-py3-none-any.whl | Python 3 | none | any | Details |
Total release size: 106.1 kB
Release files / spectral_forensics-0.4.2.tar.gz
| Download URL | spectral_forensics-0.4.2.tar.gz |
|---|---|
| Size | 61.6 kB |
| Tags | Source |
|
SHA-256 checksum How to use checksums |
9fdb8334d579da7c76181bd8b3396911b83c1550c3a5492ae87c5e15a24e3b1d
|
|
BLAKE2b-256 checksum How to use checksums |
f1aa05a9b15e02ac662004c2866a3e72cb643d807ebb64b253943217c1c3fb9d
|
| Upload date | |
|
Uploaded using Trusted Publishing? What is trusted publishing? |
Yes |
| Uploaded via |
twine/7.0.0 CPython/3.13.14
|
Provenance
Provenance describes where a file came from. On PyPI, provenance is shared via attestations, which provide a verifiable record of the build or publishing details. View details, limitations and caveats.


PyPI Publish Attestation
PyPI verified that this artifact, at this checksum, originated from the publisher listed below.
Signed by GitHub Actions, verified by PyPI on Oct 8, 2026.
Transparency logRelease files / spectral_forensics-0.4.2-py3-none-any.whl
| Download URL | spectral_forensics-0.4.2-py3-none-any.whl |
|---|---|
| Size | 44.4 kB |
| Tags | Python 3 |
|
SHA-256 checksum How to use checksums |
b11debb07dae26565f92f739cb2d1ff7568c08bcf4d7395525adc65cad18e0c7
|
|
BLAKE2b-256 checksum How to use checksums |
998a8e163b9a7601368da21f61de8af2cce3ad1960ad94f937b32a32fd9af42a
|
| Upload date | |
|
Uploaded using Trusted Publishing? What is trusted publishing? |
Yes |
| Uploaded via |
twine/7.0.0 CPython/3.13.14
|
Provenance
Provenance describes where a file came from. On PyPI, provenance is shared via attestations, which provide a verifiable record of the build or publishing details. View details, limitations and caveats.
PyPI Publish Attestation
PyPI verified that this artifact, at this checksum, originated from the publisher listed below.
Signed by GitHub Actions, verified by PyPI on Oct 8, 2026.
Transparency log













