
spectroML - analyze spectral data and build, validate and apply machine-learning prediction models

Project description
spectroML
spectroML is an open-source tool for analyzing spectral data and building, validating, and applying machine-learning prediction models - designed for spectroscopy and hyperspectral remote sensing, but usable for any tabular spectral dataset.
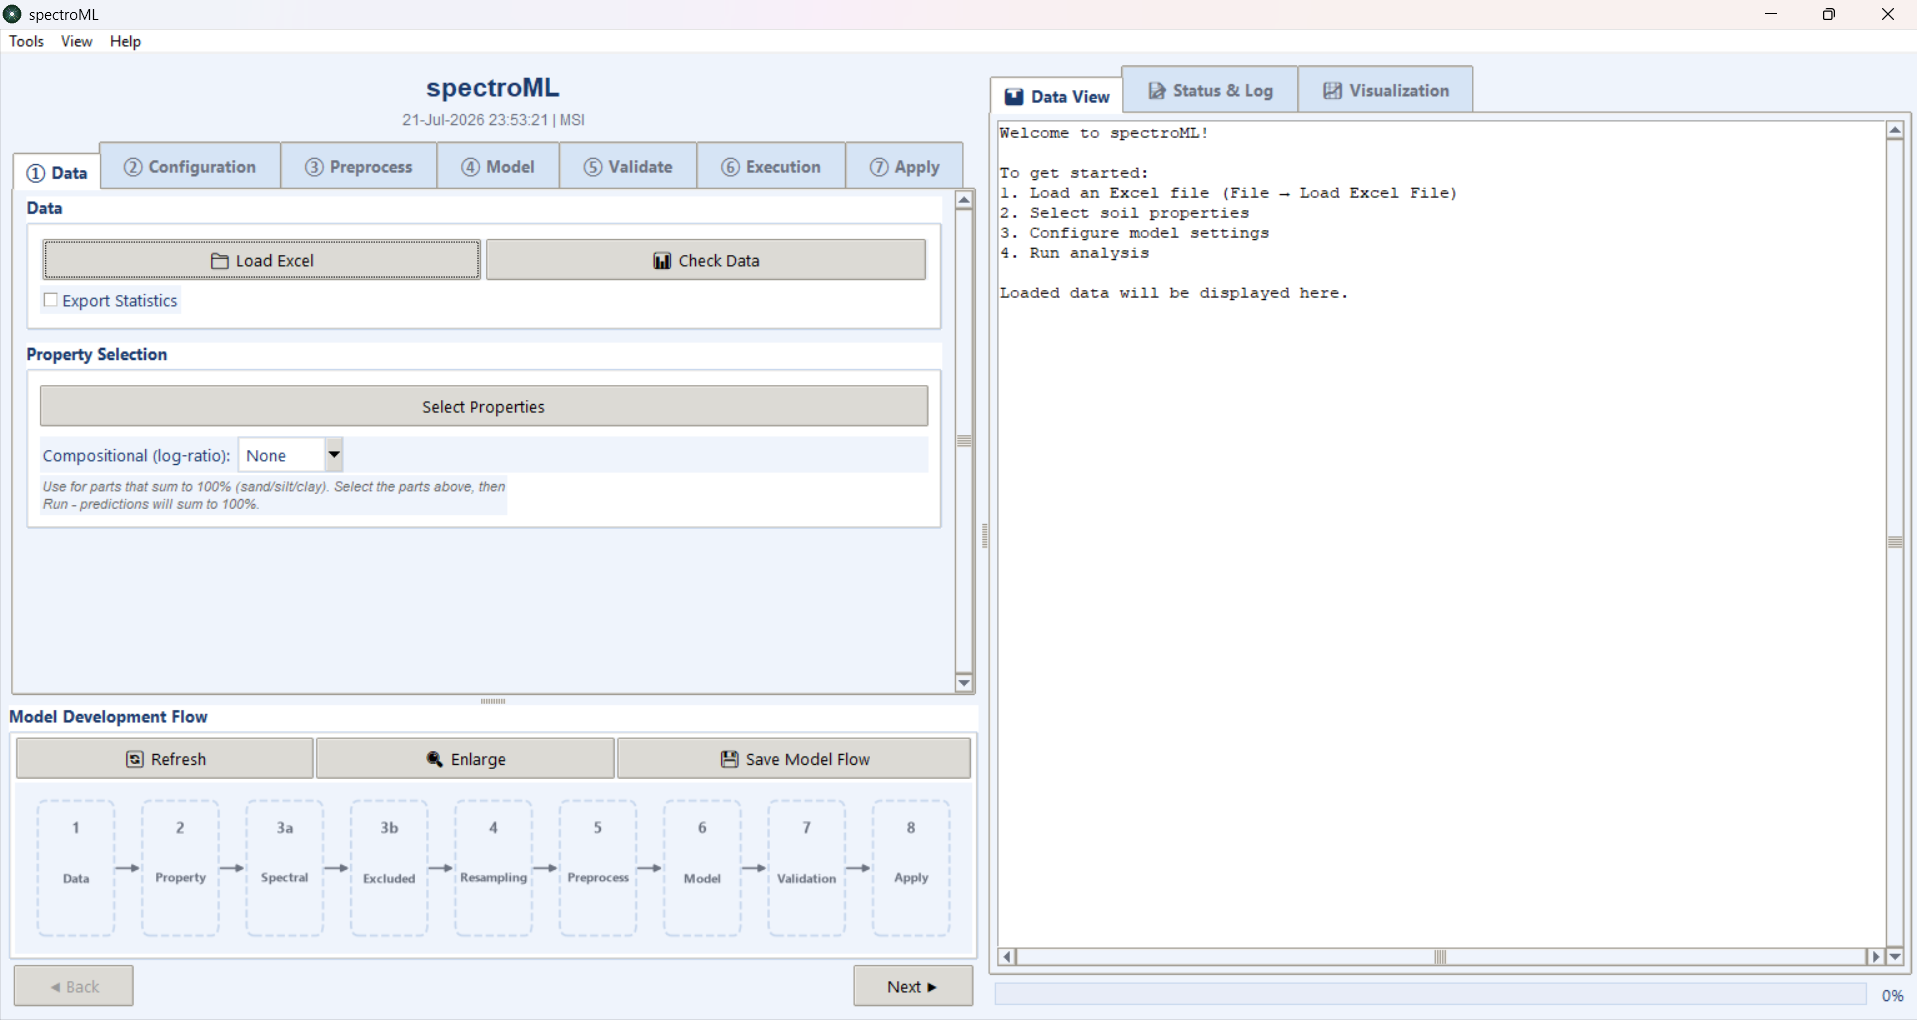
The interface is organized as a 7-step wizard (Data → Configuration → Preprocess → Model → Validate → Execution → Apply) with a live Model Development Flow diagram, so a complete workflow - from loading spectra to applying a trained model on a hyperspectral image - can be run without writing any code.
Features
Data Handling
- Flexible input: load spectral data from Excel (
.xlsx,.xls,.ods) or CSV - Data Converter: a built-in wizard that auto-detects arbitrary instrument layouts (row-wise or transposed/column-wise), handles
nm/µmunits, optionally merges a separate target properties (soil/vegetation) file, and exports to the spectroML-compatible format - Data checks & statistics: inspect loaded data and export summary statistics
- Multi-property selection: analyze several properties in a single run
Spectral Processing
- Preprocessing: Continuum Removal, First Derivative, Second Derivative, Absorbance (plus optional PCA dimensionality reduction in the model pipeline)
- Band resampling (7 methods): Linear, Nearest-Neighbour, Quadratic and Cubic-Spline interpolation, Gaussian SRF convolution, Empirical SRF integration, and Band Averaging - for harmonizing spectra to a target sensor's band configuration
- Wavelength exclusion: drop noisy regions with custom ranges or one-click presets (water-absorption bands, noisy detector edges)
- Custom band definitions: upload per-band FWHM or full Spectral Response Function (SRF) tables for bandwidth-aware resampling
Modeling
- Regression models: PLS-R, SVM, Ridge, Lasso, Multiple Linear Regression, Elastic Net, Huber Regressor, Gradient Boosting, Gaussian Process, Random Forest, and XGBoost
- Compositional modeling: ALR / CLR / ILR log-ratio transforms so predictions of sum-constrained parts (e.g. sand + silt + clay) add up to 100%
- Hyperparameter tuning: automated optimization (Optuna) for supported models
- Cross-validation: K-Fold, Leave-One-Out, and Leave-P-Out strategies
Batch Mode
- Multi-model comparison: train and compare multiple models automatically
- Best-fit recommendation: suggests the best model per property from R², RMSE, and cross-validation metrics
- Automated plots: observed-vs-predicted scatter plots, reflectance-spectra plots, and feature-importance charts (importance bars for tree models; wavelength-correlation plots for others)
- Comprehensive reporting: Excel workbooks with per-model comparison sheets plus multi-page PDF plot reports (model file, Excel report, and PDF share one run timestamp)
Apply to Images
- Hyperspectral image prediction: apply a trained model across a full image cube
- Multi-format geospatial I/O: GeoTIFF/TIFF, ENVI (
.dat/.bil/.bip/.bsq+.hdr), ERDAS Imagine (.img), NITF, and PCIDSK - wavelengths/FWHM are recovered from ENVI headers, and predictions are written back in the same format with georeferencing preserved - Robust handling: automatic gain/offset scaling, background/no-data and bad-band masking, and memory-safe chunked processing for large scenes
- Resampled-cube export: optionally export the resampled image (or tabular spectra) to verify the harmonization step
Interface
- Themes: Ocean, Slate, Forest, Light-Contrast, and Dark (View → Theme)
- Model Development Flow: a live, themed pipeline diagram that reflects your current settings and can be exported at 300 DPI
- Built-in Help Assistant: searchable in-app guidance (Help menu)
Data Converter
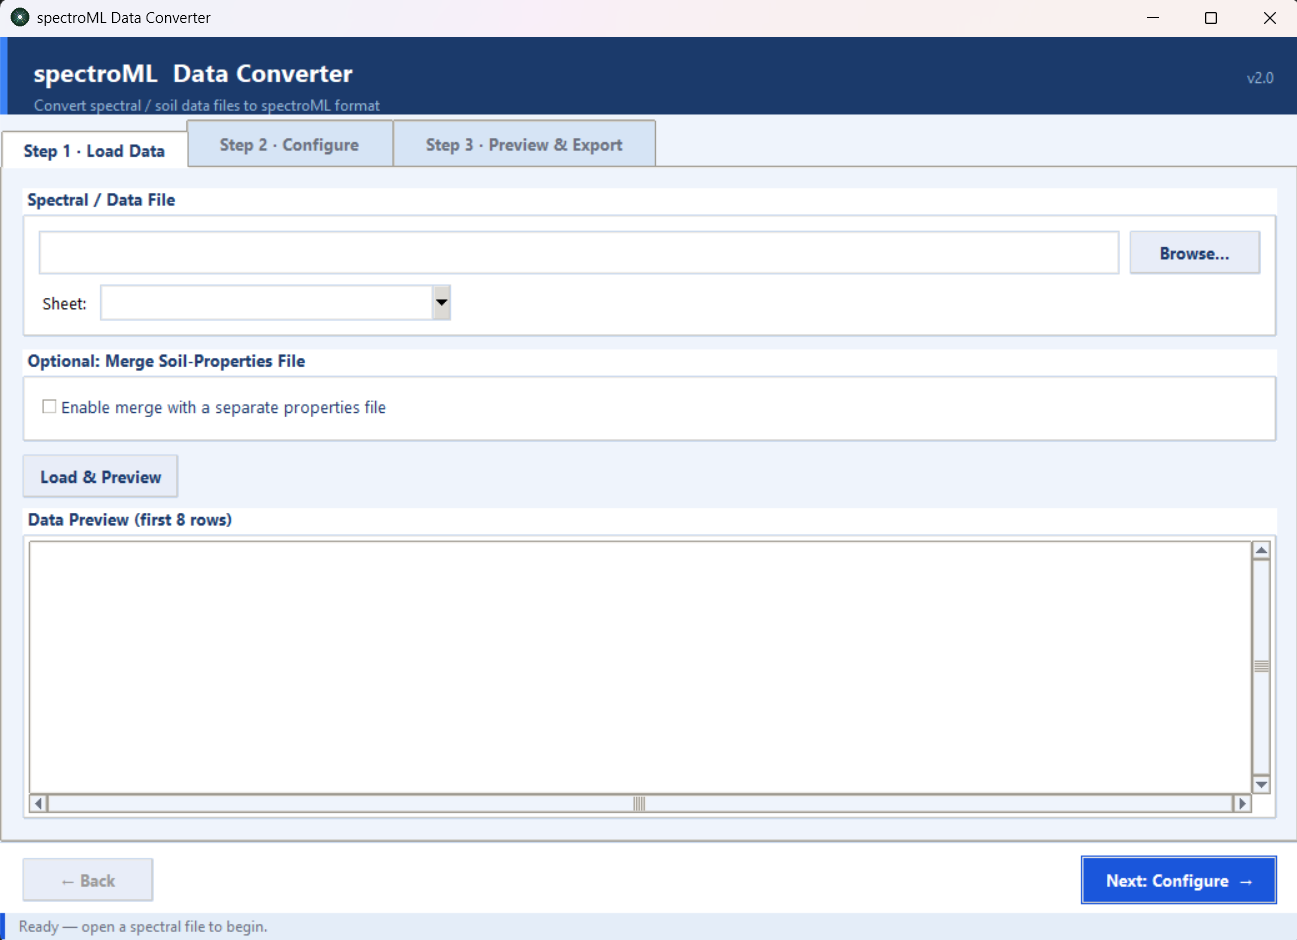
Not every instrument exports data in the layout spectroML expects. The spectroML Data Converter (Tools → Data Converter, or the spectroml-converter command) is a three-step wizard - Load Data → Configure → Preview & Export - that auto-detects the layout of an arbitrary Excel/CSV file and converts it to the standard Names | Prop1 … PropN | WL1 … WLM format.
Project Structure
spectroML is organized into focused packages:
| Path | Contents |
|---|---|
spectroml/__init__.py |
Package entry point -spectroml(), launch(), SpectralAnalyzer |
spectroml/gui/ |
Tkinter application, split into composable mixins |
spectroml/preprocessing/ |
Spectral preprocessing, resampling, compositional transforms |
spectroml/models/ |
Model training, hyperparameter tuning, batch processing |
spectroml/validation/ |
Cross-validation |
spectroml/utils/ |
File I/O, data converter, image processing, help assistant |
spectroml/samples.py |
Bundled example data -load_sample(), sample_path(), view() |
spectroml/data/ |
The example workbooks installed with the package |
spectroml/theme.py |
Shared color themes |
pyproject.toml |
Packaging metadata and dependency list |
Installation
spectroML is a standard Python package. Installing it pulls in every dependency (NumPy, pandas, scikit-learn, SciPy, matplotlib, XGBoost, Optuna, rasterio, spectral, Pillow, openpyxl, xlrd, odfpy) automatically:
pip install spectroml
To install from a clone of this repository instead:
pip install .
Requires Python 3.9 or newer with Tkinter available (bundled with the standard python.org and Conda installers; on Debian/Ubuntu install python3-tk).
Usage
Open the GUI from Python:
import spectroml

spectroml()          # opens the spectroML window
Equivalent ways to start it:
from spectroml import spectroml
spectroml()

import spectroml
spectroml.launch()
From a terminal, the installer also puts two commands on your PATH:
spectroml             # main application
spectroml-converter   # standalone Data Converter wizard
or run the package as a module:
python -m spectroml
For headless / scripted use the main window class is importable directly:
from spectroml import SpectralAnalyzer
Bundled Example Data
Two example workbooks are installed together with the package, so there is nothing to download before trying spectroML out - and they double as a reference for the input layout it expects (Names | Prop1 … PropN | WL1 … WLM):
import spectroml

sample = spectroml.load_sample()       # DataFrame: 598 soil samples × 25 columns
spectroml.view(sample)                 # opens it in Excel

spectroml.load_sample("unknown")       # 32 held-out samples, for the Apply step
spectroml.list_samples()               # -> ['sample', 'unknown']
spectroml.sample_path()                # full path, e.g. to load through the GUI
Both sets contain the sample name, eight measured soil properties (Sand, Silt, Clay, BD, pH, CaCO, OC, CarbonStock) and 16 spectral bands.
view() also accepts a DataFrame of your own - it is written to a temporary workbook and handed to whatever program opens .xlsx files on your system (Excel on Windows, or LibreOffice / Numbers elsewhere) - or the path of an existing spreadsheet:
spectroml.view(my_dataframe)
spectroml.view("results.xlsx")
spectroml.view()                       # opens the bundled sample
Typical Workflow
A typical batch workflow:
- Data - load spectral data and select one or more properties
- Configuration / Preprocess - choose resampling, exclusions, and preprocessing
- Model / Validate - pick single or multiple models and a cross-validation strategy
- Execution - run the analysis to get an Excel report, PDF plots, and best-model recommendations, then save the trained model
- Apply - load a hyperspectral image or new dataset and predict with the saved model
License
Code in this repository is licensed under the MIT License. See the LICENSE file for details.
Citation
If you use this software in your research, please cite:
@software{spectroML2026,
author = {Sharad Kumar Gupta},
title = {spectroML: An Open-Source Machine Learning tool for Spectroscopic Analysis},
year = {2026},
url = {https://github.com/sharadgupta27/spectroml}
}
Acknowledgement
I have taken inspiration from Paracuda II tool developed by Carmon and Ben-dor during my Postdoctoral Research at Tel Aviv University, Israel.:
Carmon, N., & Ben-Dor, E. (2017). An advanced analytical approach for spectral-based modelling of soil properties. International Journal of Emerging Technologies and Advanced Engineering, 7, 90–97.
Commercial Use
The code is MIT-licensed, so commercial use is permitted - keeping the copyright notice is all that is required. For collaboration or support enquiries, contact: sharadgupta27@gmail.com
Release history Release notifications | RSS feed

Download files
Download the file for your platform. If you're not sure which to choose, learn more about installing packages.
Source Distribution
Built Distribution
Filter files by name, interpreter, ABI, and platform.
If you're not sure about the file name format, learn more about wheel file names.
Copy a direct link to the current filters
File details
Details for the file spectroml-1.0.0.tar.gz.
File metadata
- Download URL: spectroml-1.0.0.tar.gz
- Upload date:
- Size: 346.2 kB
- Tags: Source
- Uploaded using Trusted Publishing? No
- Uploaded via: twine/6.2.0 CPython/3.14.6
File hashes
| Algorithm | Hash digest | |
|---|---|---|
| SHA256 |
e2807846ed25139d1465241522c338ee2ae6449afbf19828fe52e27a88e9703e
|
|
| MD5 |
59bcdb9d22e3719beb2c3c7d8726358c
|
|
| BLAKE2b-256 |
6720763f76608e415a0d19c8dfa6e43462f77c4b3331a54882bc8ad520ee68e7
|
File details
Details for the file spectroml-1.0.0-py3-none-any.whl.
File metadata
- Download URL: spectroml-1.0.0-py3-none-any.whl
- Upload date:
- Size: 350.9 kB
- Tags: Python 3
- Uploaded using Trusted Publishing? No
- Uploaded via: twine/6.2.0 CPython/3.14.6
File hashes
| Algorithm | Hash digest | |
|---|---|---|
| SHA256 |
aa9f7e85be308170388606a13bbdc57652a833e5c2192d742032643bc02559a8
|
|
| MD5 |
8318a55f48c3272af823ae52683c5910
|
|
| BLAKE2b-256 |
2d6021c45e447c4876c72b06df54a809a66d4474d5a84ec6d60a4be22c3cc3fa
|






