Sphinx extension to render the image by script or command
Project description
A sphinx extension to process all kinds of command or codeblocks into images/figure.
- author:
“Yongping Guo”<guoyoooping@163.com>
1. Installing and setup
pip install sphinxcontrib-cmd2img
And just add sphinxcontrib.cmd2img to the list of extensions in the conf.py file. For example:
extensions = ['sphinxcontrib.cmd2img']
2. Introduction and examples
In rst we we use image and figure directive to render image/figure in the target html document, which give us much convenience. In fact we could rending more things than that.
Sometime some command would convert or generate a image, we would like to render it efficiently and directly, for example:
2.1 ditaa example
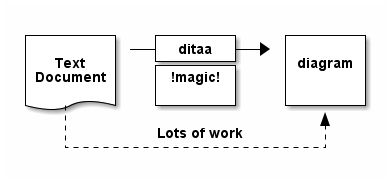
ditaa is a small command-line utility that can convert diagrams drawn using ascii art (‘drawings’ that contain characters that resemble lines like | / - ), into proper bitmap graphics. We could use the following directive to render the image generated by ditaa:
.. cmd2img:: ditaa
   :caption: figure 1. illustration for ditaa

    +--------+   +-------+    +-------+
    |        | --+ ditaa +--> |       |
    |  Text  |   +-------+    |diagram|
    |Document|   |!magic!|    |       |
    |     {d}|   |       |    |       |
    +---+----+   +-------+    +-------+
        :                         ^
        |       Lots of work      |
        +-------------------------+
Or use the following directive to render it as a figure, for a figure, we can add a caption, to render it as .svg file, we add –svg in the command line:
.. cmd2img:: ditaa --svg
   :caption: figure 2. illustration for ditaa with option

      +--------+   +-------+    +-------+
      |        | --+ ditaa +--> |       |
      |  Text  |   +-------+    |diagram|
      |Document|   |!magic!|    |       |
      |     {d}|   |       |    |       |
      +---+----+   +-------+    +-------+
          :                         ^
          |       Lots of work      |
          +-------------------------+
After convert using ditaa, the above file becomes:
2.2 gnuplot example
From release 1.1.4, gnuplot generate .svg image for html and .pdf image for latex by default. You can change :suffix: to change the output format.
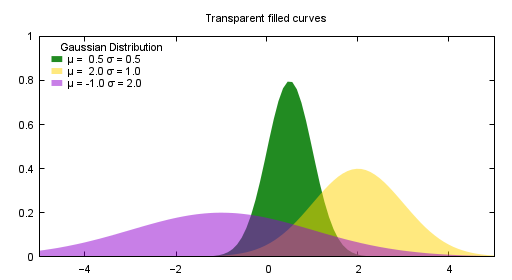
Another example is gnuplot.:
.. cmd2img:: gnuplot
    :caption: figure 3. illustration for gnuplot
    :size: 512,280

    #set terminal pngcairo transparent enhanced font "arial,8" fontscale 1.0 size 512, 280
    #set output 'transparent.2.png'
    set style fill transparent solid 0.5 noborder
    set style function filledcurves y1=0

    Gauss(x,mu,sigma) = 1./(sigma*sqrt(2*pi)) * exp( -(x-mu)**2 / (2*sigma**2) )
    d1(x) = Gauss(x, 0.5, 0.5)
    d2(x) = Gauss(x,  2.,  1.)
    d3(x) = Gauss(x, -1.,  2.)

    set xrange [-5:5]
    set yrange [0:1]
    set key title "Gaussian Distribution"
    set key top left Left reverse samplen 1
    set title "Transparent filled curves"
    plot d1(x) fs solid 1.0 lc rgb "forest-green" title "μ =  0.5 σ = 0.5", \
         d2(x) lc rgb "gold" title "μ =  2.0 σ = 1.0", \
         d3(x) lc rgb "dark-violet" title "μ = -1.0 σ = 2.0"
After convert using gnuplot, the above file becomes:
2.3 python example
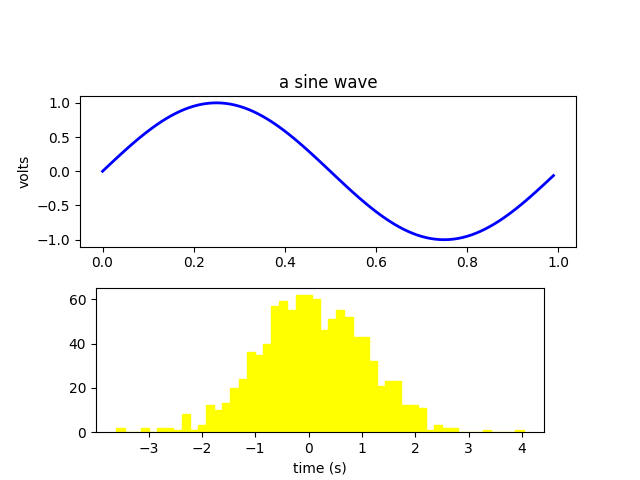
Another example is gnuplot. Since the output result is embedded in the script, we use “:image: sphx_glr_artists_001.2.png” to assign the output file explicitly:
.. cmd2img:: python
    :caption: figure 4. illustration for python

    import numpy as np
    import matplotlib.pyplot as plt

    fig = plt.figure()
    fig.subplots_adjust(top=0.8)
    ax1 = fig.add_subplot(211)
    ax1.set_ylabel('volts')
    ax1.set_title('a sine wave')

    t = np.arange(0.0, 1.0, 0.01)
    s = np.sin(2*np.pi*t)
    line, = ax1.plot(t, s, color='blue', lw=2)

    # Fixing random state for reproducibility
    np.random.seed(19680801)

    ax2 = fig.add_axes([0.15, 0.1, 0.7, 0.3])
    n, bins, patches = ax2.hist(np.random.randn(1000), 50,
                                facecolor='yellow', edgecolor='yellow')
    ax2.set_xlabel('time (s)')
    plt.savefig("sphx_glr_artists_001.png")
After conversion using python3, the above file becomes:
2.4 convert example
Another example is convert. You can write the command in the commnad line:
.. cmd2img:: convert rose:  -fill none -stroke white -draw 'line 5,40 65,5'  rose_raw.png
    :caption: illustration for convert

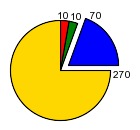
or you can write most of the command line in the body:
.. cmd2img:: convert
    :caption: illustration for convert

    -size 140x130 xc:white -stroke black \
    -fill red   -draw "path 'M 60,70 L   60,20   A 50,50 0 0,1 68.7,20.8 Z'" \
    -fill green -draw "path 'M 60,70 L 68.7,20.8 A 50,50 0 0,1 77.1,23.0 Z'" \
    -fill blue  -draw "path 'M 68,65 L 85.1,18.0 A 50,50 0 0,1  118,65   Z'" \
    -fill gold  -draw "path 'M 60,70 L  110,70   A 50,50 0 1,1   60,20   Z'" \
    -fill black -stroke none  -pointsize 10 \
    -draw "text 57,19 '10' text 70,20 '10' text 90,19 '70' text 113,78 '270'" \
    piechart.jpg
2.5 dot example
Another example is dot, since we want to generate png image, we add the option in the command, it’s dot’s own option:
.. cmd2img:: dot -Tpng
    :caption: illustration for dot

    digraph G {

            subgraph cluster_0 {
                    style=filled;
                    color=lightgrey;
                    node [style=filled,color=white];
                    a0 -> a1 -> a2 -> a3;
                    label = "process #1";
            }

            subgraph cluster_1 {
                    node [style=filled];
                    b0 -> b1 -> b2 -> b3;
                    label = "process #2";
                    color=blue
            }
            start -> a0;
            start -> b0;
            a1 -> b3;
            b2 -> a3;
            a3 -> a0;
            a3 -> end;
            b3 -> end;

            start [shape=Mdiamond];
            end [shape=Msquare];
    }
After convert using dot, the above file becomes:
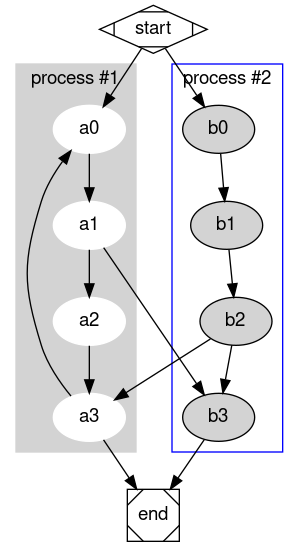
2.6 Other applications
In theory, Besides those applications I listed above, all the command or script that could generate the image could be used by this plugin, but some application has special file/options format, they might not work as expected. They need to be tested and please let me know if there is any issue.
3 Options
sphinxcontrib-cmd2img provide some options for easy use.
3.1 command options
For command options, you should add it right after the command, for example:
.. cmd2img:: ditaa --no-antialias
   :caption: figure 1. illustration for ditaa with option.

    +--------+   +-------+    +-------+
    |        | --+ ditaa +--> |       |
    |  Text  |   +-------+    |diagram|
    |Document|   |!magic!|    |       |
    |     {d}|   |       |    |       |
    +---+----+   +-------+    +-------+
        :                         ^
        |       Lots of work      |
        +-------------------------+
3.2 sphinxcontrib-cmd2img options
- size:
Control the output image size for gnuplot.
- suffix:
Control the output image format.
- convert:
After the image is generate, if you’d like to change somthing with convert, you can change the result image.
- show_source:
for text generated iamge, if the source code is shown. By default it’s true
For example:
.. cmd2img:: gnuplot
    :caption: figure 1. illustration for gnuplot with watermark.
    :convert: -stroke red -strokewidth 2 -fill none -draw "line 100,100
             200, 200"
    :size: 900,600
    :width: 600

    plot [-5:5] (sin(1/x) - cos(x))*erfc(x)
5. License
GPLv3
6. Changelog
0.1 Initial upload.
0.2 Correct minor typo
1.0 Upgrade to 1.0, bug fix: If there is change of the script, it doesn’t generate a new image.
1.0.2 Bug fix: When copy file error, shouldn’t break the following process.
1.0.3 Bug fix: dot doesn’t work now fix it.
1.0.4 Enhancement: If the :image: optins is presented, you can reference the image directly in the rst file.
1.0.5 Enhancement: If some instance in a document use the same :image: name, it also works now.
1.0.6 Bug fix: On cygwin, ditaa doesn’t work.
1.0.7 Enhancement: Bypass the first empty line which is not the content.
1.0.8 bug fix: dot sometimes doesn’t work.
1.0.9 Add a new parameter: convert and Remove the following parameters: watermark/gravity/location/fill/pointsize
1.1.0 format the usage and we use image and figure as the same. Meanwhile we don’t need give the output file.
1.1.1 Support comments starting with ‘#’ in the convert option.
1.1.2 You can use option “:suffix:” to desginate the output suffix explicitly, or it would gesss it on best effort.
1.1.3 The html default output for gnuplot is now “svg”, for pdf is “pdf”.
1.1.4 You can you :size: options to change the output image size for gnuplot.
1.1.5 Now gnuplot/ditaa support vector image. Others need to be added later or has been supported already.
Project details
Release history Release notifications | RSS feed
Download files
Download the file for your platform. If you're not sure which to choose, learn more about installing packages.
Source Distribution
Hashes for sphinxcontrib-cmd2img-1.1.6.tar.gz
| Algorithm | Hash digest | |
|---|---|---|
| SHA256 | 99b7ed00018b9677fd35ae66f6190d06e39952db05f71fc889fc2f111f1fbe9c |
|
| MD5 | 7e9470eab31c633b5d01c83ee5221f8b |
|
| BLAKE2b-256 | 5b11270dd514150689d2750636ef81ccf5698967f12ca532f5a594c316cb3afa |


