
spviz
spviz is a TensorBoard-style observer for intermediate signal-processing data products. Your application continues to own execution, scheduling, and data flow. spviz only taps values that the application already produced, records their semantic axes and lineage, and serves an interactive visualization afterward.
Explore all fourteen live examples
What it looks like
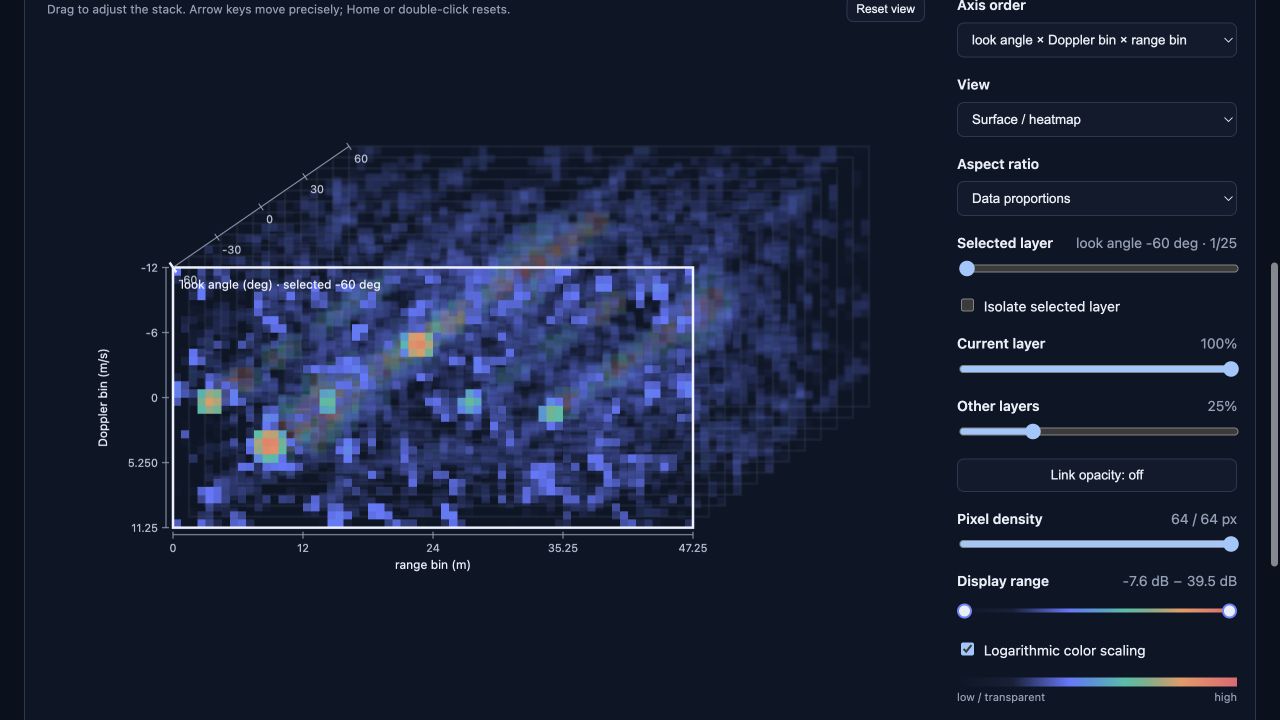
A real synthetic phased-array data cube, with the selected plane in focus and the full processing context still visible.
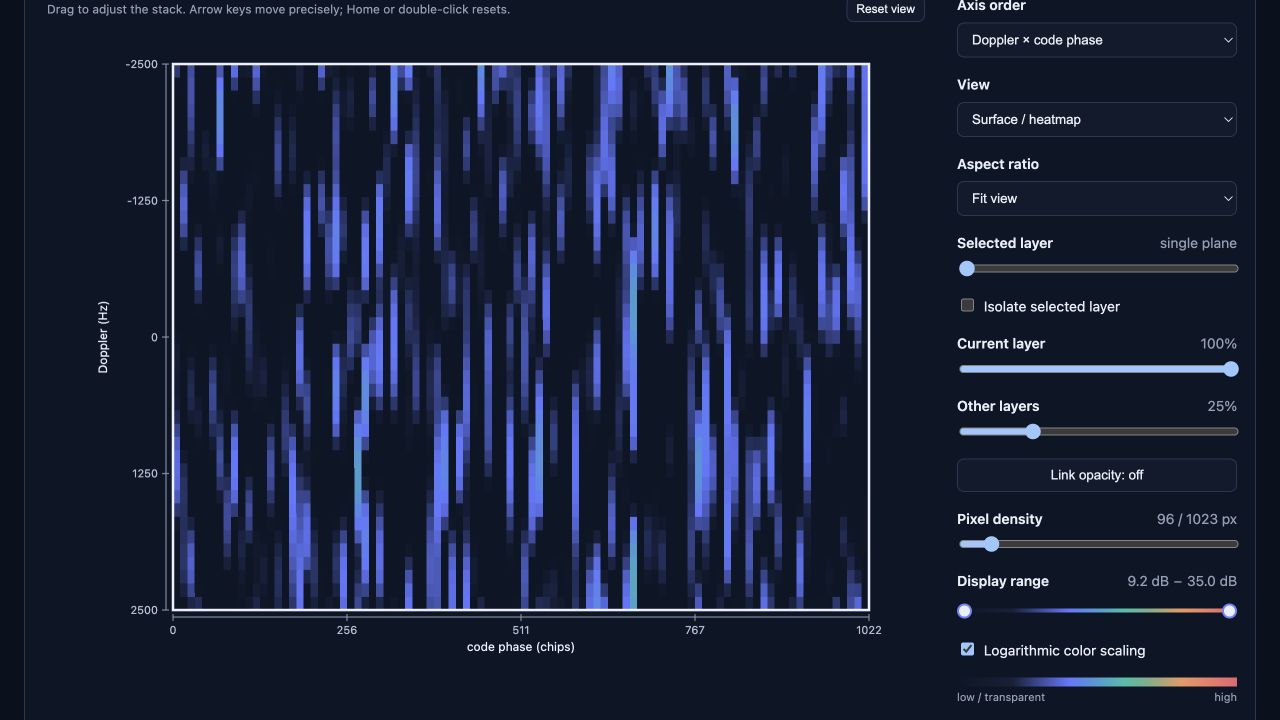
- Phased-array radar — beamforming, range–Doppler processing, cell averaging, and CA-CFAR.
- Microphone-array audio — delay-and-sum steering, spectra, noise estimation, and tone-candidate detection.
- QPSK receiver — carrier correction, matched filtering, sampled symbol phases, constellation density, and decision errors.
- Seismic array — trace filtering, spectra, event-energy integration, and triggering.
- Multi-lead ECG — baseline removal, QRS enhancement, energy integration, and one R-peak detection per aligned beat.
- LFM pulse compression — 1D chirp, complex echo, matched filtering, CA-CFAR, and detections.
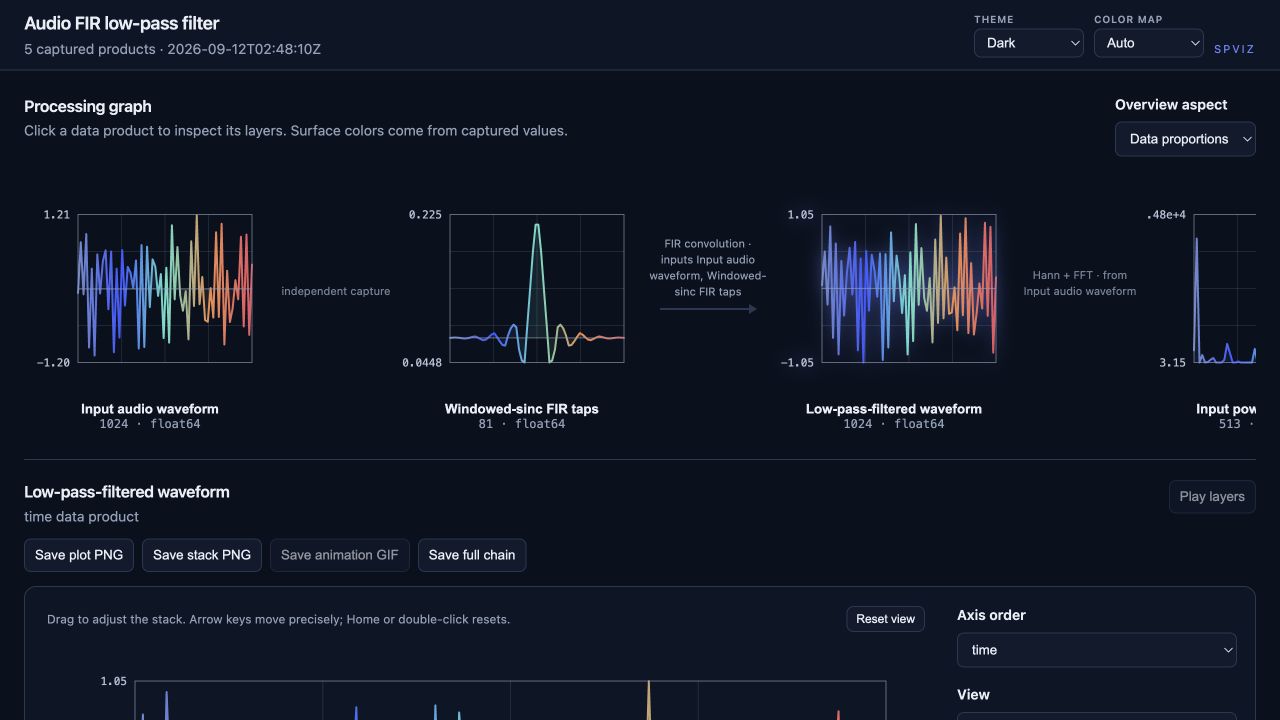
- Audio FIR low-pass — 1D waveforms, windowed-sinc low-pass coefficients, convolution, and power spectra.
- Rolling-bearing diagnostics — 1D vibration, resonance filtering, analytic envelope, and fault harmonics.
- Acoustic source localization — a 1D reference, 2D microphone capture, 3D steered time–frequency cube, 2D beam energy, and 1D direction score.
- OFDM receiver quality — a 1D I/Q capture, 3D resource grid, 2D EVM and error maps, and 1D subcarrier quality.
- GPS acquisition — a real GPS L1 C/A Gold code, noisy multipath I/Q, coherent correlations, acquisition cuts, and detection.
- Ultrasound B-mode — pulse-echo channel RF, fractional-delay focusing, coherent beamforming, envelope detection, and reflector picks.
- CT reconstruction — a modified Shepp–Logan phantom, noisy Radon projections, Ram–Lak filtering, per-angle backprojections, and reconstruction.
- Polyphase channelizer — intermittent wideband emitters through a true four-tap PFB/FFT, integration, activity detection, and occupancy.
GitHub Actions regenerates the complete gallery from examples/radar.py, examples/gallery.py, and examples/advanced_gallery.py, then deploys it to Pages on every push to main. You can create the same serverless bundle yourself with spviz export-static RUN_DIR OUTPUT_DIR.
Install
pip install spviz
To run the repository's radar example locally:
git clone https://github.com/briday1/signal-processing-visualization.git
cd signal-processing-visualization
python -m venv .venv
. .venv/bin/activate
pip install -e .
python examples/radar.py
spviz serve runs/radar-demo
Choose a different port with either --port or -p:
spviz serve runs/radar-demo --port 9000
Open the URL printed by the server (default: http://127.0.0.1:8765). Click any product without losing the pipeline overview, permute axes, scrub or animate layers, isolate a layer, adjust the opacity of other layers, and inspect individual values. Horizontal and vertical dragging adjust the 3D stack separation within constrained inspection bounds, while double-clicking restores the home view. Two-dimensional products can switch between a heatmap and stacked 1D slices; axis order selects which dimension becomes the playable layer axis.
The viewer includes dark and light interface themes plus Spviz, Viridis, Plasma, Inferno, Magma, Cividis, Coolwarm, and Twilight color maps. Sequential maps fade their low end into the page theme, signed fields automatically use a zero-centered diverging map with zero transparent, and phase uses an opaque cyclic map. NaN remains transparent in every mode, so undefined CFAR edges and masked samples stay visually honest.
The inspector can export the selected axis-labeled layer as PNG, the current transparent stack as PNG, an animated GIF sweep through the selected depth axis, or the complete processing chain as PNG. Exports preserve the active axis permutation, coordinates, units, color limits, log mode, transparency, and selected layer where applicable.
The pixel-density control trades fidelity for interaction speed using an explicit samples-per-displayed-axis count. Small and medium products reach exact native resolution; very large dynamic runs use a 1024-pixel-per-axis visual safety ceiling so one gesture cannot allocate an unbounded browser canvas. The pipeline overview remains fixed at a lightweight 64 samples per axis.
The inspector aspect-ratio control offers Data proportions (the normal array width-to-height ratio), Equal axes (a square display extent), and Fit view (fill the available inspector area). The processing overview has a separate aspect control and defaults to data-proportional previews. Overview settings affect only the top processing graph; every product inspector opens independently in Data proportions mode.
Observe your existing pipeline
import numpy as np
import spviz

spviz.init("runs/my-run", name="My receiver")

# These functions belong to your application. spviz does not call them.
iq = read_receiver()
spviz.tap(
    iq,
    "Raw I/Q",
    axes=["channel", "pulse", "sample"],
    representation="magnitude",
    units="volts",
)

beamformed = beamform(iq)
spviz.tap(
    beamformed,
    "Beamformed I/Q",
    filename="beamformed_iq.npy",
    axes=["beam", "pulse", "sample"],
    scale="log",
    vmin=1e-4,
    vmax=2.0,
    operation="beamform",
    inputs=iq,
)

range_doppler = process_range_doppler(beamformed)
spviz.tap(
    range_doppler,
    "Range–Doppler",
    axes=["beam", "doppler", "range"],
    operation="range + Doppler FFT",
    inputs=beamformed,
)

spviz.close()
axes names every source dimension. Arrays with one to three dimensions use all of them by default. For higher-dimensional products, explicitly choose the three spatial dimensions while preserving the full source shape:
spviz.tap(
    data,
    "Range–Doppler history",
    axes=["frame", "beam", "doppler", "range"],
    view_axes=["beam", "doppler", "range"],
    coordinates={
        "frame": timestamps,
        "beam": {"values": look_angles, "units": "deg"},
        "doppler": {"values": velocities, "units": "m/s"},
        "range": {"values": ranges, "units": "m"},
    },
)
Coordinates may be numeric, categorical, or temporal. They are stored as separate NumPy arrays and loaded only when needed; long evenly spaced axes travel as compact start/step descriptions. The inspector presents permutations using axis names—not anonymous dimension numbers—and displays coordinate ranges, physical layer values, units, and coordinates for selected cells. For products above three dimensions, live-server controls for every non-view axis select the fixed source index without changing the three spatial axes. Static bundles preserve the captured default index for those extra dimensions, avoiding a combinatorial export for large tensors.
tap() returns the exact object it receives, so it can also be inserted inline without changing the chain:
beamformed = spviz.tap(beamform(iq), "Beamformed", inputs=iq)
filename= controls the .npy filename inside the run's arrays/ directory. It is intentionally a filename rather than an arbitrary path, keeping runs self-contained and portable. When omitted, spviz derives a safe filename from the display name and adds a suffix for repeated names.
scale= sets the product's default visualization scale to "linear" (the default) or "log". It initializes the inspector and is also honored by the full-chain overview. Users can still toggle the selected product interactively.
representation= controls how scalar display values are derived without modifying the captured array. "auto" (the default) preserves signed real data and shows magnitude for complex data. Explicit choices are "real", "imag", "magnitude", "power", and "phase"; imaginary and phase views require complex-valued input. The choice applies consistently to 1D traces, maps, stacks, statistics, and exports.
statistics= controls the one-time range scan performed during capture. "exact" is the default and gives the range sliders true whole-product limits. "sampled" bounds that scan to roughly one million uniformly distributed values for very large products. "none" skips it completely and therefore requires explicit vmin= and vmax=. Rendering itself remains bounded independently of this capture-time choice.
overview_aspect= optionally overrides only that product's top processing-graph preview with "data", "equal", or "fit". It does not change the product inspector. Without an override, the shared overview aspect control applies.
vmin= and vmax= set a product's initial absolute display range. In sequential maps, values at or below vmin are fully transparent and then fade smoothly into the selected color map; this lets background/noise disappear into either the dark or light theme without discarding the underlying captured data. Signed, phase, and binary products use their corresponding diverging, cyclic, and categorical opacity semantics. The viewer's range controls remain adjustable.
For code where wrapping a function is convenient, optional instrumentation observes its return value while leaving invocation and scheduling with the original application:
spviz.init("runs/my-run")

@spviz.instrument(name="Filtered I/Q", axes=["channel", "sample"])
def filter_bank(iq):
    return existing_filter_implementation(iq)
Observed runs are portable directories containing manifest.json and standard NumPy .npy files. Source arrays are memory-mapped by the viewer. It requests only a bounded context stack plus the exact selected plane, so interaction cost follows display resolution rather than total source size. Rapid density changes are coalesced, stale draws are ignored, and render caches are bounded.
Run publication is transactional. spviz.init(..., mode="replace") (the default) stages a complete new run beside the destination and swaps it in only on explicit successful close. Use mode="error" when an existing destination should instead be treated as a mistake. For exception-aware automatic commit or rollback, use Session as a context manager.
Static exports are staged and swapped into place only after a complete successful build. By default each axis permutation is capped at 16 MB and the run at 256 MB while preserving every selectable depth layer; only plane density is reduced when needed. Tune those budgets for unusually large products:
spviz export-static runs/my-run site --max-volume-mb 32 --max-total-mb 512
Current scope
- NumPy arrays with arbitrary dimensionality
- Directed product lineage and operation labels
- Local, dependency-light HTTP server
- Transparent stacked-slice volume rendering
- Axis permutation, layer playback/isolation, opacity, and value inspection
- Fourteen deterministic, physically grounded demonstrations spanning 1D, 2D, and 3D products
Live streaming, framework adapters, timeline comparison, and GPU-side capture remain future work; captured-run inspection is the intentionally focused core.
1 maintainer

Download files
Download the file for your platform. If you're not sure which to choose, learn more about installing packages.
Source Distribution
Built Distribution
Filter files by name, interpreter, ABI, and platform.
If you're not sure about the file name format, learn more about wheel file names.
Copy a direct link to the current filters
File details
Details for the file spviz-0.2.0.tar.gz.
File metadata
- Download URL: spviz-0.2.0.tar.gz
- Upload date:
- Size: 300.3 kB
- Tags: Source
- Uploaded using Trusted Publishing? No
- Uploaded via:
twine/7.0.0 CPython/3.12.14
File hashes
| Algorithm | Hash digest | |
|---|---|---|
| SHA256 |
74de8311a7fac6029013c342973e171fc26a7b74e91f203806f185731d5102ab
|
|
| MD5 |
2682b31bd0ed370300c4b78662184f70
|
|
| BLAKE2b-256 |
b010ffb4692d1ece947ca210dc08b36ef53d1d9cef168756aea7db0841ce230a
|
File details
Details for the file spviz-0.2.0-py3-none-any.whl.
File metadata
- Download URL: spviz-0.2.0-py3-none-any.whl
- Upload date:
- Size: 55.8 kB
- Tags: Python 3
- Uploaded using Trusted Publishing? No
- Uploaded via:
twine/7.0.0 CPython/3.12.14
File hashes
| Algorithm | Hash digest | |
|---|---|---|
| SHA256 |
773ab8f2b5eec938c73d9bf7a5fac9fb02eb273e742e7498110a6dec653797c7
|
|
| MD5 |
071e32871c54a705c94d2525fdb668ee
|
|
| BLAKE2b-256 |
14647ec3cceb914cbd039a41f0c75222423388d382aa959798d7d822136ddc33
|














