
sqtop


htop for Slurm: a terminal dashboard that answers where can I run, under which
account/QOS, and when would my job start?, on the cluster you are logged in to and on
any cluster you can reach over ssh.
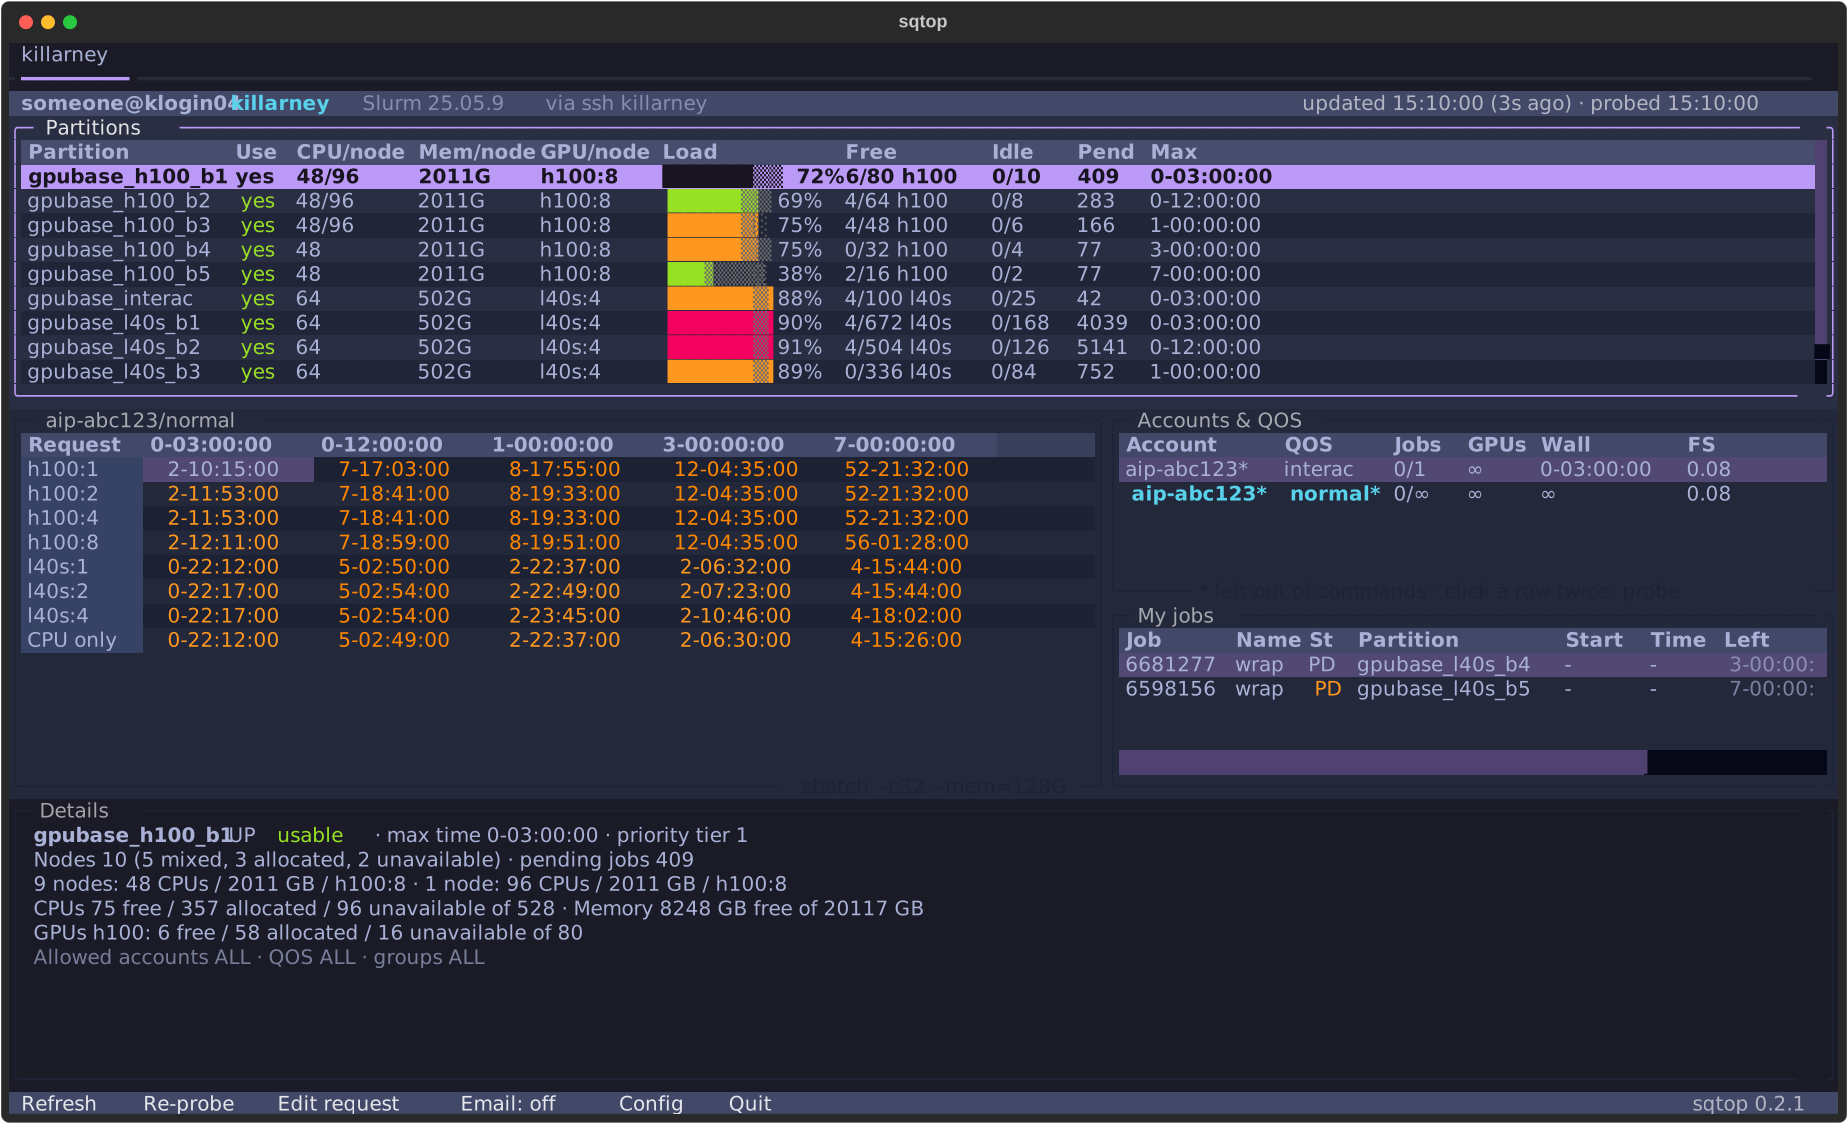
- Start-time estimates. Each request size (each GPU type up to your cap, then CPU
only) is test-submitted at every partition time limit with
sbatch --test-only, so you see when 1 GPU for 3 hours would start next to 8 GPUs for a week. - Partitions and hardware. Load, free GPUs and CPUs, idle nodes and pending jobs per partition or per kind of node, and which partitions your accounts may use.
- Your limits. Every account/QOS pair you can use, with its job, GPU and wall-time
caps and your fair share, read from Slurm even where
sacctmgrdoes not work. - Your jobs. Running and pending jobs, with expected start times and planned nodes.
- One click to act. Submit any estimate's
sbatchcommand, copy any command, or release a job, each after you confirm. - Several clusters in one window. A tab per cluster over ssh, from a login node or from your laptop. sqtop reuses your ssh connections and never asks for a password.
- Hourly email of the whole report while the dashboard runs.
Everything is read from Slurm, so it works on any cluster; the few site rules Slurm cannot report go in a config file.
Quick start
You need uv, which fetches Python 3.13 if you do not have it.
uvx sqtop                 # run the latest release
uv tool install sqtop     # or install it, then run `sqtop`
sqtop > report.txt        # when output is not a terminal, print a text report once
- On a Slurm login node, sqtop shows that cluster. It needs
scontrolandsqueue; estimates needsbatchorsrun. - On your own machine, it opens on the
Configform: add a cluster's name and the ssh host of its login node, clickSave, and its tab opens. See Remote clusters.
There are no command-line options. Probes use --test-only, so sqtop is safe on a
shared login node: nothing is submitted or cancelled until you confirm it in a dialog.
Remote clusters
Every cluster with an ssh host in your config gets a tab. sqtop runs Slurm on its
login node through ssh with your ~/.ssh/config (aliases, users, keys), contacts it
only once you open its tab, and refreshes only the visible tab. Commands there get your
login shell's Slurm setup (PATH, and SLURM_CONF where a module sets it) and run from
your $SCRATCH, since some clusters refuse jobs submitted from /home.
sqtop never asks for a password or MFA. For a cluster that needs one, let ssh share
connections and log in with ssh in another terminal first; sqtop reuses that
connection:
# ~/.ssh/config
Host *.alliancecan.ca
    ControlMaster auto
    ControlPath ~/.ssh/cm-%C
    ControlPersist 4h
The connection then stays open for 4 hours after your last session there closes. With
keys that log in without a prompt, nothing is needed: sqtop opens its own shared
connection, which closes 10 minutes after its last use. A tab that cannot connect shows
ssh's error and how to connect; log in, then click Refresh.
Commands for a remote cluster are shown with its host as the prompt
(fir.alliancecan.ca$ sbatch ...): run them there. The text report covers the cluster
you are on, and the remote ones only where Slurm is not available.
Using the dashboard
Each tab probes a request of 32 CPUs and 128 GB with sbatch at every partition time
limit; change it with Edit request. Where the account/QOS being probed allows fewer
CPUs or less memory, the request is brought down to that cap, and the estimates note
capped by its limits. The visible tab refreshes every minute and re-probes every
five. There are no keyboard shortcuts: everything is a click, and each dialog closes
with its own buttons.
| Click | Action |
|---|---|
| a cluster tab | Show that cluster |
| a row or cell | Select it; the Details panel follows the selection |
| a highlighted Accounts & QOS row | Probe with that account/QOS |
| the Partitions title | Switch between Partitions and Nodes by hardware (a single-node cluster has one Hardware table instead) |
| the account/QOS above the estimates | Probe with the next account/QOS |
| the command under the estimates | Switch between sbatch and srun probes |
Submit in Details |
Submit the selected sbatch request, after you confirm |
Copy after a command in Details |
Copy that command |
Release in a job's Details |
Release the job with scancel, after you confirm |
Refresh / Re-probe |
Refresh everything / re-probe now |
Edit request |
Edit the probe request: whole node, CPUs, memory, walltimes, extra options such as --partition or --constraint, and the job email address |
Email: off / Email: on |
Email the report now and every hour until you quit / stop |
Config |
Edit the config in a form; saving applies it at once |
Quit |
Quit |
The bottom bar also shows which version of sqtop is running.
Reading the dashboard
- Partitions.
Usesays whether your accounts, QOS and Unix groups may submit there.CPU/node,Mem/nodeandGPU/nodedescribe each node (CPUs exclude reserved cores; two kinds of node show as48/96).Loadis the share of GPUs (CPUs on CPU-only partitions) in use:█allocated,▒unavailable (down, drained, reserved),░free.Freeis free/total per GPU type,Idlecounts wholly idle nodes,Pendcounts everyone's pending jobs, andMaxis the time limit. - Hardware, in place of Partitions on a cluster with a single node. Its partitions
all share that node, so Slurm reports the same hardware for each; the table has one
row per resource instead: CPUs, memory, then each GPU type.
LoadandFreeare as above.Pendcounts everyone's pending jobs asking for that GPU type, and on the CPUs row those asking for no GPU; every job asks for memory, so its row shows-.Maxis the longest time limit of the partitions you can use. Details list the partitions with their time limits, pending jobs and allowed QOS. - Start estimates, titled with the account/QOS probed. Rows are request sizes,
written as
--gpus-per-nodetakes them (h100:4), columns are walltimes, and each cell is how long until the scheduler expects the job to start:now, a wait such as0-10:54:00,nowhen it cannot run (Details gives the reason), or-above the account/QOS wall-time cap. The earliest start in each row is underlined. A longer job can start sooner: in the screenshot a 3-day L40S job beats a 12-hour one, since 12-hour jobs queue in the much busierb2partition. - Accounts & QOS. Every account/QOS pair you can submit under.
*marks what commands leave out because Slurm picks it anyway.Jobsis your running jobs over the tightest per-user cap,GPUsandWallare the tightest GPU and wall-time caps from any scope, andFSis your fair-share factor.∞means no cap,?unknown. - My jobs. Your queued and running jobs.
Startis when a job started, or when the scheduler expects a pending one to;Nodesis where it runs, or the nodes planned for a pending job (dimmed, as they can still change);Reasonis why it waits. - Details follows the selection, and scrolls when there is more than fits (a QOS
with many limits). For an estimate it shows the partition the job
would land in, the probe with the scheduler's reply, and the command to submit the
same request, each with
Copy. For a job it shows the command that attaches a shell to it (srun --jobid=<id> --overlap --pty <shell>) and the one that releases it.
Submitted jobs hold their allocation with sleep infinity until the time limit and
write no output file (--output=/dev/null). An srun command opens an interactive
shell, so it cannot be submitted from the dashboard: copy it and run it in a terminal.
Configuration
All settings live in ~/.config/sqtop/config.toml ($XDG_CONFIG_HOME/sqtop/config.toml
if you set that). Click Config to edit it in a form; Save checks the settings, writes
the file privately (chmod 600, since it can hold an SMTP password) and applies what
changed without a restart. The file is plain TOML, so you can also edit it by hand.
Clusters
Partitions, GPU types, time limits, accounts and limits all come from Slurm, and GPU
types are shown exactly as Slurm names them. A cluster profile records only an ssh host
and the rules Slurm cannot report, keyed by the cluster name (ClusterName in
scontrol show config):
| Setting | Values | Effect |
|---|---|---|
ssh |
a host or ~/.ssh/config alias |
A tab for the cluster from anywhere |
gpu_counts |
pow2 (default: 1, 2, 4, ...), all, whole_node, one_or_node |
GPU counts to probe. whole_node probes only whole nodes and asks for all of their CPUs and memory (--exclusive --mem=0); one_or_node probes 1 GPU and the whole node |
resources |
request (default), by_gpu |
by_gpu leaves -c/--mem out of GPU requests, for sites that size them by GPU and refuse --mem |
These clusters have been checked with sqtop:
| Cluster | Profile |
|---|---|
| Fir, Killarney, Narval, Nibi, Vulcan | ssh only |
| Tamia | gpu_counts = "whole_node": GPUs are allocated by whole node |
| Trillium GPU | gpu_counts = "one_or_node", resources = "by_gpu": one GPU or whole nodes, with CPUs and memory by GPU |
| RCL | gpu_counts = "all"; it is one node, so it shows the Hardware table |
[clusters.fir]
ssh = "fir.alliancecan.ca"

[clusters.tamia]
ssh = "tamia.alliancecan.ca"
gpu_counts = "whole_node"

[clusters.trillium-gpu]             # Trillium's GPU subcluster has its own login node
ssh = "trillium-gpu.alliancecan.ca"
gpu_counts = "one_or_node"
resources = "by_gpu"
The walltimes probed are not a setting: they are the distinct time limits of the
partitions you can use, which is where routing changes. Edit request overrides them
for a session.
Whole nodes
Tick "Whole node" in Edit request to probe whole nodes: every command asks for
--exclusive --mem=0 (every CPU and all the memory) instead of -c/--mem, and the
GPU rows are each type's full node, such as h100:8. Where a profile sets
gpu_counts = "whole_node", the GPU rows always do this and the estimates note "GPUs by
whole node"; with resources = "by_gpu" they note "GPU rows: CPUs and memory by GPU".
Job emails
A [mail] table adds --mail-type and --mail-user to every command you submit or
copy (probes leave them out), so a job emails you when it starts, ends or fails:
[mail]
user = "you@example.com"
type = "BEGIN,END,FAIL"       # any of sbatch's --mail-type values
Clear the address in Edit request to leave email out for a session.
Hourly email
Click Email: off to email the report now and every hour until you quit (click
Email: on to stop). Each email covers the cluster you are on and every remote tab you
have opened, and starts with your job counts and what happened since the last one:
killarney: 1 running, 2 pending. Since 14:00:
  6284538 (wrap) started on kn021
  6233018 (wrap) ended: TIMEOUT
  6290112 (eval) submitted (Priority), expected to start 10-17 09:30
The server comes from [smtp]:
[smtp]
server = "mail.example.org"
port = 587                       # STARTTLS; 465 for SSL
sender = "you@example.org"       # also the login
password = "..."
recipient = "you@example.org"    # default: user in [mail]
Every email has the subject sqtop and replies to the first, so your mail client keeps
them in one conversation. While the email is on, the top bar shows when the next one goes
out and marks it (last failed) if one could not be sent. The conversation and the jobs
last reported are kept in ~/.local/state/sqtop/mail.json; delete it to start a new
conversation.
Troubleshooting
- A remote tab shows an ssh error. Log in with
sshin a terminal (see Remote clusters), then clickRefresh. srunprobes fail with "Requested operation is presently disabled". sqtop is running on a compute node, such as inside an interactive job; run it on a login node.- Every estimate is rejected for submitting from
/home. On a cluster you are logged in to, sqtop submits from the directory you started it in: start it from/scratchor/project. Remote tabs already run from$SCRATCH. sacctmgrfails with "Connection refused".slurmdbdruns on the controller, but accounting is still enforced. sqtop reads limits fromscontrol show assoc_mgrinstead, and finds the account/QOS pairs you may use by test-submitting each one.
Development
uv sync
uv run python -m unittest discover -s tests -t tests
uvx ruff check src tests
See AGENTS.md for the code layout and the Slurm quirks of the sites sqtop runs on.
To release, bump the version and push a tag for it. The release workflow builds the package, publishes it to PyPI and creates the GitHub release, with the tag message's body as its notes:
uv version --bump patch          # or minor/major; updates pyproject.toml and uv.lock
git commit -am "Release $(uv version --short)"
git tag -a "v$(uv version --short)" -m "sqtop $(uv version --short)" -m "What changed..."
git push origin main "v$(uv version --short)"
License
MIT; see LICENSE. sqtop is inspired by hunoutl/slurmtop and slmtop.
1 maintainer

Metadata
1 maintainer
Release files for sqtop 0.4.0
For a detailed explanation of source distributions (sdists) and built distributions (wheels), please see the package formats documentation.
Source distribution (sdist)
| File | Size | Uploaded | Provenance | Actions |
|---|---|---|---|---|
| sqtop-0.4.0.tar.gz | 65.4 kB | Without provenance | Details for sqtop-0.4.0.tar.gz |
Built distribution (wheel)
| File | Interpreter | ABI | Platform | Actions Reset |
|---|---|---|---|---|
| sqtop-0.4.0-py3-none-any.whl | Python 3 | none | any | Details for sqtop-0.4.0-py3-none-any.whl |
Total release size: 135.8 kB
Release files / sqtop-0.4.0.tar.gz
| Download URL | sqtop-0.4.0.tar.gz |
|---|---|
| Size | 65.4 kB |
| Tags | Source |
|
SHA-256 checksum How to use checksums |
78860a623991242183e0295876bc974c91dfe04537b837d360da851eeac92e12
|
|
BLAKE2b-256 checksum How to use checksums |
57f2dac2d3bd4bd958f8ab771197125ca6e54dea5df9f7d8eb884a22ad20c752
|
| Upload date | |
|
Uploaded using Trusted Publishing? What is trusted publishing? |
Yes |
| Uploaded via |
uv/0.13.7 {"installer":{"name":"uv","version":"0.13.7","subcommand":["publish"]},"python":null,"implementation":{"name":null,"version":null},"distro":{"name":"Ubuntu","version":"26.04","id":"resolute","libc":null},"system":{"name":null,"release":null},"cpu":null,"openssl_version":null,"setuptools_version":null,"rustc_version":null,"ci":true}
|
Release files / sqtop-0.4.0-py3-none-any.whl
| Download URL | sqtop-0.4.0-py3-none-any.whl |
|---|---|
| Size | 70.4 kB |
| Tags | Python 3 |
|
SHA-256 checksum How to use checksums |
06317e9209e4f5753ee9f747bcc3444afae45fe03c3c918406fd45c770d011bc
|
|
BLAKE2b-256 checksum How to use checksums |
9664eb002da688a06e62467c1bff8f25b55c2cb8766cbf28f1850f87645a8a47
|
| Upload date | |
|
Uploaded using Trusted Publishing? What is trusted publishing? |
Yes |
| Uploaded via |
uv/0.13.7 {"installer":{"name":"uv","version":"0.13.7","subcommand":["publish"]},"python":null,"implementation":{"name":null,"version":null},"distro":{"name":"Ubuntu","version":"26.04","id":"resolute","libc":null},"system":{"name":null,"release":null},"cpu":null,"openssl_version":null,"setuptools_version":null,"rustc_version":null,"ci":true}
|
Security for sqtop 0.4.0
Provenance
Provenance describes where a file came from. On PyPI, provenance is shared via attestations, which provide a verifiable record of the build or publishing details. View details, limitations and caveats.
No provenance found
None of the files in this release were uploaded with provenance metadata.
A note on package security
PyPI is a repository for distributing packages, not a service for auditing them. While third-party security researchers and our staff do their best to detect and remove malicious packages, PyPI cannot guarantee the quality, security or suitability of any given package.
To learn more about protecting yourself from malicious actors, visit our package security documentation.














