
Standpoint




Standpoint belongs to a collection of libraries called AI Helpers developed for building Artificial Intelligence.
Know where each option actually stands.
Standpoint reads a comparison table (options as rows, criteria as columns, numbers in the cells) and produces a 2D positioning map, a short written analysis, and a YAML file with all the coordinates and coefficients. One command does it.
The method is ordinary PCA, which people have used for perceptual maps for a long time. What Standpoint adds is the work you would otherwise do by hand: it orients the map around a reference option, names the axes in plain words (in the language of your columns), colours and labels the points, and writes everything out.
The Promise
Standpoint is local-first by design. Three honest cases:
- Guaranteed local. Parsing, PCA, orientation, colouring, and figure rendering
(via
vl-convert) all run on your machine. Your table is never uploaded. There is no telemetry, no account, no SaaS. - The one caveat: the local model. Axis names and the written analysis are
produced by a local Ollama model on
localhost. Ollama downloads the model weights once on first pull; after that it runs offline. Nothing leaves your machine. - Your decision. You never have to run the model at all:
--no-llmgives you the full map deterministically, with axis names taken from the strongest column at each end and no written narrative.
Documentation
Input: a table of options and their ratings.
| Language | Performance | Ease of Learning | Ecosystem | Concurrency | Type Safety | Job Market | Tooling |
|---|---|---|---|---|---|---|---|
| Python | 2 | 5 | 5 | 2 | 2 | 5 | 4 |
| Rust | 5 | 2 | 3 | 5 | 5 | 3 | 4 |
| Go | 4 | 4 | 4 | 5 | 4 | 4 | 4 |
| JavaScript | 3 | 4 | 5 | 3 | 2 | 5 | 3 |
| … |
Output: a positioning map,
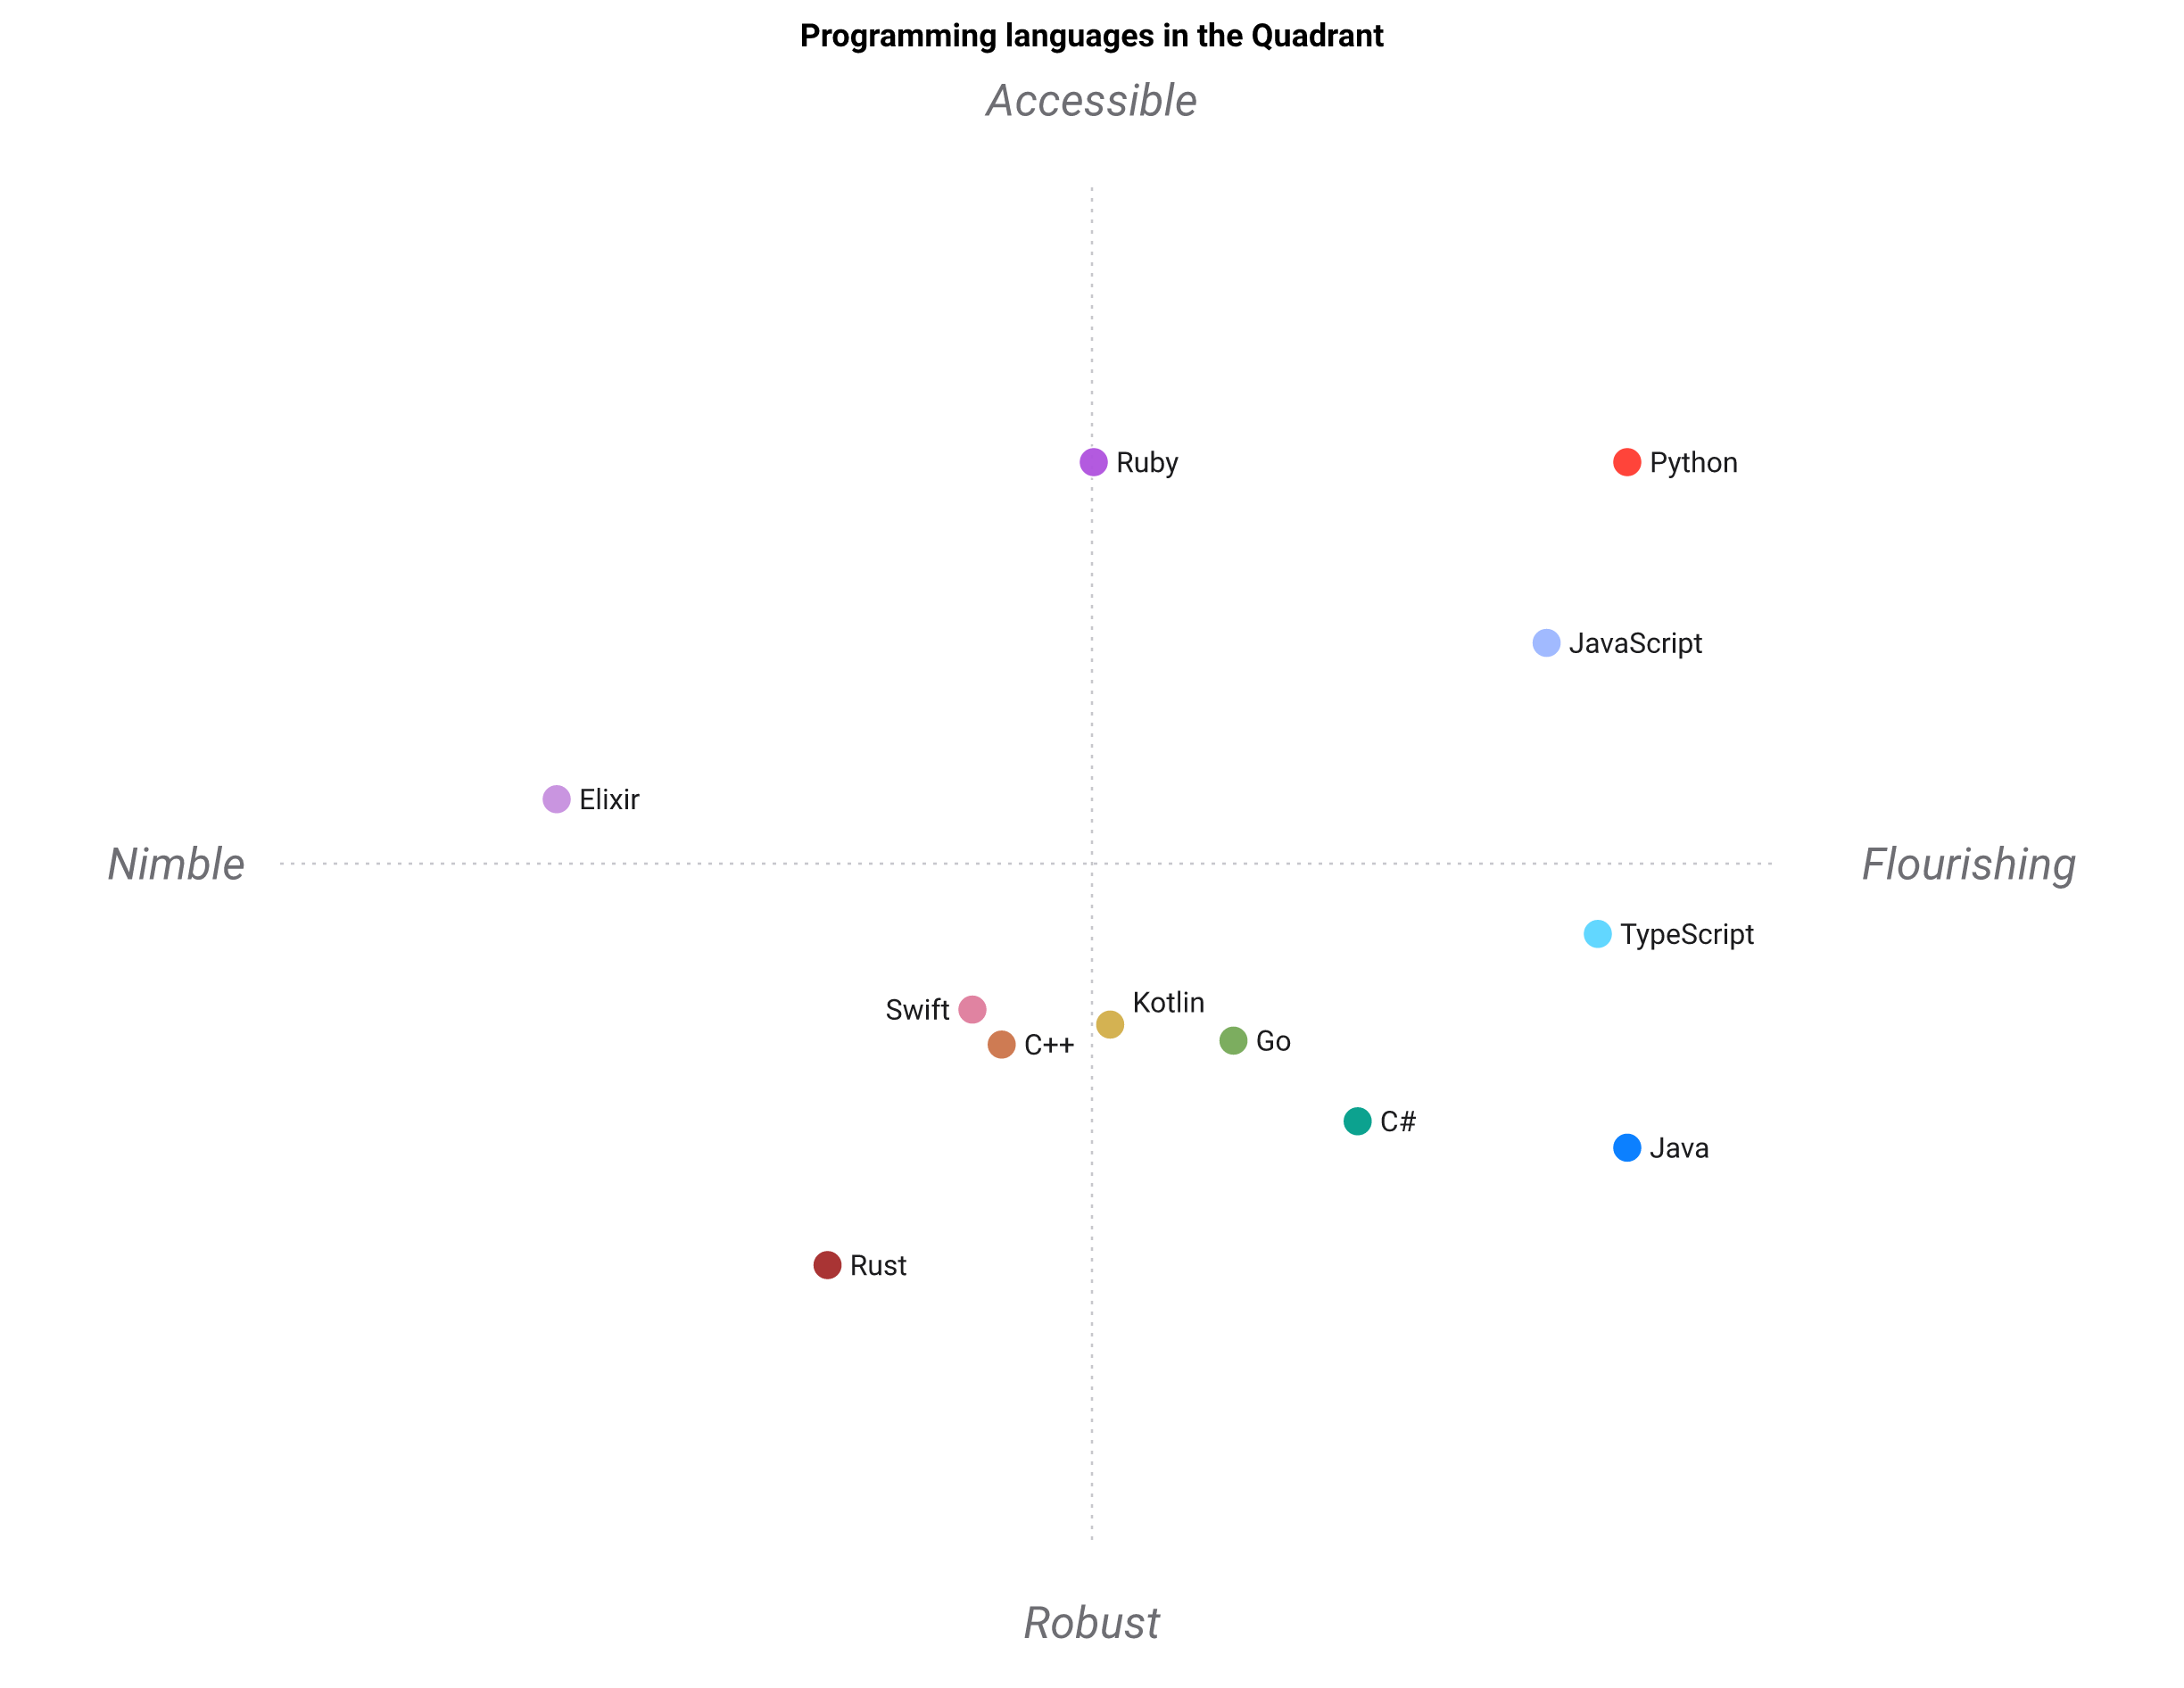
plus a Markdown analysis (what the axes mean, where the reference wins, which options stand out, with the loadings and a ranking) and a YAML file with every option's coordinates, role, colour, and original values.
Features
- One command, three-fold deliverable: a figure (PNG + SVG + Vega-Lite JSON), a Markdown interpretation, and a YAML of coordinates + coefficients.
- Readable axes: PCA keeps the axes as weighted sums of your columns; a local model names the four poles as positive qualities, guarded against acronyms, negatives, and antonym pairs.
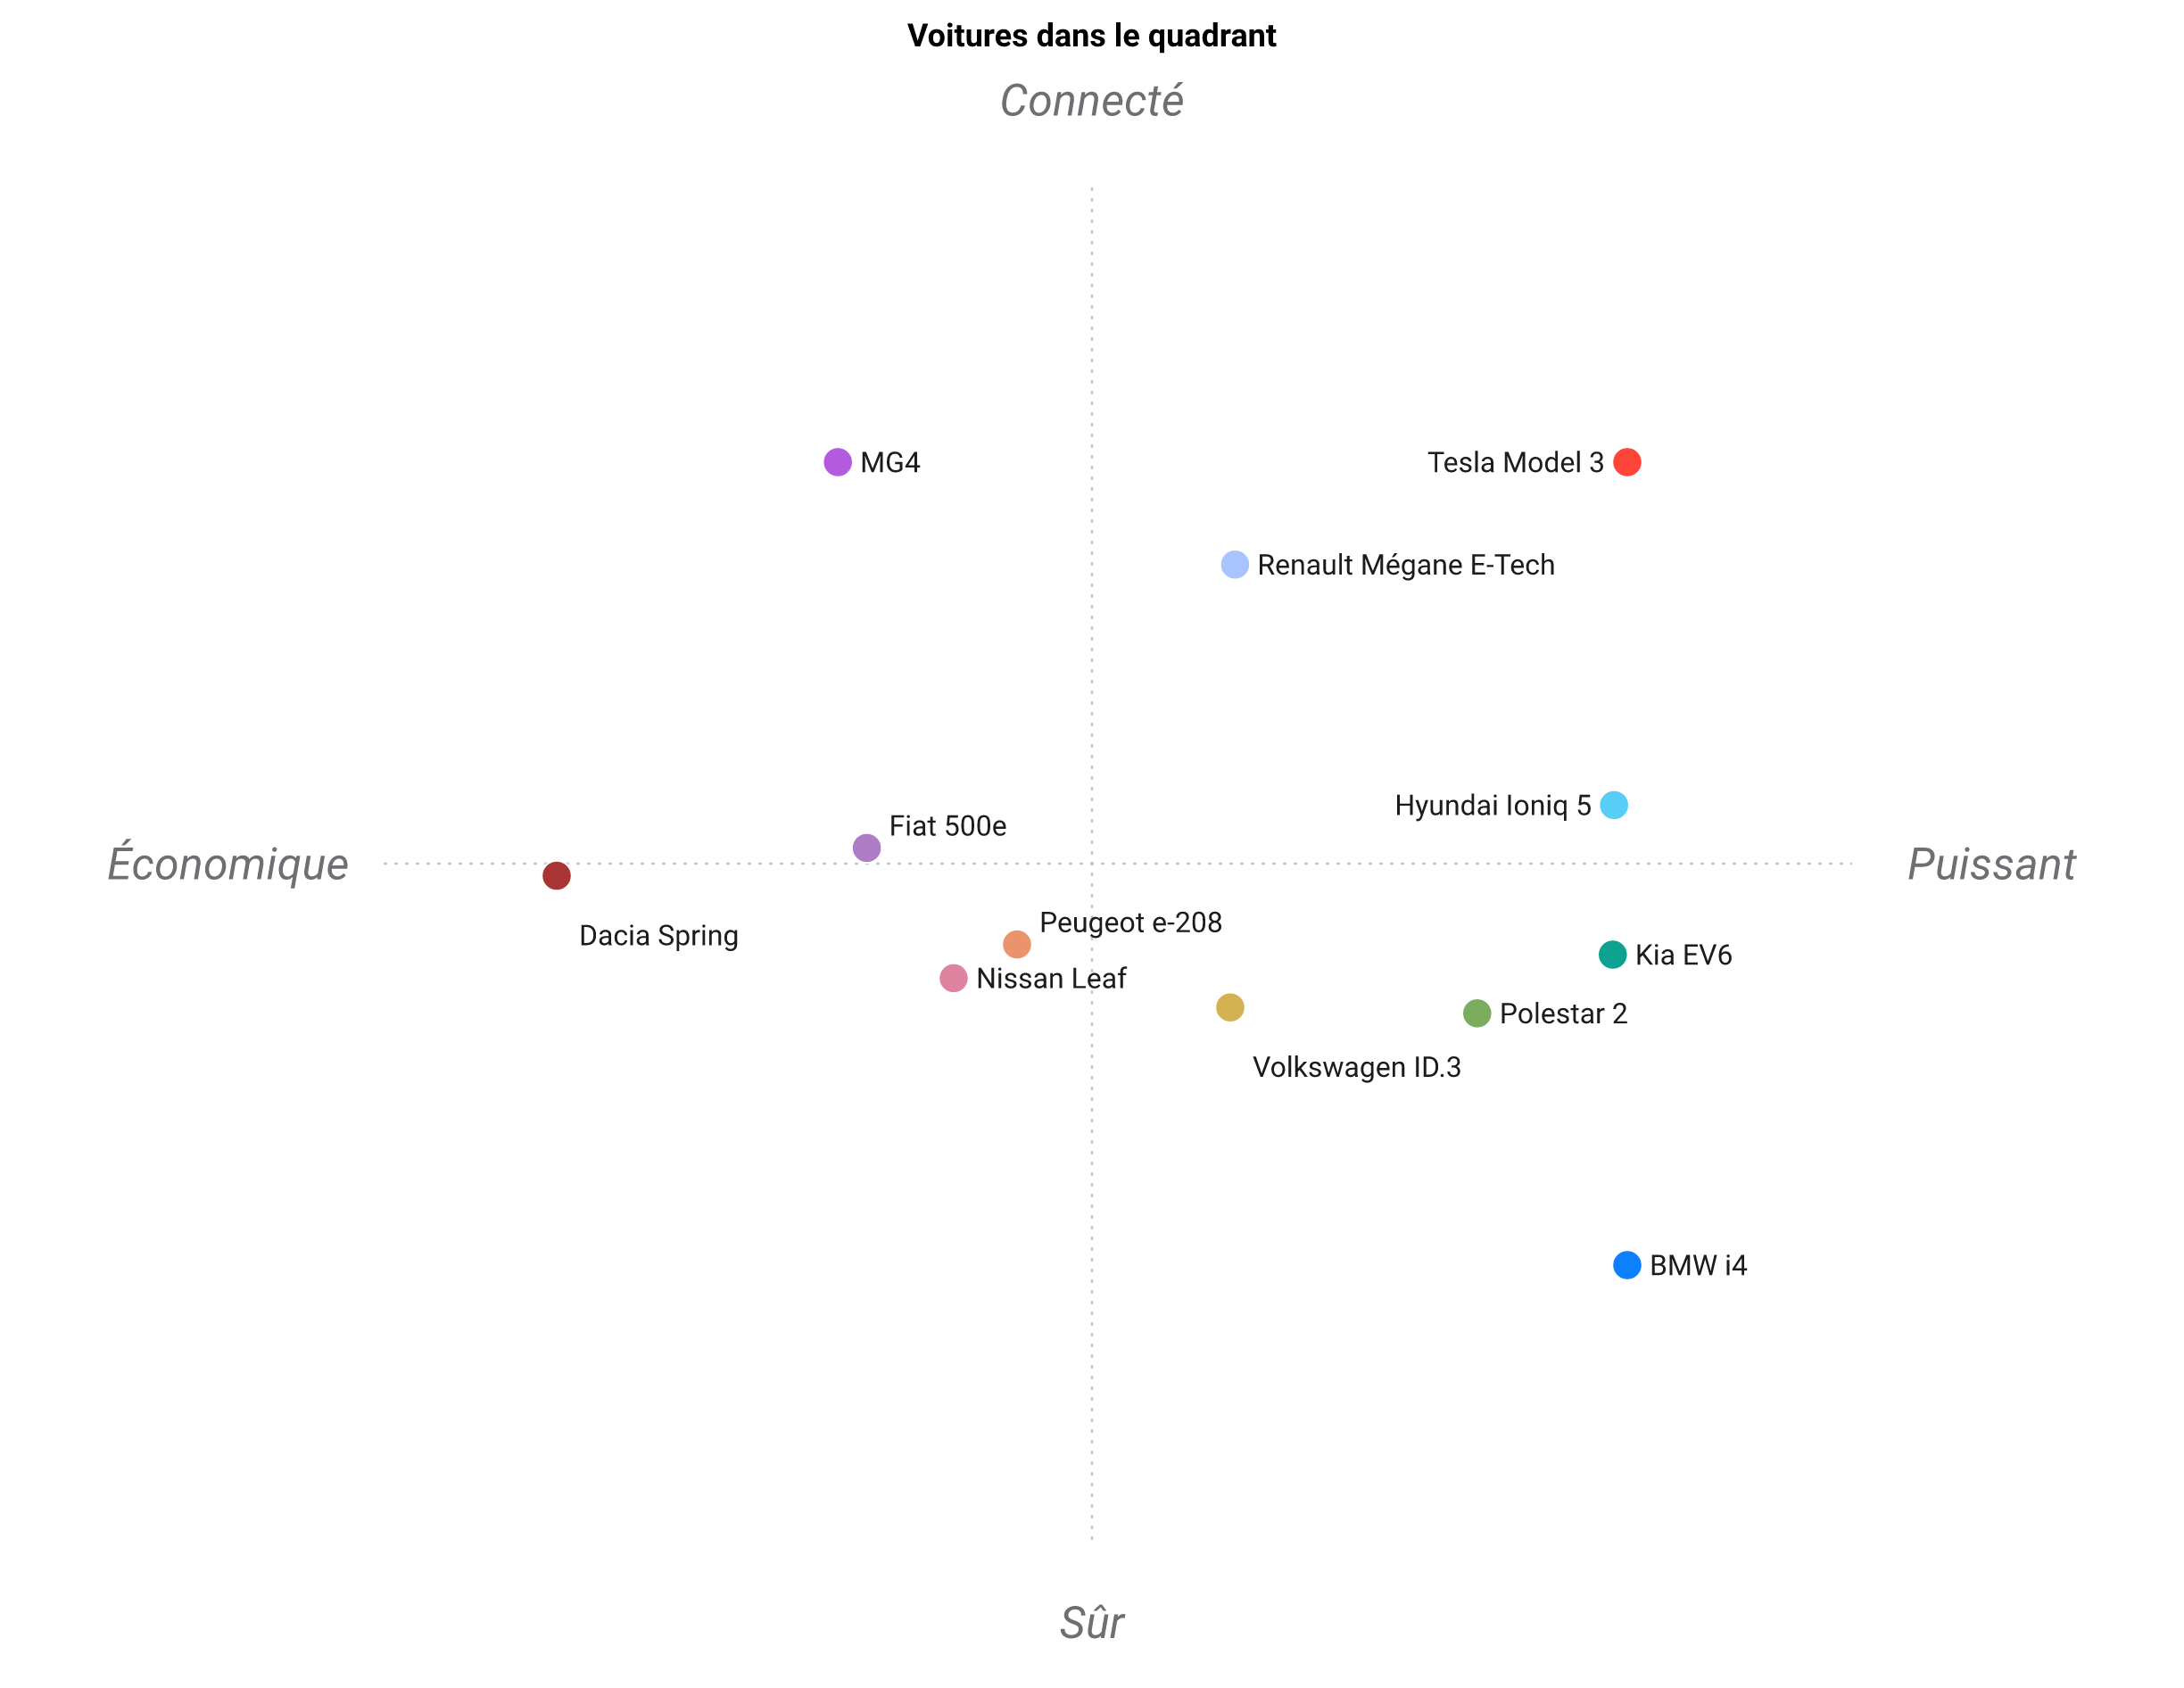
- Multilingual: axis names, the written analysis, and the figure title come out in the table's own language (English, French, or Spanish), auto-detected from the column names — a French table reads Voitures dans le quadrant.
- Reference-oriented: the option you care about is rotated to the top-right; an all-max reference is placed just past the best competitor rather than as an outlier.
- Four highlighted options: the leader, the weakest overall, and the two challengers that reach furthest toward the top and right poles.
- Polarity aware: mark a lower-is-better column with
(↓)(or--lower) and Standpoint names the benefit (Affordable, Portable), never the drawback. - Deterministic fallback:
--no-llmneeds no model and no network at all. - Vision self-check:
--checkasks a local vision model whether the figure reads correctly (leader top-right, labels legible, legend visible).
Two surfaces, one toolkit — every operation is reachable as:
- Library:
import standpoint as sp. - CLI ×2:
standpoint(argparse, always installed) andstandpoint-click(click twin) with identical flags.
Installation
Prerequisites — Python 3.10–3.13 and git, cross-platform:
- 🍎 macOS (Homebrew):
brew install python git - 🐧 Ubuntu/Debian:
sudo apt update && sudo apt install -y python3 python3-pip git - 🪟 Windows (PowerShell):
winget install Python.Python.3.12 Git.Git
For axis names and the written analysis, install Ollama and pull
the default model once (optional — skip it and use --no-llm):
- 🍎 macOS:
brew install ollama— thenollama serve &andollama pull qwen2.5vl:7b - 🐧 Ubuntu/Debian:
curl -fsSL https://ollama.com/install.sh | sh— thenollama pull qwen2.5vl:7b - 🪟 Windows: install from ollama.com/download, then
ollama pull qwen2.5vl:7b
We recommend a Python environment. If you're new to that, see 🥸 Tech tips.
From PyPI (recommended)
pip install standpoint
From source
git clone https://github.com/warith-harchaoui/standingpoint.git
cd standingpoint
pip install -e .          # or: pip install -r requirements.txt
Or install straight from GitHub (the import name is standpoint):
pip install "git+https://github.com/warith-harchaoui/standingpoint.git@v0.2.0"
Usage
standpoint examples/programming_languages.csv --outdir out
# without installing: python3 -m standpoint examples/programming_languages.csv --outdir out
Two equivalent CLIs are installed: standpoint (argparse) and standpoint-click.
As a library:
import standpoint as sp

pos = sp.positioning("examples/programming_languages.csv")
pos.export("out")                 # writes out/python.{png,svg,white.png,white.svg,vl.json,md,yaml}
print(pos.axes)
# {'x': 'Concurrency ↔ Ecosystem', 'y': 'Safety ↔ Learning'}
Skip the model for a fast, deterministic run (no Ollama needed):
standpoint my_table.csv --no-llm
standpoint my_table.csv --model qwen3:8b
More in EXAMPLES.md.
Input format
A CSV or Markdown table. The first column holds the option names; the rest are numeric criteria on any scale. Higher means better. Empty cells are filled with the column's minimum, so a missing rating never helps an option.
| Language | Performance | Ease of Learning | Ecosystem | Type Safety | Job Market |
|---|---|---|---|---|---|
| Python | 2 | 5 | 5 | 2 | 5 |
| Rust | 5 | 2 | 3 | 5 | 3 |
| Go | 4 | 4 | 4 | 4 | 4 |
The first row is the reference and goes to the top right. Change it with
--reference "<name>". Mark a lower-is-better column with (↓), e.g.
Price (↓), or list it in --lower.
How it works
- Standardize each criterion to mean 0 and standard deviation 1. PCA is sensitive to scale, so this puts every criterion on equal footing.
- Run PCA and keep two components. The axes stay as weighted sums of the original columns, so you can read them.
- Rotate the map so the reference sits top right. If the reference scores top marks on everything, it is placed just past the best competitor on each axis rather than far off on its own.
- Label it. The four highlighted options (leader, weakest, and the two challengers furthest toward the top and right poles) come straight from the map geometry. Each option takes its own colour from its position. A local model reads the loadings and names the four axis ends, as positive qualities, in your columns' language (English, French, or Spanish).
The figure keeps to a dotted cross for the axes, the pole words at the ends, labels only where they fit, and a legend for the rest.
Notes
- Axis names come from a local model. A guard keeps them positive, distinct, and
free of acronyms; a larger
--modelhelps, and--checkasks the vision model whether the figure reads correctly. - Higher is better by default. For a column where lower is better, mark its header
with
(↓)(Price (↓),Latency (↓)) or pass--lower Price,Latency. Standpoint negates it and names the pole for the benefit ("Affordable", "Portable"), never the drawback. - Every figure is written twice: a transparent
.png/.svgthat drops onto any page, and a white-background.white.png/.white.svgfor dark surfaces where the near-black labels would otherwise vanish on transparency. - It is a 2D projection. The axes carry a stated fraction of the variance, so read it as a summary rather than the whole picture.
Examples
Tracked in examples/, input CSV and generated figures:
| Table | Language | Leader |
|---|---|---|
programming_languages.csv |
en | Python |
cloud_providers.csv |
en | AWS |
laptops.csv |
en | MacBook Air (uses Price (↓) / Weight (↓)) |
voitures_electriques.csv |
fr | Tesla Model 3 |
Development
pip install -r requirements-dev.txt   # or: pip install -e ".[dev]"
python3 -m pytest tests/ -q           # deterministic tests; model-backed ones auto-skip
python3 -m ruff check standpoint tests
python3 -m ruff format --check standpoint tests
The coding standard for this repository is CODING.md; the contribution and versioning policy is in CONTRIBUTING.md.
Credits
PCA perceptual maps are standard (factoextra and FactoMineR in R, prince and
pca in Python); using a model to read the components is a newer idea. Colours
come from the "Good Colors" palette.
Figures are rendered by vl-convert over
Vega-Lite.
Author
License
BSD 3-Clause, the same license as scikit-learn. See
LICENSE.
1 maintainer

Download files
Download the file for your platform. If you're not sure which to choose, learn more about installing packages.
Source Distribution
Built Distribution
Filter files by name, interpreter, ABI, and platform.
If you're not sure about the file name format, learn more about wheel file names.
Copy a direct link to the current filters
File details
Details for the file standpoint-0.2.0.tar.gz.
File metadata
- Download URL: standpoint-0.2.0.tar.gz
- Upload date:
- Size: 44.7 kB
- Tags: Source
- Uploaded using Trusted Publishing? No
- Uploaded via:
twine/6.2.0 CPython/3.13.13
File hashes
| Algorithm | Hash digest | |
|---|---|---|
| SHA256 |
f5d7cfd1e883f53a2114daac7297d798b0d6a5659b6c2b429618fcbe1f23796e
|
|
| MD5 |
7eb0b7e89c31b43de4f46f1838d0f570
|
|
| BLAKE2b-256 |
014a359b9a5b536c6850014c3287f9e9a8dea9018141de8519105ff7f80c0bb1
|
File details
Details for the file standpoint-0.2.0-py3-none-any.whl.
File metadata
- Download URL: standpoint-0.2.0-py3-none-any.whl
- Upload date:
- Size: 34.7 kB
- Tags: Python 3
- Uploaded using Trusted Publishing? No
- Uploaded via:
twine/6.2.0 CPython/3.13.13
File hashes
| Algorithm | Hash digest | |
|---|---|---|
| SHA256 |
7048f1abd0d1c0055ac6ea4fe3f3be5b33f0bfa1cbf70397a4569a0c32d0a2a6
|
|
| MD5 |
92e30768544d12824a917e3deac65339
|
|
| BLAKE2b-256 |
8d44bbd4debf43757235258ed3575008f154b02b268c121ff33465657935138b
|














