A Python package for benchmarking weather forecasts against weather station data


Project description
StationBench


StationBench is a Python library for benchmarking weather forecasts against weather station data. It provides tools to calculate metrics, visualize results, and compare different forecast models.
Features
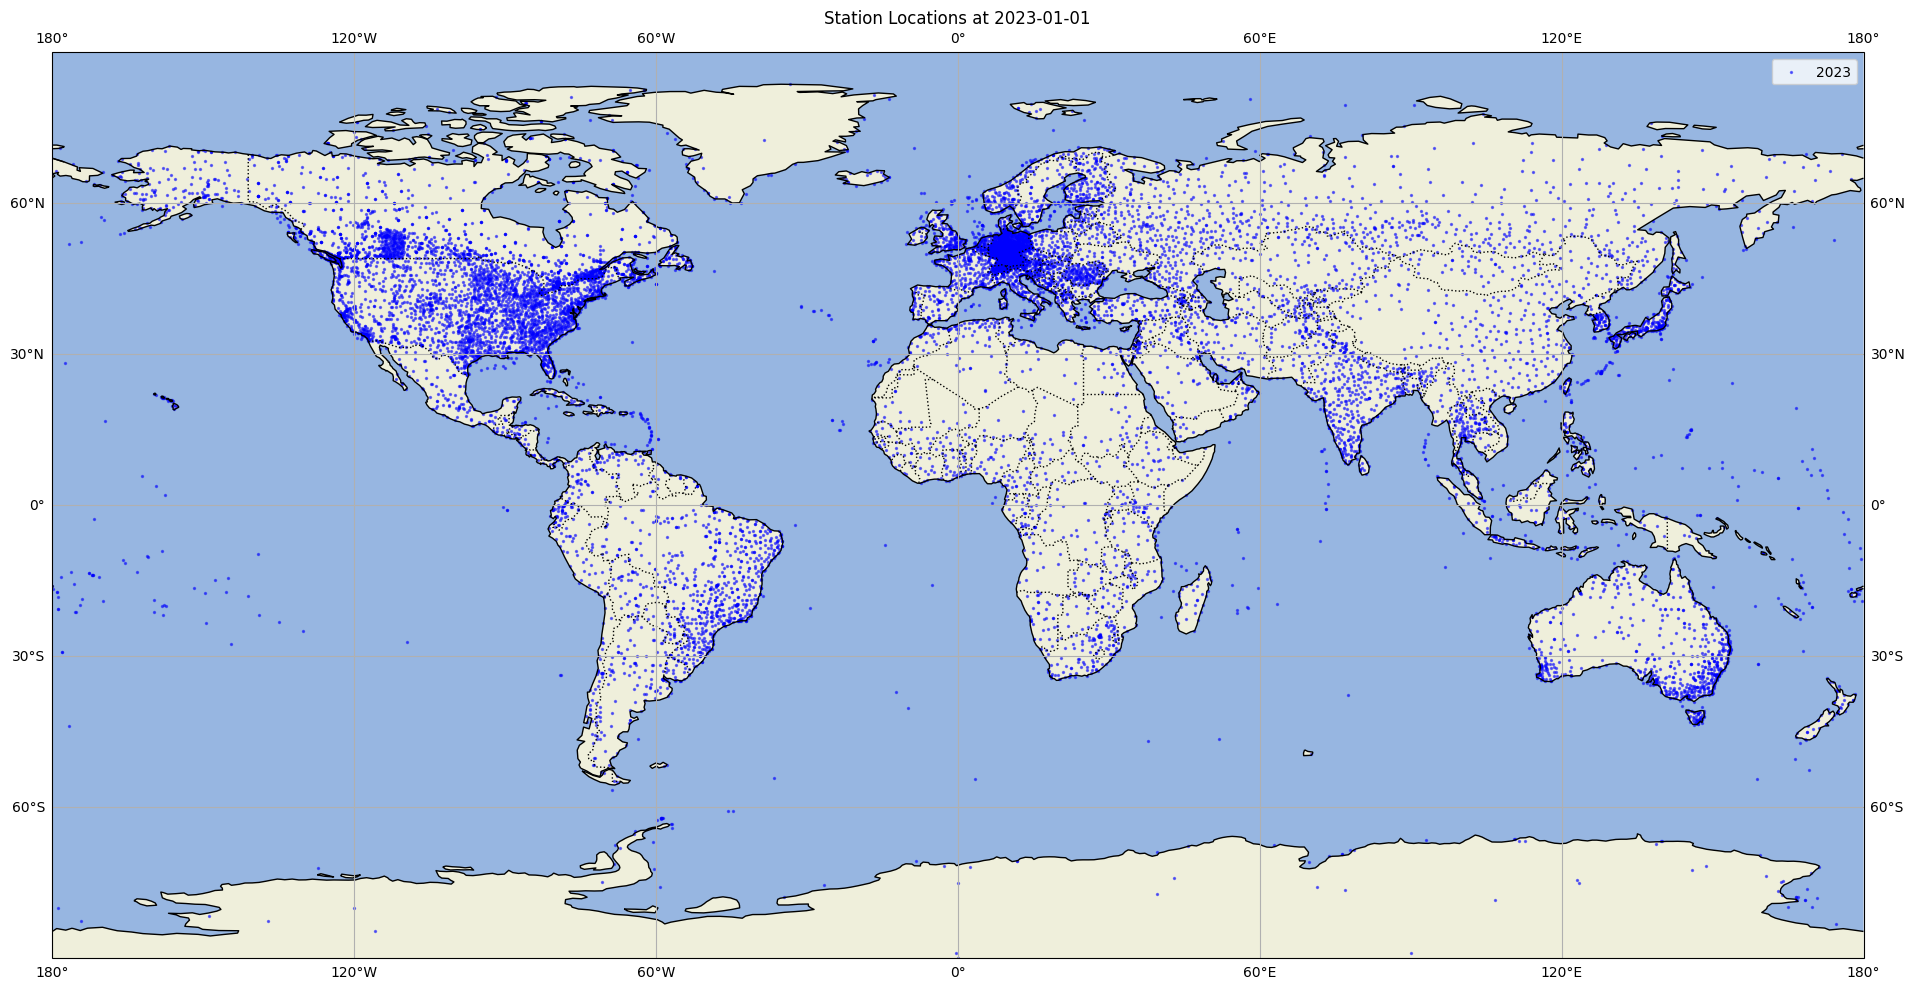
- Pre-processed ground truth data from 10,000+ weather stations around the world included in the package
- Calculate RMSE and other metrics between forecasts and ground truth data
- Support for multiple weather variables (temperature, wind speed, solar radiation)
- Regional analysis capabilities (Europe, North America, Global, etc.)
- Integration with Weights & Biases for experiment tracking
Installation
pip install stationbench
Documentation
Full documentation is available in the docs/ directory:
Quick Start
Data Format Requirements
Forecast Data
- Must include dimensions: latitude, longitude, time
- Variables should include:
- 10m_wind_speed (or custom name)
- 2m_temperature (or custom name)
Ground Truth Data
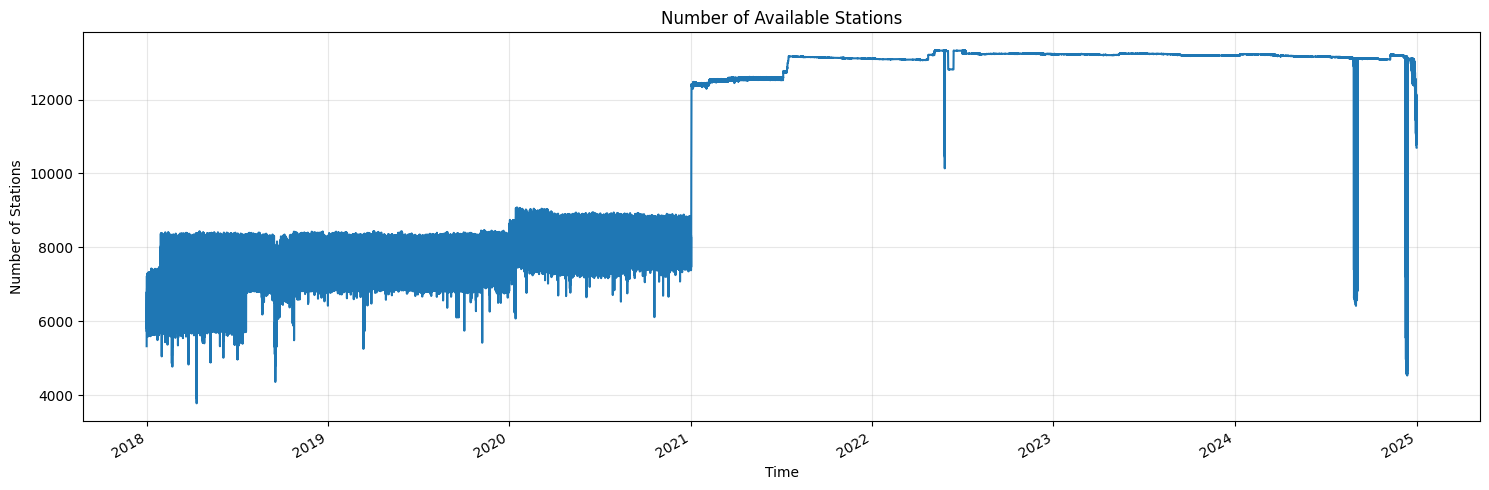
Stationbench comes with ready-to-use weather stations from around the world. The benchmarking data is a subset of the Meteostat dataset. It contains weather data from 2018-2024 for 10m wind speed and 2m temperature. The data is provided by the following organizations:
- Deutscher Wetterdienst
- NOAA
- Government of Canada
- MET Norway
- European Data Portal
- Offene Daten Österreich
Source: Meteostat (CC BY-NC 4.0)
The benchmarking data can be accessed from https://opendata.jua.sh/stationbench/meteostat_benchmark.zarr.
Besides the provided benchmarking data, you can also use your own ground truth data. The ground truth data must be in zarr format and must include the following dimensions and coordinates:
- Must include dimensions: station_id, time
- Must include coordinates: latitude, longitude
Calculate Metrics
This script computes metrics by comparing forecast data against ground truth data for specified time periods and regions. Output are RMSE, MBE and skill scores for different variables and lead times in the format of the ground truth data.
Options
--forecast: Location of the forecast data (required)--stations: Location of the ground truth data (defaults to https://opendata.jua.sh/stationbench/meteostat_benchmark.zarr)--start_date: Start date for benchmarking (required)--end_date: End date for benchmarking (required)--output: Output path for benchmarks (required)--region: Region to benchmark (seeregions.pyfor available regions)--name_10m_wind_speed: Name of 10m wind speed variable (optional)--name_2m_temperature: Name of 2m temperature variable (optional)--use_dask: Enable parallel computation with Dask (recommended for datasets >10GB)--n_workers: Number of Dask workers to use (default: 4, only used if --use_dask is set and no client exists)
If variable name is not provided, no metrics will be computed for that variable.
Compare forecasts
After generating the metrics, you can use the compare_forecasts.py script to compute metrics, create visualizations, and log the results to Weights & Biases (W&B).
What it does
The compare_forecasts.py script:
- Computes RMSE (Root Mean Square Error) and skill scores for different variables and lead time ranges.
- Generates geographical scatter plots showing the spatial distribution of errors.
- Creates line plots showing the temporal evolution of errors.
- Saves all visualizations and metrics to a directory, optionally logs to Weights & Biases.
Options
--benchmark_datasets_locs: Dictionary of reference benchmark locations, the skill score is computed between the first and the second dataset (required)--regions: Comma-separated list of regions, seeregions.pyfor available regions (required)--wandb_run_name: Weights & Biases run name (optional), if not provided, Weights & Biases will not be used--output_dir: Output directory for results (optional, defaults tostationbench-results)
Usage
StationBench can be used either as a Python package or through command-line interfaces.
Python Package Usage
import stationbench

# Calculate metrics
stationbench.calculate_metrics(
    forecast="path/to/forecast.zarr",
    start_date="2023-01-01",
    end_date="2023-12-31",
    output="path/to/forecast_metrics.zarr",
    region="europe",
    name_10m_wind_speed="10si",
    name_2m_temperature="2t"
)

# Compare forecasts
stationbench.compare_forecasts(
    benchmark_datasets_locs={"HRES": "path/to/hres_metrics.zarr", "ENS": "path/to/ens_metrics.zarr"},
    regions=["europe"]
)
Command-Line Usage
Calculate metrics for a forecast dataset:
stationbench-calculate \
    --forecast path/to/forecast.zarr \
    --start_date 2023-01-01 \
    --end_date 2023-12-31 \
    --output path/to/forecast_metrics.zarr \
    --region europe \
    --name_10m_wind_speed "10si" \
    --name_2m_temperature "2t"
    [--use_dask]  # Optional: Enable parallel computation with Dask
    [--n_workers 4]  # Optional: Number of Dask workers to use
For small datasets, it's recommended to run without Dask. For large datasets
(>10GB), enabling Dask with --use_dask can improve performance.
Compare forecasts:
stationbench-compare \
    --benchmark_datasets_locs '{"HRES": "path/to/hres_metrics.zarr", "ENS": "path/to/ens_metrics.zarr"}' \
    --regions europe \
    [--wandb_run_name "run_name"] \
    [--output_dir "path/to/output_dir"]
Contributing
We welcome contributions! Please see our CONTRIBUTING.md for details.
License
This project is licensed under the MIT License - see the LICENSE file for details.
Metrics
StationBench calculates the following verification metrics:
- RMSE (Root Mean Square Error): Measures the average magnitude of forecast errors, giving greater weight to larger errors
- MBE (Mean Bias Error): Measures the average direction and magnitude of forecast bias. Positive values indicate the forecast tends to overpredict, while negative values indicate underprediction.
We plan to add more benchmarking metrics in the future...
Regional Analysis
StationBench supports several predefined regions and allows you to create custom regions.
For details on creating and using custom regions, see the Custom Regions Guide.
Release history Release notifications | RSS feed


Download files
Download the file for your platform. If you're not sure which to choose, learn more about installing packages.
Source Distribution
Built Distribution
Filter files by name, interpreter, ABI, and platform.
If you're not sure about the file name format, learn more about wheel file names.
Copy a direct link to the current filters
File details
Details for the file stationbench-0.1.2.tar.gz.
File metadata
- Download URL: stationbench-0.1.2.tar.gz
- Upload date:
- Size: 16.2 kB
- Tags: Source
- Uploaded using Trusted Publishing? No
- Uploaded via: poetry/1.8.5 CPython/3.11.11 Darwin/24.3.0
File hashes
| Algorithm | Hash digest | |
|---|---|---|
| SHA256 |
2b6cce9ebcaf611b15b2a0992b6cc957ef5754caa16cddba76fdb5e628a0ef29
|
|
| MD5 |
ad3bdcc5b0f17a8fb33f179c9a93ac33
|
|
| BLAKE2b-256 |
3a575ef675bd50fedf72359ced03b5a88ef0b451cfce073f8cdf163c207de371
|
File details
Details for the file stationbench-0.1.2-py3-none-any.whl.
File metadata
- Download URL: stationbench-0.1.2-py3-none-any.whl
- Upload date:
- Size: 17.6 kB
- Tags: Python 3
- Uploaded using Trusted Publishing? No
- Uploaded via: poetry/1.8.5 CPython/3.11.11 Darwin/24.3.0
File hashes
| Algorithm | Hash digest | |
|---|---|---|
| SHA256 |
6656e4366c9e44c79b44eab0637bd7f78ca227fcfb082dee288a7efa05e374d9
|
|
| MD5 |
b921bdc5f8a28c3a1dde96671deb34a4
|
|
| BLAKE2b-256 |
2a80059ab6665c161d88f06c4fb7fbc90f7cdad20ff0dbce63ecf2c47e665300
|


