Classes for technical analysis of stocks.

Project description
Stock Analysis
Package for making elements of technical analysis of a stock easier. This package is meant to be a starting point for you to develop your own. As such, all the instructions for installing/setup will be assuming you will continue to develop on your end.
Usage
This section will show some of the functionality of each class; however, it is by no means exhaustive.
Getting data
from stock_analysis import StockReader

reader = StockReader("2017-01-01", "2018-12-31")

# get bitcoin data in USD
bitcoin = reader.get_bitcoin_data("USD")

# get faang data
fb, aapl, amzn, nflx, goog = (
    reader.get_ticker_data(ticker) for ticker in ["FB", "AAPL", "AMZN", "NFLX", "GOOG"]
)

# get S&P 500 data
sp = reader.get_index_data("S&P 500")
Grouping data
from stock_analysis import group_stocks, describe_group

faang = group_stocks(
    {"Facebook": fb, "Apple": aapl, "Amazon": amzn, "Netflix": nflx, "Google": goog}
)

# describe the group
describe_group(faang)
Building a portfolio
Groups assets by date and sums columns to build a portfolio.
from stock_analysis import make_portfolio

faang_portfolio = make_portfolio(faang)
Visualizing data
Be sure to check out the other methods here for different plot types, reference lines, shaded regions, and more!
Single asset
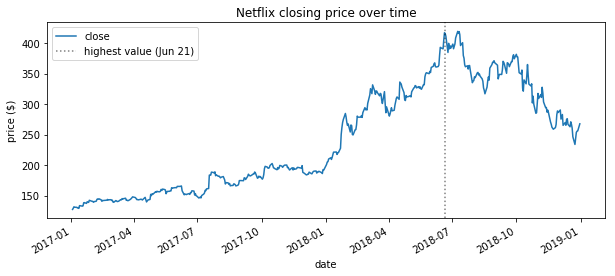
Evolution over time:
import matplotlib.pyplot as plt
from stock_analysis import StockVisualizer

netflix_viz = StockVisualizer(nflx)

ax = netflix_viz.evolution_over_time(
    "close", figsize=(10, 4), legend=False, title="Netflix closing price over time"
)
netflix_viz.add_reference_line(
    ax,
    x=nflx.high.idxmax(),
    color="k",
    linestyle=":",
    label=f"highest value ({nflx.high.idxmax():%b %d})",
    alpha=0.5,
)
ax.set_ylabel("price ($)")
plt.show()
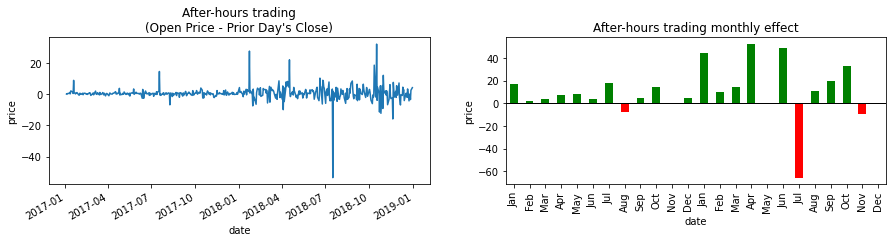
After hours trades:
netflix_viz.after_hours_trades()
plt.show()
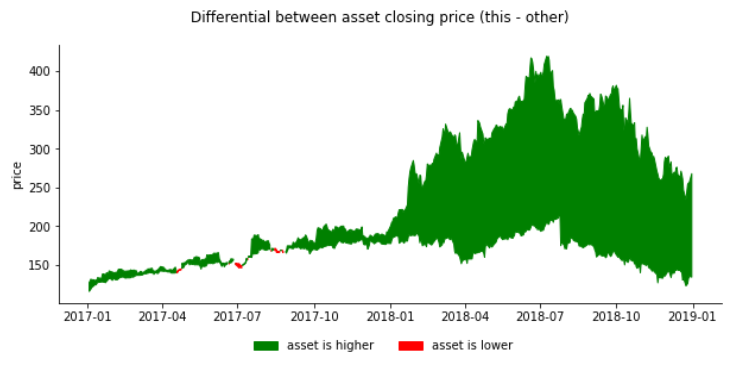
Differential in closing price versus another asset:
netflix_viz.fill_between_other(fb)
plt.show()
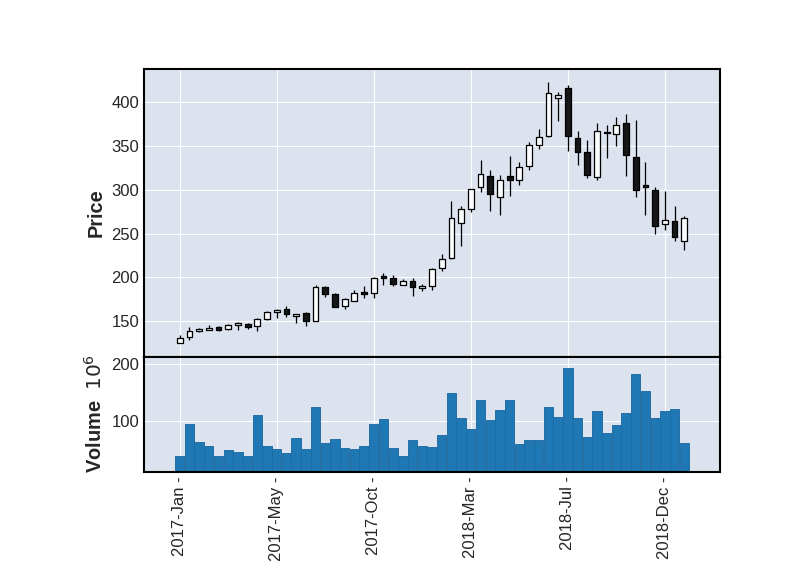
Candlestick plots with resampling (uses mplfinance):
netflix_viz.candlestick(
    resample="2W", volume=True, xrotation=90, datetime_format="%Y-%b -"
)
Note: run help() on StockVisualizer for more visualizations
Asset groups
Correlation heatmap:
from stock_analysis import AssetGroupVisualizer

faang_viz = AssetGroupVisualizer(faang)
faang_viz.heatmap(True)
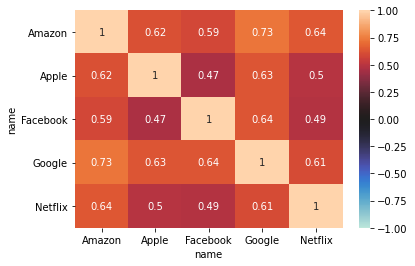
Note: run help() on AssetGroupVisualizer for more visualizations. This object has many of the visualizations of the StockVisualizer class.
Analyzing data
Below are a few of the metrics you can calculate.
Single asset
from stock_analysis import StockAnalyzer

nflx_analyzer = stock_analysis.StockAnalyzer(nflx)
nflx_analyzer.annualized_volatility()
Asset group
Methods of the StockAnalyzer class can be accessed by name with the AssetGroupAnalyzer class's analyze() method.
from stock_analysis import AssetGroupAnalyzer

faang_analyzer = AssetGroupAnalyzer(faang)
faang_analyzer.analyze("annualized_volatility")

faang_analyzer.analyze("beta")
Modeling
from stock_analysis import StockModeler
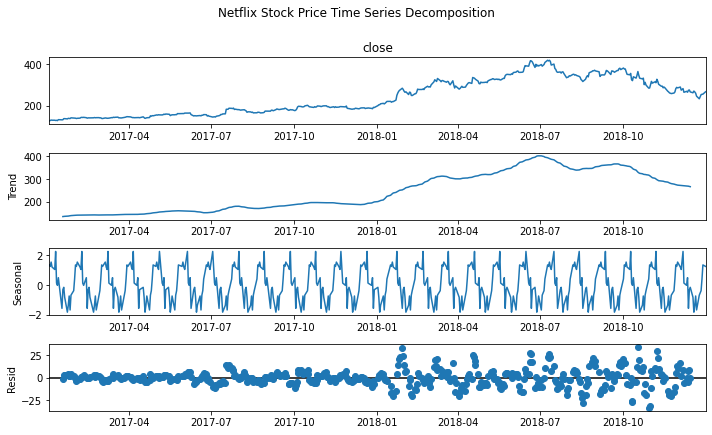
Time series decomposition
decomposition = StockModeler.decompose(nflx, 20)
fig = decomposition.plot()
plt.show()
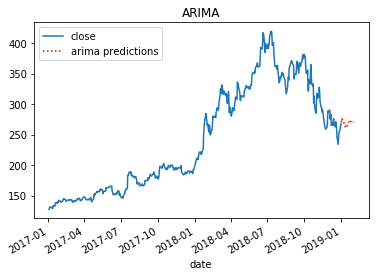
ARIMA
Build the model:
arima_model = StockModeler.arima(nflx, 10, 1, 5)
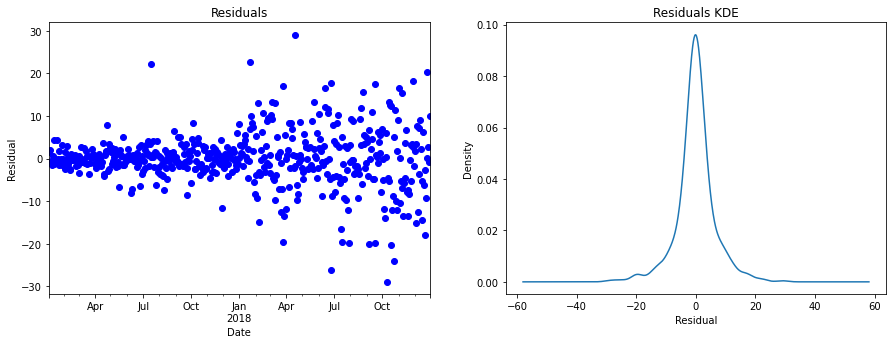
Check the residuals:
StockModeler.plot_residuals(arima_model)
plt.show()
Plot the predictions:
arima_ax = StockModeler.arima_predictions(
    arima_model, start=start, end=end, df=nflx, ax=axes[0], title="ARIMA"
)
plt.show()
Linear regression
Build the model:
X, Y, lm = StockModeler.regression(nflx)
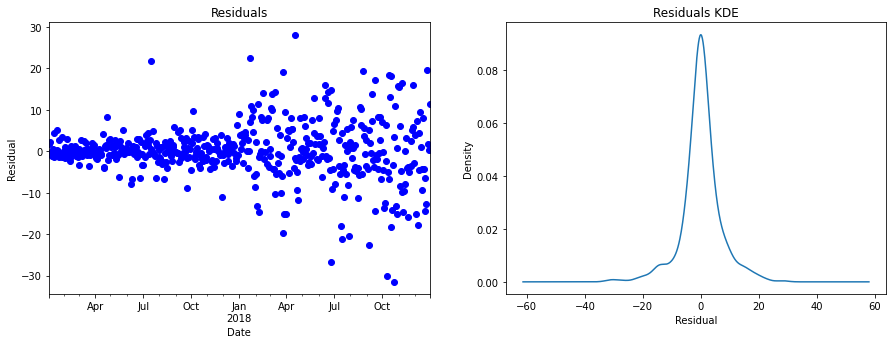
Check the residuals:
StockModeler.plot_residuals(lm)
plt.show()
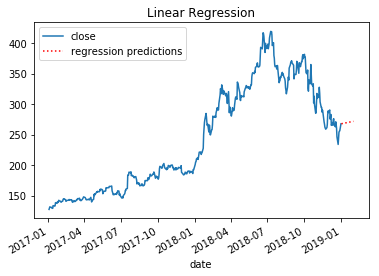
Plot the predictions:
linear_reg = StockModeler.regression_predictions(
    lm, start=start, end=end, df=nflx, ax=axes[1], title="Linear Regression"
)
plt.show()


Download files
Download the file for your platform. If you're not sure which to choose, learn more about installing packages.
Source Distribution
Built Distribution
Filter files by name, interpreter, ABI, and platform.
If you're not sure about the file name format, learn more about wheel file names.
Copy a direct link to the current filters
File details
Details for the file stock-analyser-0.3.7.tar.gz.
File metadata
- Download URL: stock-analyser-0.3.7.tar.gz
- Upload date:
- Size: 17.4 kB
- Tags: Source
- Uploaded using Trusted Publishing? No
- Uploaded via: twine/4.0.2 CPython/3.9.16
File hashes
| Algorithm | Hash digest | |
|---|---|---|
| SHA256 |
a782f5147d3ef31adffd953dd3f1168fbbb556f5ee19c1e3452cf8c5757b077e
|
|
| MD5 |
87930d1c9e35ad5047d1a697dcb25613
|
|
| BLAKE2b-256 |
0236adca62c367fa13c7d6944eff3096d2eee696615b836f169f5124e883ad30
|
File details
Details for the file stock_analyser-0.3.7-py3-none-any.whl.
File metadata
- Download URL: stock_analyser-0.3.7-py3-none-any.whl
- Upload date:
- Size: 17.5 kB
- Tags: Python 3
- Uploaded using Trusted Publishing? No
- Uploaded via: twine/4.0.2 CPython/3.9.16
File hashes
| Algorithm | Hash digest | |
|---|---|---|
| SHA256 |
e38c410aed300eab86f76b74da8c87f0621ca9c939f189b8abec6f1fb5e2f4a0
|
|
| MD5 |
5b51e4932aabc46a10f8de5710dbc47d
|
|
| BLAKE2b-256 |
ac2805d2c45945faafc8c343ebf020c5e7b05ceae53c41836bc560e37ee2b06b
|


