A CLI tool to track stock portfolios with AI-powered analysis and automated GitHub Actions reporting.

Project description
Stock Tracker CLI


A command-line tool to track your stock portfolio and get AI-powered investment analysis.
Features
Core Features
- 📊 Portfolio Management: Add and remove stock positions with purchase prices
- 💹 Real-time Data: Fetch current stock prices using Alpha Vantage API
- 🤖 AI Analysis: Get intelligent insights using Groq's LLM (llama-3.3-70b-versatile)
- 📧 Email Reports: Send HTML-formatted reports with AI analysis via email
- ⚡ Smart Caching: 15-minute cache to reduce API calls
- 🐳 Docker Support: Containerized deployment with automated scheduled reports
- 🚨 GitHub Actions Automation: Scheduled and event-based reporting with Tavily API integration
- 📰 Market Event Detection: Automatically trigger reports when significant market events affect your portfolio
- 📈 Portfolio History: Track portfolio performance over time with daily snapshots and time-period analysis
- 🔔 Price Alerts: Set price alerts for stocks with customizable above/below thresholds
- 👀 Watchlist: Track stocks you're interested in without adding them to your portfolio
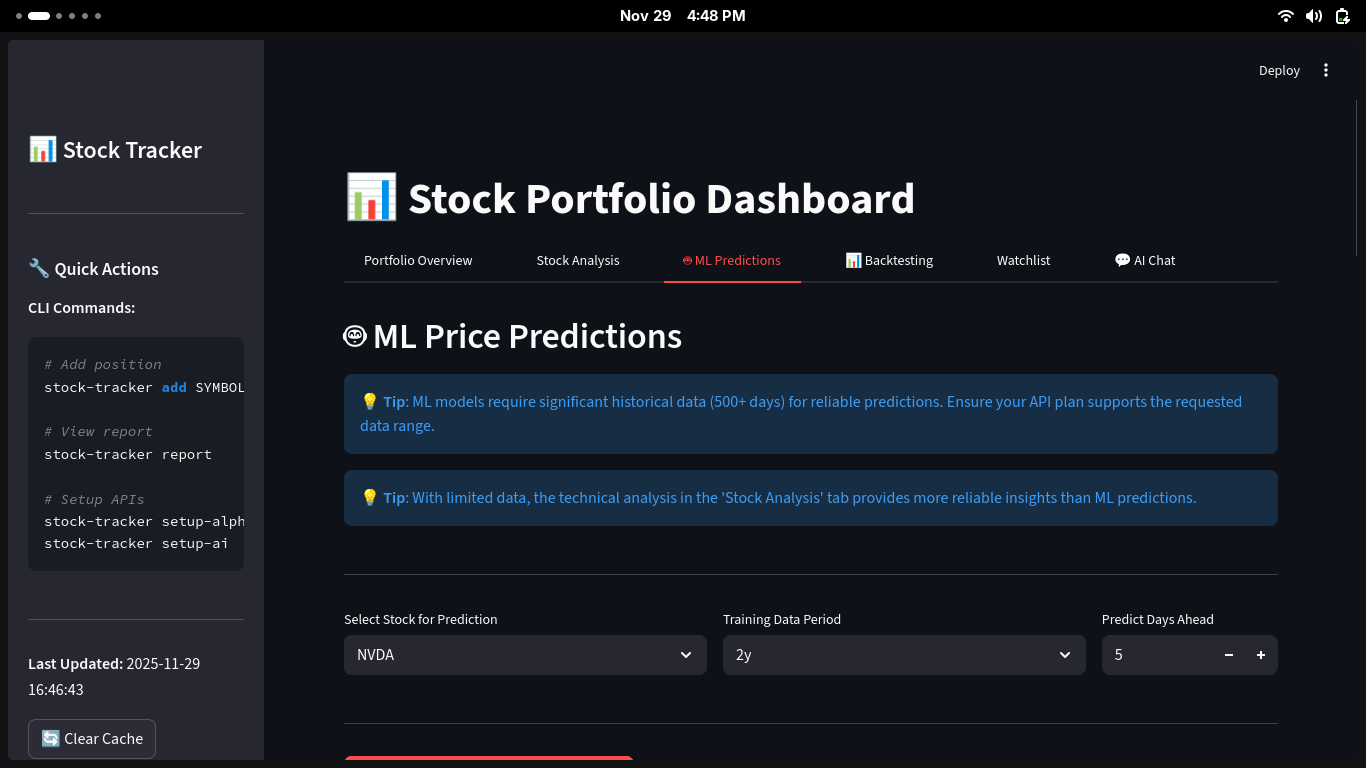
🆕 Interactive Dashboard (Streamlit UI)
- 📊 Real-time Portfolio Dashboard: Visual overview of your entire portfolio with interactive charts
- 📈 Advanced Price Charts: Candlestick charts with technical indicators (RSI, MACD, Bollinger Bands, Moving Averages)
- 🥧 Portfolio Composition: Pie charts showing asset allocation
- 📉 Performance Analytics: Visual gain/loss tracking for each position
- 🎯 Technical Signals: Automated buy/sell signals based on technical indicators
- 🔄 Multi-timeframe Analysis: Analyze stocks across different time periods (1M, 3M, 6M, 1Y, 2Y, 5Y, Max)
- 📊 Interactive Indicators: Toggle between different technical indicators in real-time
Installation
From PyPI
pip install stock-tracker-cli
From Source
git clone https://github.com/Chukwuebuka-2003/stock_cli.git
cd stock_cli
pip install -e .
Quick Start
1. Configure API Keys
# Setup Groq API key for AI analysis
stock-tracker setup-ai

# Setup Alpha Vantage API key for stock data
stock-tracker setup-alpha-vantage

# Setup email settings (optional, for email reports)
stock-tracker setup-email
Get Free API Keys:
- Groq: https://console.groq.com/
- Alpha Vantage: https://www.alphavantage.co/support/#api-key
2. Add Stock Positions
# Add a stock position
stock-tracker add AAPL 10 150.00

# Arguments: SYMBOL QUANTITY PURCHASE_PRICE
stock-tracker add MSFT 5 300.00
stock-tracker add GOOGL 3 2800.00
3. Generate Reports
# View portfolio report in terminal
stock-tracker report

# Get AI-powered analysis
stock-tracker ai-report

# Send AI report via email
stock-tracker ai-report --email recipient@example.com
Commands
Portfolio Management
# Add a stock position
stock-tracker add <SYMBOL> <QUANTITY> <PURCHASE_PRICE>

# Remove a stock position
stock-tracker remove <SYMBOL>
Reports
# Generate plain text report
stock-tracker report

# Generate AI-powered analysis report
stock-tracker ai-report [--email EMAIL]
Configuration
# Configure Groq API key
stock-tracker setup-ai

# Configure Alpha Vantage API key
stock-tracker setup-alpha-vantage

# Configure email settings
stock-tracker setup-email
Portfolio History
# Take a snapshot of your current portfolio
stock-tracker history snapshot

# View performance over time
stock-tracker history show --period 7d    # Last 7 days
stock-tracker history show --period 30d   # Last 30 days
stock-tracker history show --period 90d   # Last 90 days
stock-tracker history show --period 1y    # Last year
stock-tracker history show --period all   # All time (default)
Price Alerts
# Add a price alert
stock-tracker alert add AAPL --above 200           # Alert when AAPL goes above $200
stock-tracker alert add TSLA --below 180           # Alert when TSLA goes below $180
stock-tracker alert add MSFT --above 400 --below 350  # Dual threshold alert

# List all alerts
stock-tracker alert list
stock-tracker alert list --active-only    # Show only non-triggered alerts
stock-tracker alert list --symbol AAPL    # Filter by symbol

# Check alerts against current prices
stock-tracker alert check

# Remove an alert
stock-tracker alert remove alert_1
Watchlist
# Add stocks to watchlist
stock-tracker watchlist add NVDA
stock-tracker watchlist add GOOGL --note "Considering for tech exposure"

# List all watchlist stocks
stock-tracker watchlist list

# Generate detailed watchlist report with current prices
stock-tracker watchlist report

# Remove a stock from watchlist
stock-tracker watchlist remove NVDA
🆕 Interactive Dashboard (Streamlit UI)
Launch the interactive web-based dashboard for a visual portfolio experience:
# Launch the Streamlit dashboard
streamlit run src/streamlit_app.py

# Or use the command after installation
stock-tracker-ui
The dashboard will open in your default web browser at http://localhost:8501
Dashboard Features
📊 Portfolio Overview Tab
- Real-time portfolio metrics (total value, cost basis, gain/loss)
- Interactive pie chart showing portfolio composition by stock
- Bar chart displaying individual stock performance
- Detailed positions table with color-coded gains/losses
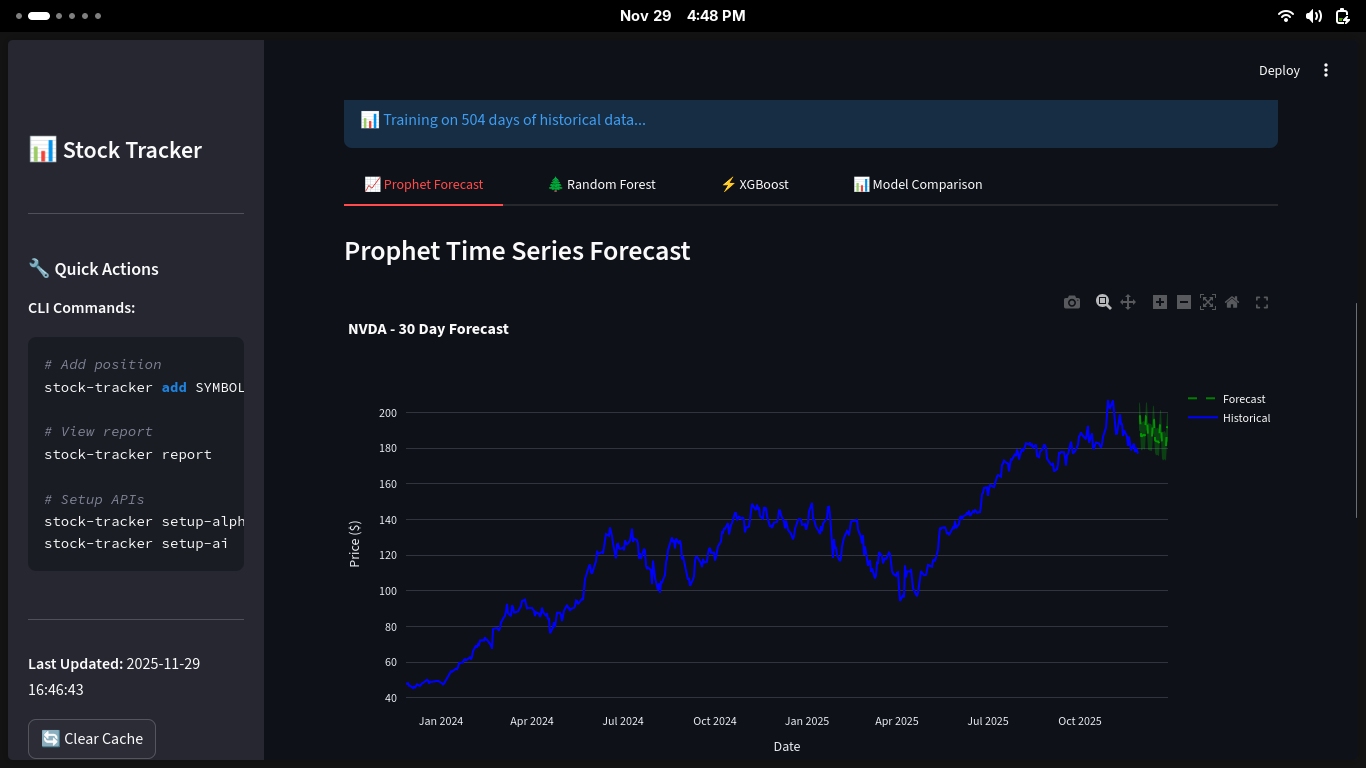
📈 Stock Analysis Tab
- Select any stock from your portfolio
- Choose time periods: 1 month, 3 months, 6 months, 1 year, 2 years, 5 years, or maximum
- Interactive candlestick charts with zoom and pan capabilities
- Technical indicators overlay:
- Moving Averages: SMA 20, SMA 50, SMA 200
- Bollinger Bands: Upper, middle, and lower bands
- RSI (Relative Strength Index): Overbought/oversold levels
- MACD: Signal line and histogram
- Automated technical signals (bullish/bearish/neutral)
- Volume bars with price correlation
👀 Watchlist Tab
- Real-time prices for all watchlist stocks
- Quick view of price changes and percentages
- Notes for each watched stock
Dashboard Screenshots
The dashboard provides:
- ✨ Modern, responsive design
- 🎨 Color-coded metrics (green for gains, red for losses)
- 📱 Works on desktop and tablet
- ⚡ Auto-refreshing data with cache management
- 🔄 Manual refresh button for instant updates
Keyboard Shortcuts & Tips
- Use the sidebar for quick CLI command reference
- Click "Clear Cache" in the sidebar to force fresh data fetch
- All charts are interactive - hover for details, zoom, and pan
- Charts can be downloaded as PNG images using the toolbar
Example Output
Stock Portfolio Report
Generated on: 2025-11-09 10:30:00

╔════════╦══════════╦════════════════╦═══════════════╦════════════╦═════════════════╗
║ Symbol ║ Quantity ║ Purchase Price ║ Current Price ║    Value   ║ Gain/Loss (%)   ║
╠════════╬══════════╬════════════════╬═══════════════╬════════════╬═════════════════╣
║  AAPL  ║   10.0   ║    $150.00     ║    $178.50    ║  $1,785.00 ║ +$285.00 (+19%) ║
║  MSFT  ║    5.0   ║    $300.00     ║    $385.20    ║  $1,926.00 ║ +$426.00 (+28%) ║
║ GOOGL  ║    3.0   ║   $2,800.00    ║   $2,950.00   ║  $8,850.00 ║ +$450.00 (+5%)  ║
╚════════╩══════════╩════════════════╩═══════════════╩════════════╩═════════════════╝

Portfolio Summary:
Total Value: $12,561.00
Total Gain/Loss: +$1,161.00 (+10.2%)
GitHub Actions Automation ⚡
NEW! Automate your stock reports with GitHub Actions - no server required!
Features
- 📅 Scheduled Reports: Daily, weekly, and monthly automated reports
- 🚨 Event-Based Triggers: Automatically generate reports when market events affect your portfolio
- 🔒 Secure: All credentials stored in GitHub Secrets
- 📧 Email Delivery: Reports sent directly to your inbox
- 🐳 Docker Execution: Containerized workflows for consistency
Quick Setup
-
Configure GitHub Secrets (Settings → Secrets → Actions):
GROQ_API_KEY ALPHA_VANTAGE_API_KEY TAVILY_API_KEY EMAIL_SMTP_SERVER EMAIL_SMTP_PORT EMAIL_ADDRESS EMAIL_PASSWORD EMAIL_RECIPIENT PORTFOLIO_POSITIONS -
Set Portfolio Positions (JSON format):
[{"symbol":"AAPL","quantity":10,"purchase_price":150.0},{"symbol":"GOOGL","quantity":5,"purchase_price":2800.0}]
-
Enable GitHub Actions in your repository settings
-
Done! Reports will be automatically generated and emailed on schedule
Workflows
- Scheduled Reports: Daily (8 AM UTC), Weekly (Mon 6 AM), Monthly (1st at 7 AM)
- Event-Based: Checks every 2 hours for market events affecting your portfolio
- Docker-Based: Containerized execution (8:30 AM UTC daily)
Get Started
📖 Complete Setup Guide - Detailed instructions with troubleshooting
Get Tavily API Key: https://tavily.com (Free tier: 1,000 credits/month)
Docker Deployment
Build and Run
# Build the image
docker build -t stock-tracker:latest .

# Run one-time report
docker run --rm stock-tracker:latest report

# Run AI report with email
docker run --rm \
  -e GROQ_API_KEY="your_key" \
  -e ALPHA_VANTAGE_API_KEY="your_key" \
  -e EMAIL_ADDRESS="your@gmail.com" \
  -e EMAIL_PASSWORD="app_password" \
  -e EMAIL_RECIPIENT="recipient@example.com" \
  -e PORTFOLIO_POSITIONS='[{"symbol":"AAPL","quantity":10,"purchase_price":150}]' \
  stock-tracker:latest ai-report --email
Environment Variables
Create a .env file:
GROQ_API_KEY=your_groq_api_key
ALPHA_VANTAGE_API_KEY=your_alpha_vantage_key
TAVILY_API_KEY=your_tavily_api_key
EMAIL_SMTP_SERVER=smtp.gmail.com
EMAIL_SMTP_PORT=587
EMAIL_ADDRESS=your_email@gmail.com
EMAIL_PASSWORD=your_app_password
EMAIL_RECIPIENT=recipient@example.com
PORTFOLIO_POSITIONS=[{"symbol":"AAPL","quantity":10,"purchase_price":150.0}]
Configuration Files
The CLI stores data in platform-specific directories:
- Linux:
~/.config/StockTrackerCLI/and~/.local/share/StockTrackerCLI/ - macOS:
~/Library/Application Support/StockTrackerCLI/ - Windows:
%LOCALAPPDATA%\StockTrackerCLI\
Files:
config.json- API keys and email settingspositions.json- Your stock positionscache.json- Cached stock data (15-minute expiry)history.json- Portfolio snapshots and historical performance dataalerts.json- Price alerts configurationwatchlist.json- Watchlist stockslogs/stock_tracker.log- Application logs
Requirements
- Python 3.8 or higher
- Internet connection for API access
- API keys:
- Groq API (for AI analysis)
- Alpha Vantage API (for stock data)
- SMTP server access (optional, for email reports)
Dependencies
Core Dependencies
- click - CLI framework
- pandas - Data manipulation
- groq - AI inference
- alpha-vantage - Stock data API
- yfinance - Historical stock data
- tavily-python - Market event detection and news search
- python-dateutil - Date utilities
- appdirs - Cross-platform directories
- schedule - Task scheduling
- python-dotenv - Environment variable management
UI & Visualization (New!)
- streamlit - Interactive web dashboard
- plotly - Interactive charts and graphs
- matplotlib - Additional plotting capabilities
- seaborn - Statistical visualizations
Technical Analysis (New!)
- ta - Technical indicators library
- numpy - Numerical computations
- scipy - Scientific computing
Gmail Setup
For Gmail users, you'll need to use an App Password:
- Enable 2-factor authentication on your Google account
- Go to https://myaccount.google.com/apppasswords
- Generate an app password for "Mail"
- Use this app password when running
stock-tracker setup-email
License
MIT License - see LICENSE file for details
Author
Chukwuebuka Ezeokeke - GitHub
Contributing
Contributions are welcome! Please feel free to submit a Pull Request.
Issues
Found a bug? Please report it on the GitHub Issues page.


Download files
Download the file for your platform. If you're not sure which to choose, learn more about installing packages.
Source Distribution
Built Distribution
Filter files by name, interpreter, ABI, and platform.
If you're not sure about the file name format, learn more about wheel file names.
Copy a direct link to the current filters
File details
Details for the file stock_tracker_cli-0.3.0.tar.gz.
File metadata
- Download URL: stock_tracker_cli-0.3.0.tar.gz
- Upload date:
- Size: 74.9 kB
- Tags: Source
- Uploaded using Trusted Publishing? No
- Uploaded via: twine/6.1.0 CPython/3.13.9
File hashes
| Algorithm | Hash digest | |
|---|---|---|
| SHA256 |
4670a8dbbac62a25e2047c5459f294ba617ac19b3374514d84991c91893f7e1f
|
|
| MD5 |
5e47a6e9a175422572062be7c63855d7
|
|
| BLAKE2b-256 |
22c03bec528fefa84a907c51a1d5c44d652e3a55619ab7356c94f5f25f3f7557
|
File details
Details for the file stock_tracker_cli-0.3.0-py3-none-any.whl.
File metadata
- Download URL: stock_tracker_cli-0.3.0-py3-none-any.whl
- Upload date:
- Size: 77.5 kB
- Tags: Python 3
- Uploaded using Trusted Publishing? No
- Uploaded via: twine/6.1.0 CPython/3.13.9
File hashes
| Algorithm | Hash digest | |
|---|---|---|
| SHA256 |
4c94652661b4e6680a1dbb04b3cf8ed1bf70052e093c017f6b621f04355bd673
|
|
| MD5 |
b4dd470dabc15a6c0099dfbd9810efe8
|
|
| BLAKE2b-256 |
74307bb7b4fca1c05db17969ab9a22668e996828942f274fe0f26b82d8514857
|


