
Stock Chart (丝袜统计图)
GitHub: xie-huaaaan/stockchart


A creative plotting library that draws data as stockings pulled up over a pair of legs.
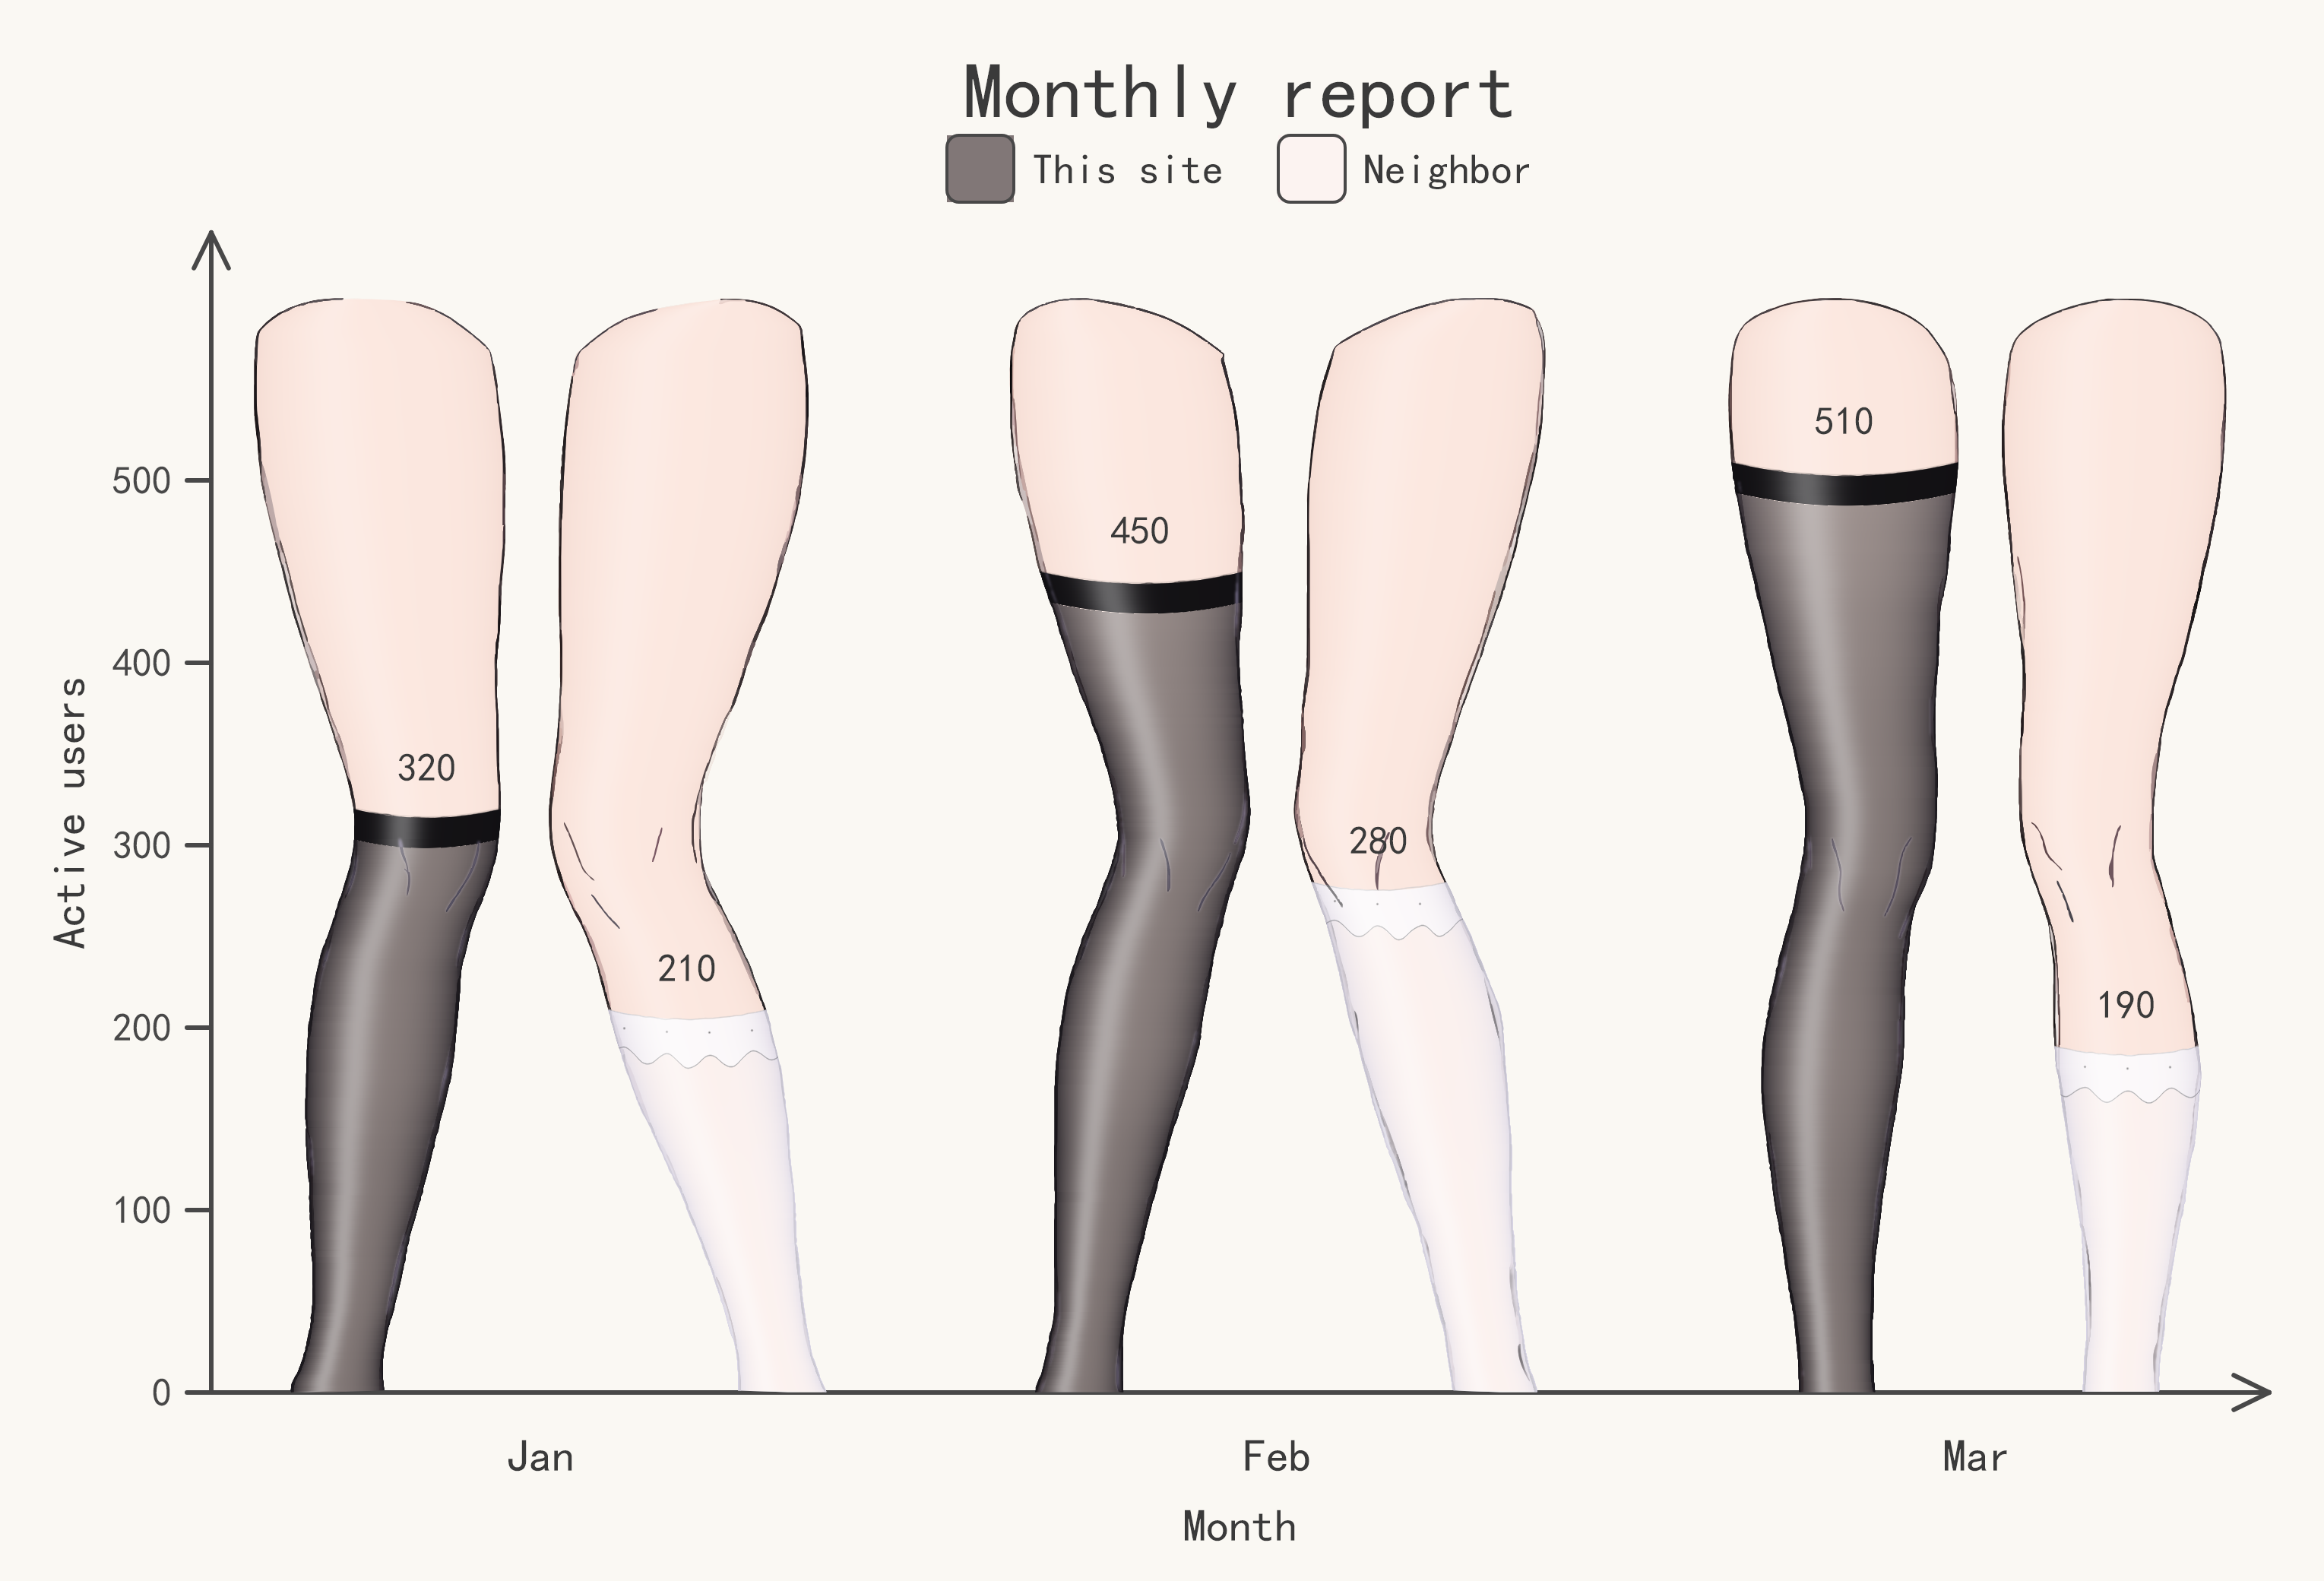
stockchart is a playful alternative to the bar chart. Each value becomes the height of a
stocking pulled up over a leg: a larger value means more stocking, and zero is a bare leg.
It is made for infographics, slides, posters, and anywhere a chart should be memorable
rather than conventional.
- Values → stocking height. Grouped, paired, and positive/negative mirror charts are supported.
- 19 built-in styles. Sheer, opaque tights, stripes, knit, fishnet, polka dots, hearts, lace trims, and more.
- Data-science friendly. Lists, NumPy arrays, dictionaries, and pandas
DataFrame/Series. pandas is optional and never imported by the library itself. - Native high-resolution output. Stocking textures and lighting are generated at the target pixel density, not upscaled from a bitmap.
- Composable by design. Start with one-line
bar(); drop down to pixel-level placement when you need a custom layout. - No matplotlib. Text and lines are rendered with Skia, including a per-character font fallback for Chinese, Japanese, and Korean.
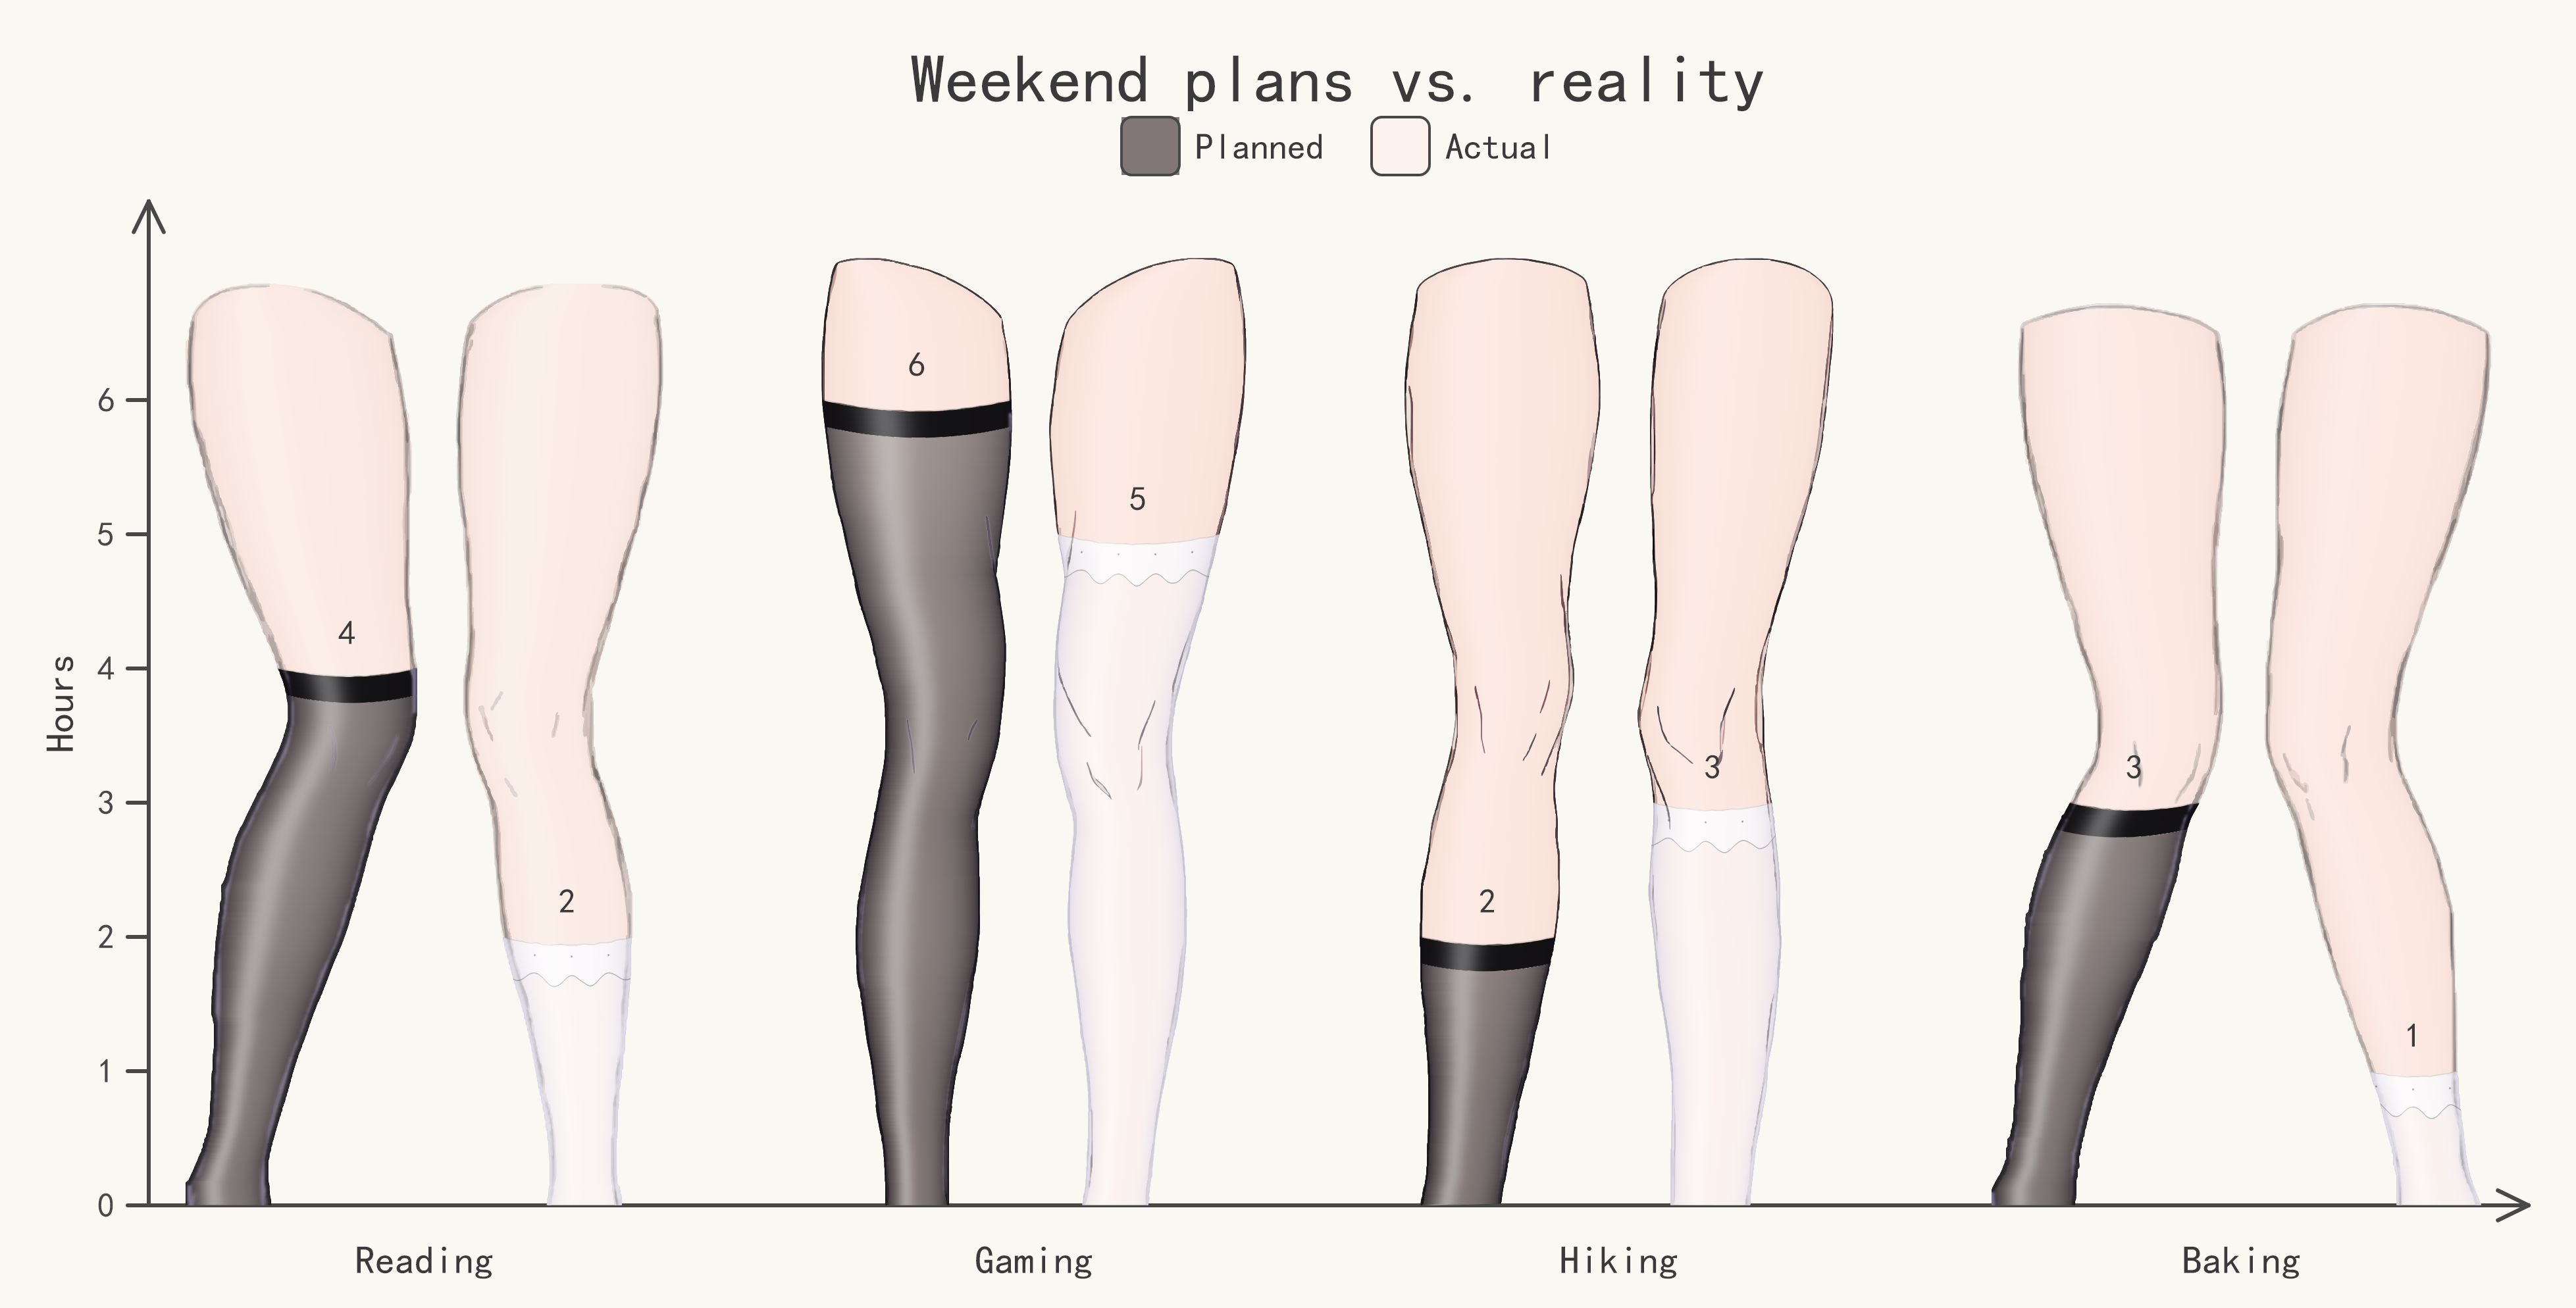 Grouped chart — black_sheer (welt) and white_sheer (lace)
|
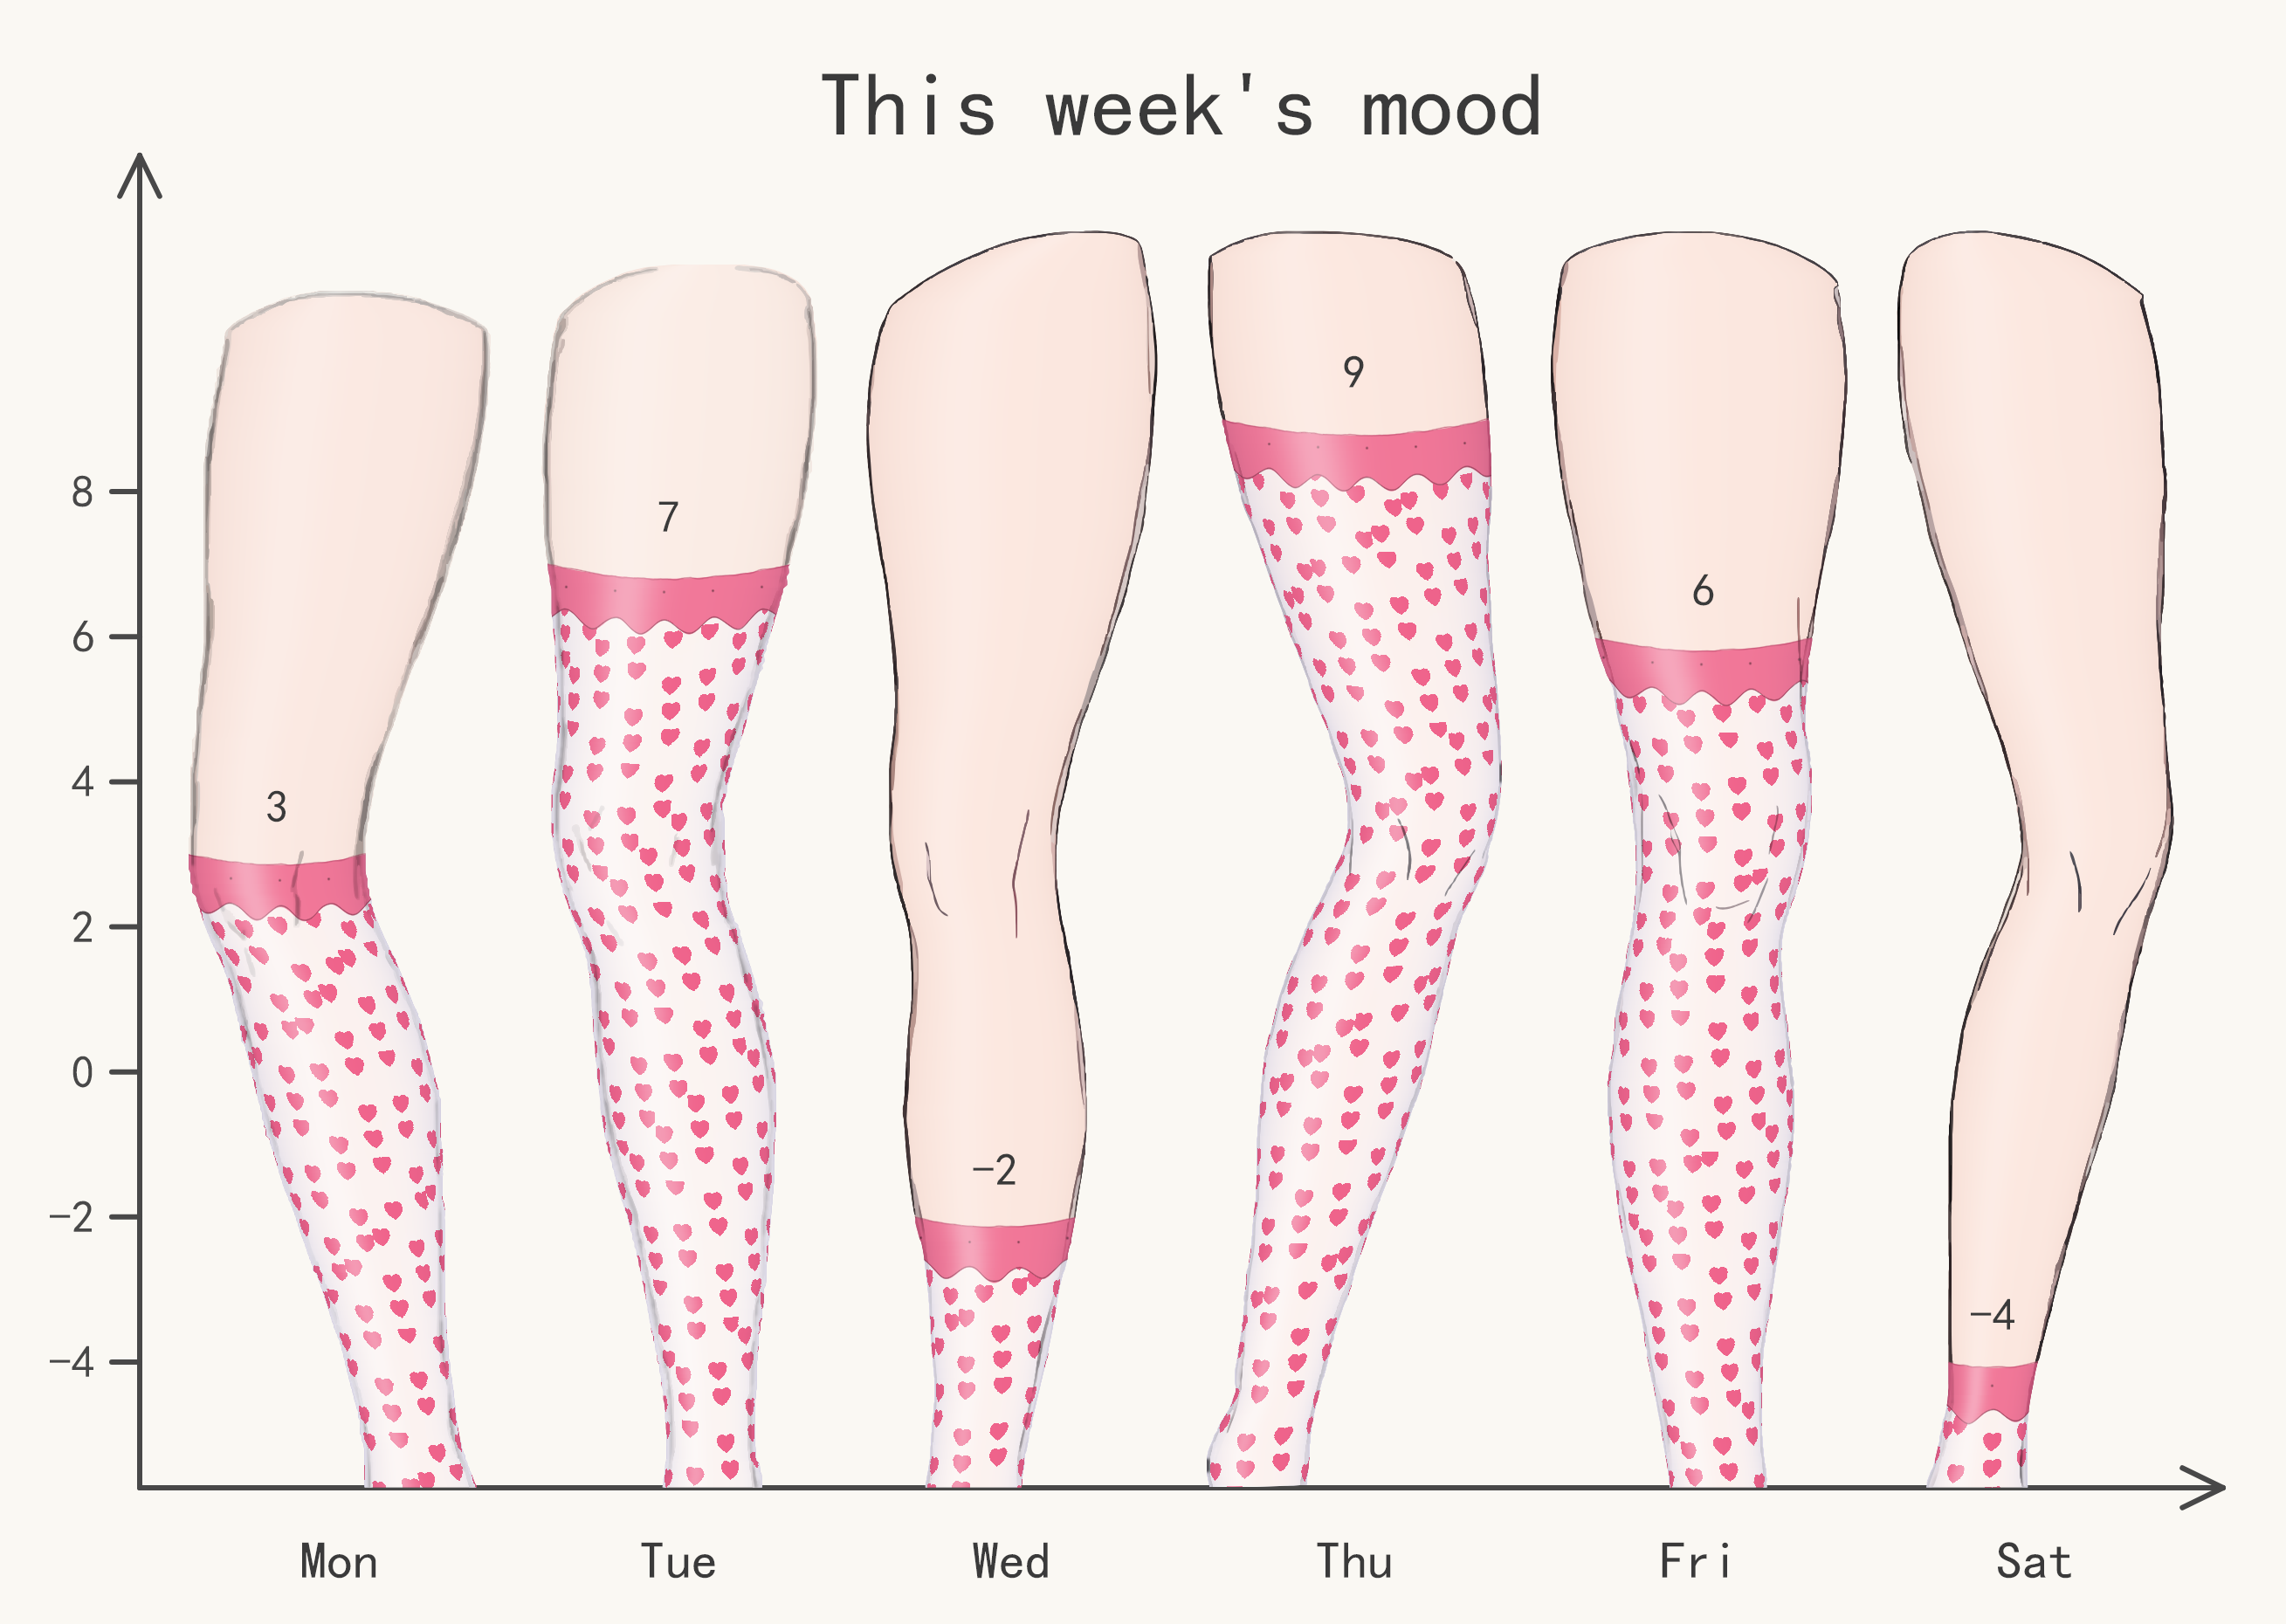 Single series with negative values — every leg stays upright ( heart_white)
|
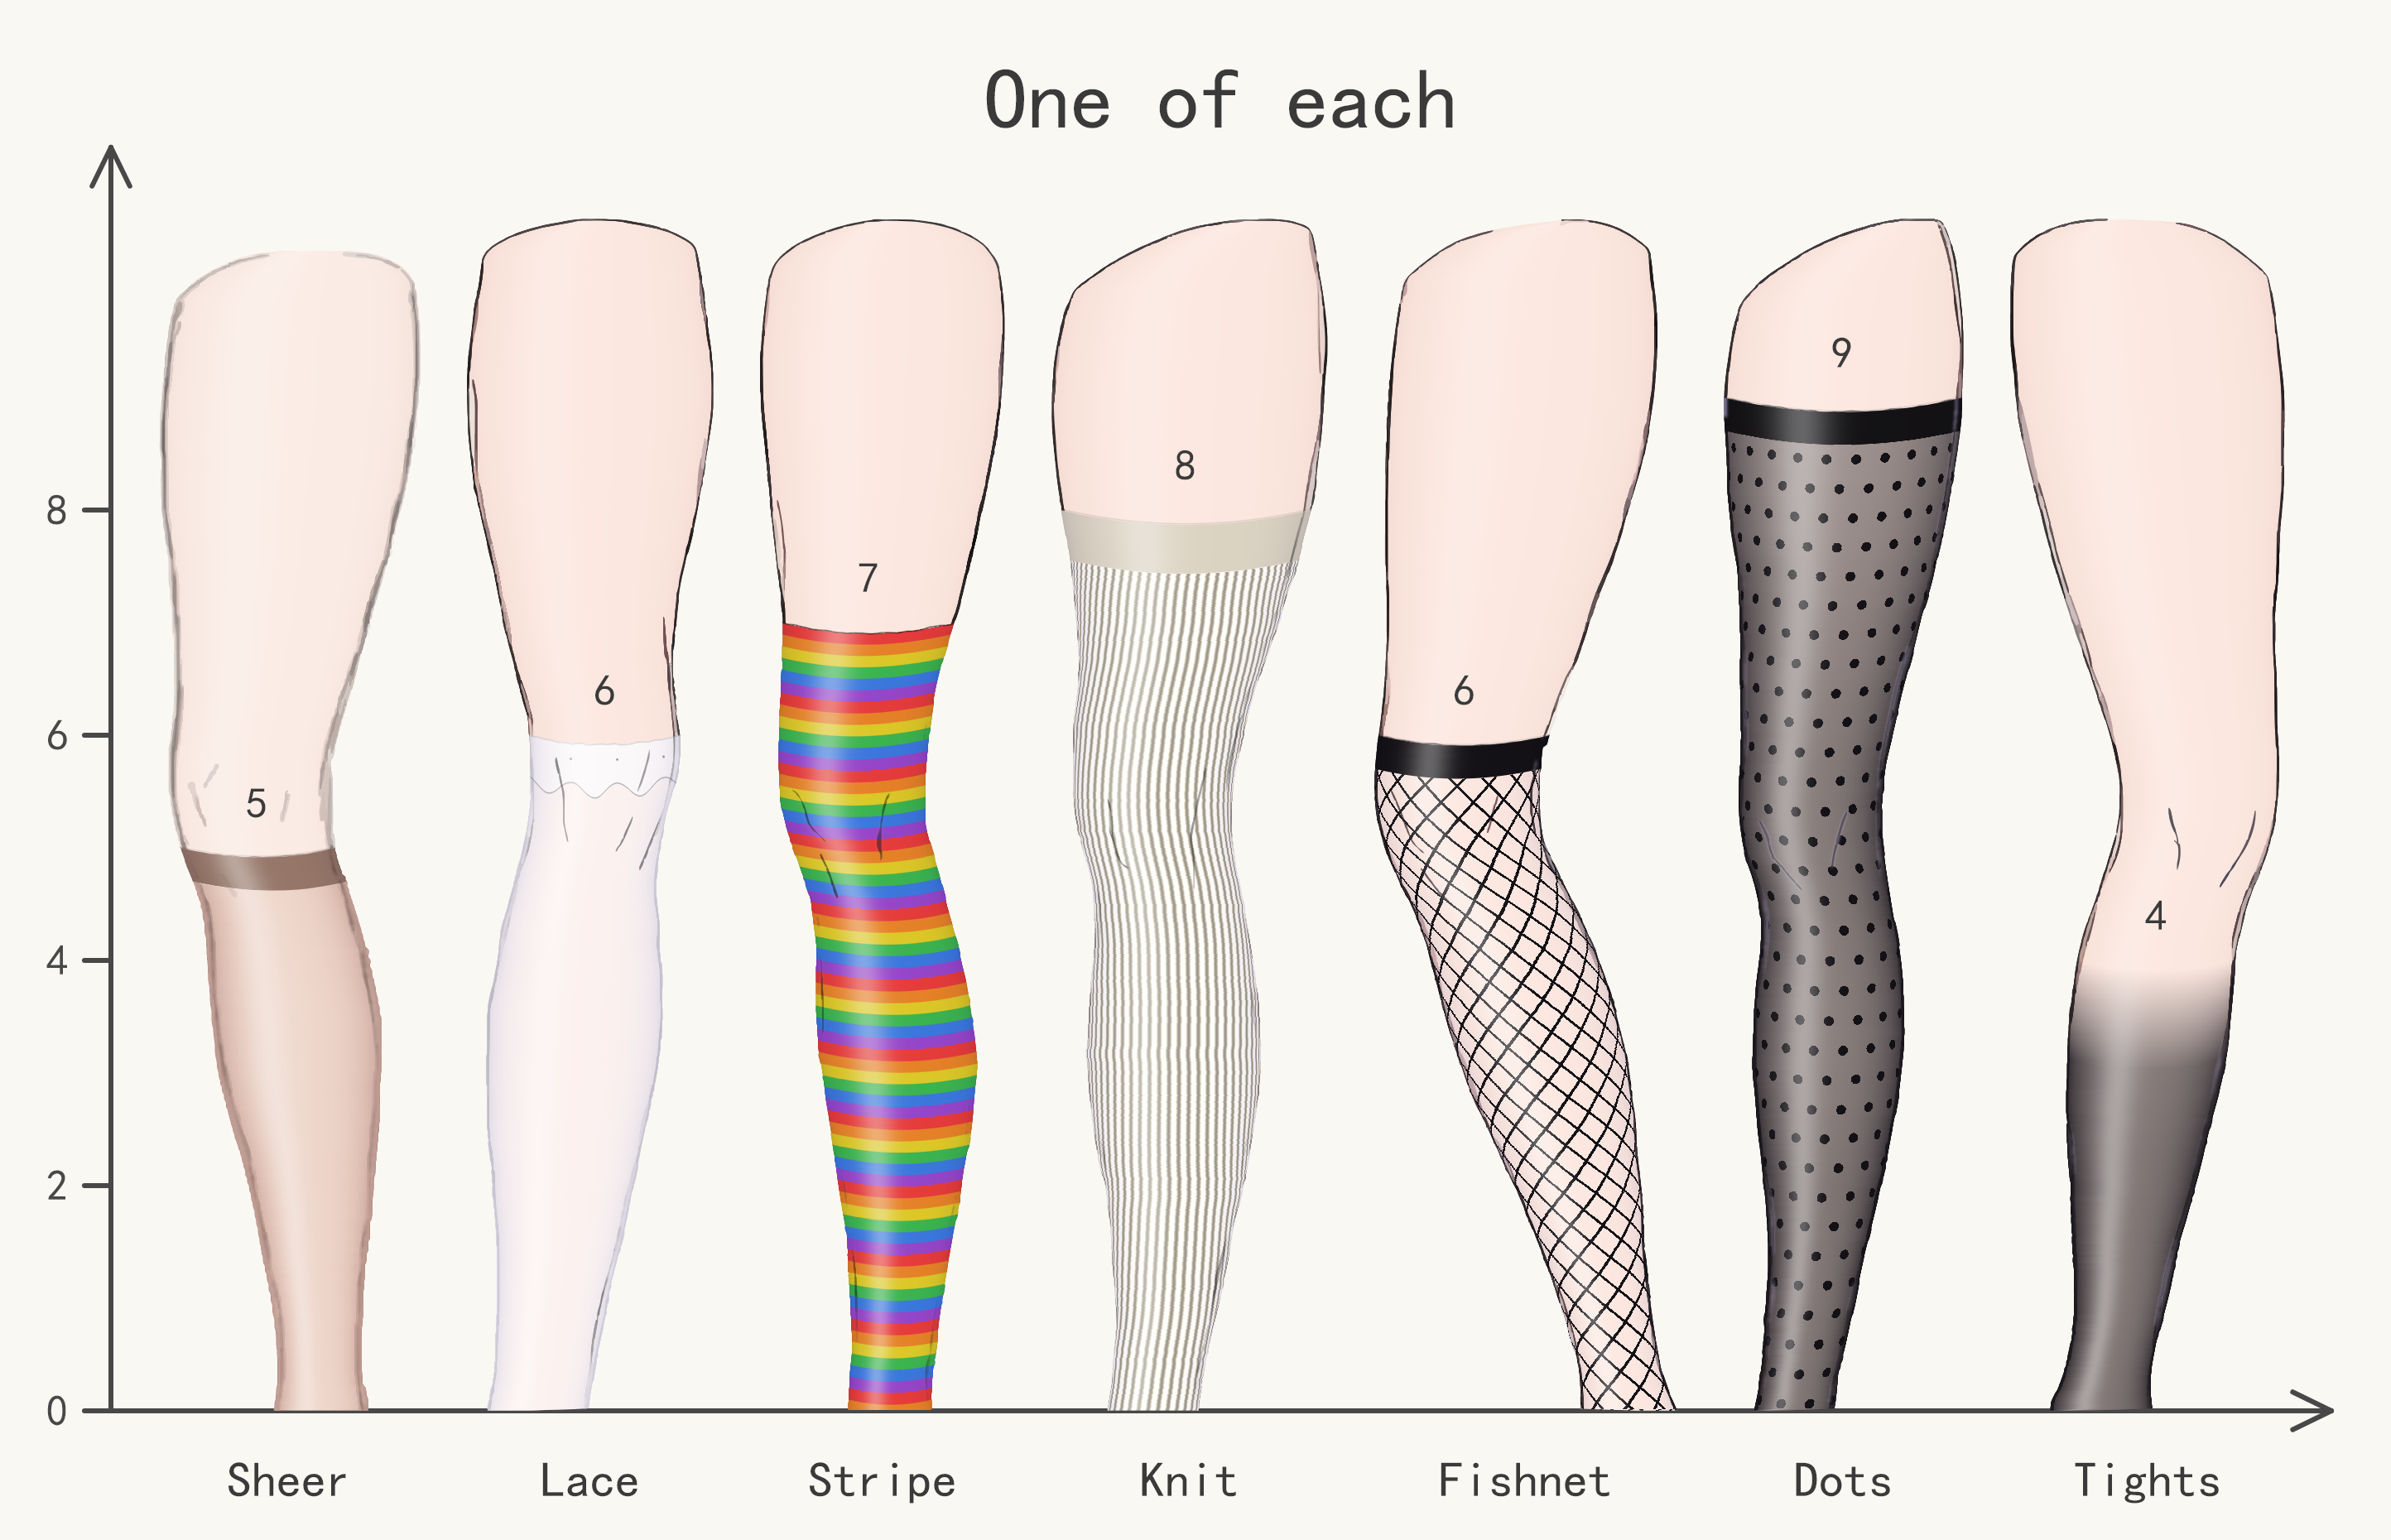 A sweep of presets — 5 fabric types, 4 top edges |
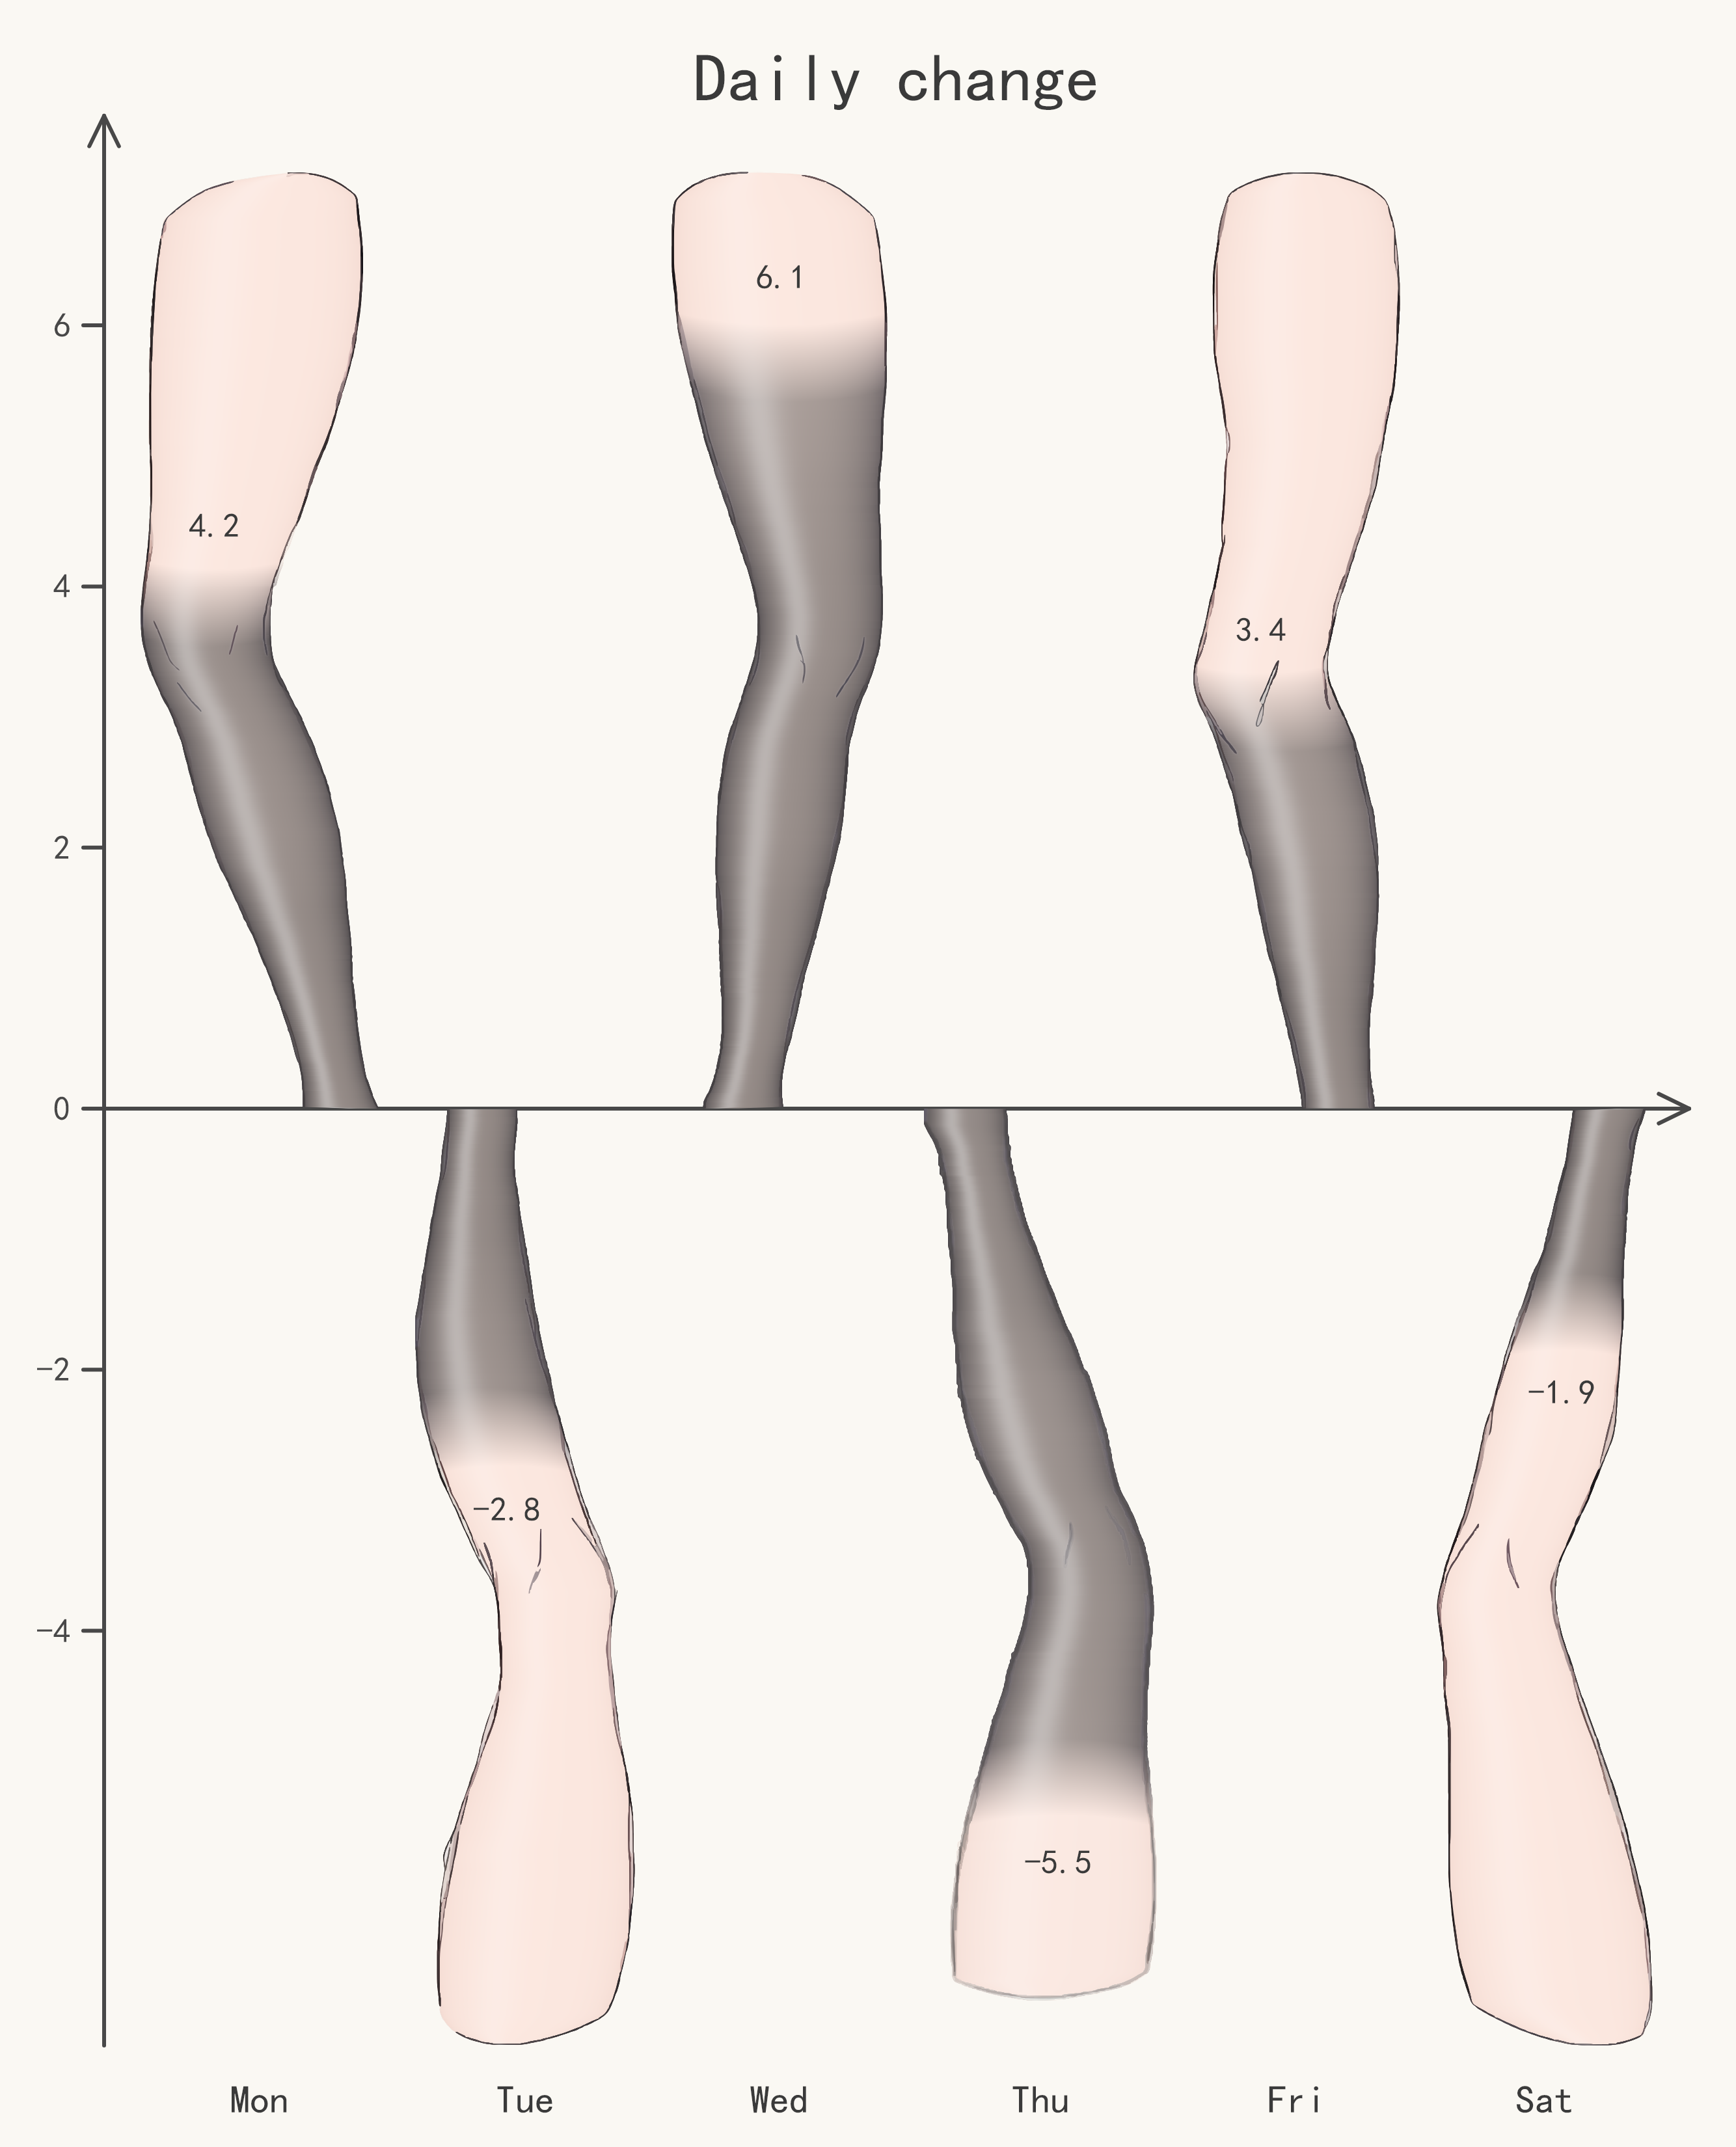 Mirror chart — positive and negative values |
Installation
pip install stockchart
or with uv:
uv add stockchart
Requires Python 3.12 or newer. Runtime dependencies are skia-python, numpy, and
pillow.
Quick start
from stockchart import bar

bar(
    [[320, 210], [450, 280], [510, 190]],
    labels=["Jan", "Feb", "Mar"],
    series_labels=["This site", "Neighbor"],
    title="Monthly report",
    xlabel="Month",
    ylabel="Active users",
    style=["black_sheer", "white_sheer"],
    value_labels=True,
    seed=2,
).save("chart.png")
The result is the image at the top of this README. bar() maps the data, chooses leg
assets, lays out groups, and draws the axes. It returns a BarPlot that can be saved
directly or adjusted further.
A mirror chart for positive and negative values:
from stockchart import mirror_bar

mirror_bar(
    [4.2, -2.8, 6.1, -5.5, 3.4, -1.9],
    labels=["Mon", "Tue", "Wed", "Thu", "Fri", "Sat"],
    title="Daily change",
    style="gray_sheer",
    value_labels=True,
    seed=2,
).save("mirror.png")
Data input
Pass the data structure you already have:
| Input | How it is interpreted |
|---|---|
| 1-D list / tuple / sequence | One series |
2-D sequence (groups, series) |
Grouped data |
numpy.ndarray |
1-D or 2-D arrays |
dict of scalars |
Keys become x-axis labels, one series |
dict of equal-length sequences |
Keys become series names and a legend is generated |
pandas DataFrame |
Index → x labels, columns → series names |
pandas Series |
Index → x labels, one series |
PlotData |
Already-normalized data |
For example, a DataFrame gets its labels and legend automatically:
import pandas as pd
from stockchart import bar

df = pd.DataFrame(
    {"This site": [320, 450, 510], "Neighbor": [210, 280, 190]},
    index=["Jan", "Feb", "Mar"],
)
bar(df, title="Monthly report", style=["black_sheer", "white_sheer"]).save("chart.png")
Explicit labels= and series_labels= override anything inferred from the data. Custom
containers can be registered with register_data_type; see the
data input reference.
Stocking styles
Pass a preset name, or a list of names to cycle through styles:
bar(
    [5, 6, 7, 8, 6, 9, 4],
    labels=["Sheer", "Lace", "Stripe", "Knit", "Fishnet", "Dots", "Tights"],
    title="One of each",
    style=[
        "nude_sheer",
        "white_sheer",
        "stripe_rainbow",
        "knit_cream",
        "fishnet_black",
        "polka_black",
        "black_pantyhose",
    ],
    value_labels=True,
    seed=3,
)
The 19 presets cover sheer stockings, opaque tights, stripes, ribbed knit, fishnet,
polka dots, hearts, lace trims, and more. For direct control, pass a StockingStyle
built from Plain, Striped, Ribbed, Fishnet, or Dotted fabrics with a
Bare, Welt, Lace, or Fade top edge. The full style table is in the
rendering reference.
Titles, axis names, and options
bar(
    data,
    title="Monthly report",  # centered over the plot by default
    xlabel="Month",
    ylabel="Active users",
    title_align="left",  # restore a left-aligned title
    grid=True,
    axis_style="handdrawn",
    legend_loc="bottom",
)
Chart-level parameters stay in the signature; lower-level options such as grid,
axis_style, legend_loc, legend_ncol, x_label_rotation, bar_gap, and group_gap
are passed through a typed option bag. See the
ChartOptions table.
API layers
The library is deliberately layered, so you can choose how much control you want:
| Layer | What it gives you | Entry points |
|---|---|---|
| L0 assets | Leg metadata and built-in artwork | Leg, LegLibrary, load_leg |
| L1 primitives | One stocking, text, hand-drawn lines | render_stocking, StockingStyle, STYLES, draw_text, sketch_* |
| L2 free-form plot | Canvas, baseline, arbitrary leg placement | BarPlot, Scale, Canvas |
| L3 layout helpers | Uniform spacing and automatic leg selection | add_bars, add_grouped_bars, add_paired_bars |
| L4 one-liners | Data normalization and fully automatic layout | bar, mirror_bar |
For a more hands-on layout:
from stockchart import BarPlot, Scale

plot = BarPlot(1200)
plot.add_bars([300, 500, 400], style="black_sheer")
plot.add_x_labels(["A", "B", "C"])
plot.add_y_axis(Scale((0, 500), (0, 760)))
plot.add_title("Free-form layout")
plot.save("chart.png")
Output
BarPlot renders to PNG and can also return a PIL image or a NumPy array:
plot.save("chart.png", scale=2)  # PNG at 2× pixel density
image = plot.to_pil()
array = plot.to_numpy()
scale controls output pixel density; stocking textures and lighting are regenerated at
that density. SVG and PDF output are intentionally not supported.
Documentation
- API reference — one page per layer
- Design notes
Development
git clone https://github.com/xie-huaaaan/stockchart.git
cd stockchart
uv sync
uv run python -m pytest
uv run ruff check . && uv run ruff format .
uv run python -m pyright
Issues and pull requests are welcome.
Status
0.1.x is an early public release. The rendering pipeline is stable, but the public API
may still change in minor releases.
License
The source code is released under the Mozilla Public License 2.0 (MPL-2.0).
You can use stockchart in closed-source projects; if you modify MPL-covered source
files, those files must remain available under MPL-2.0.
The built-in leg artwork (src/stockchart/assets/leg_*.svg and legs.json) is
All Rights Reserved and is not covered by MPL-2.0; see the
asset license. The artwork may be used to render charts
with stockchart, and charts you generate are your own work. The artwork itself may not
be extracted or redistributed except as part of an unmodified stockchart package.
简体中文
用丝袜被拉起的高度表示数据的创意绘图库。
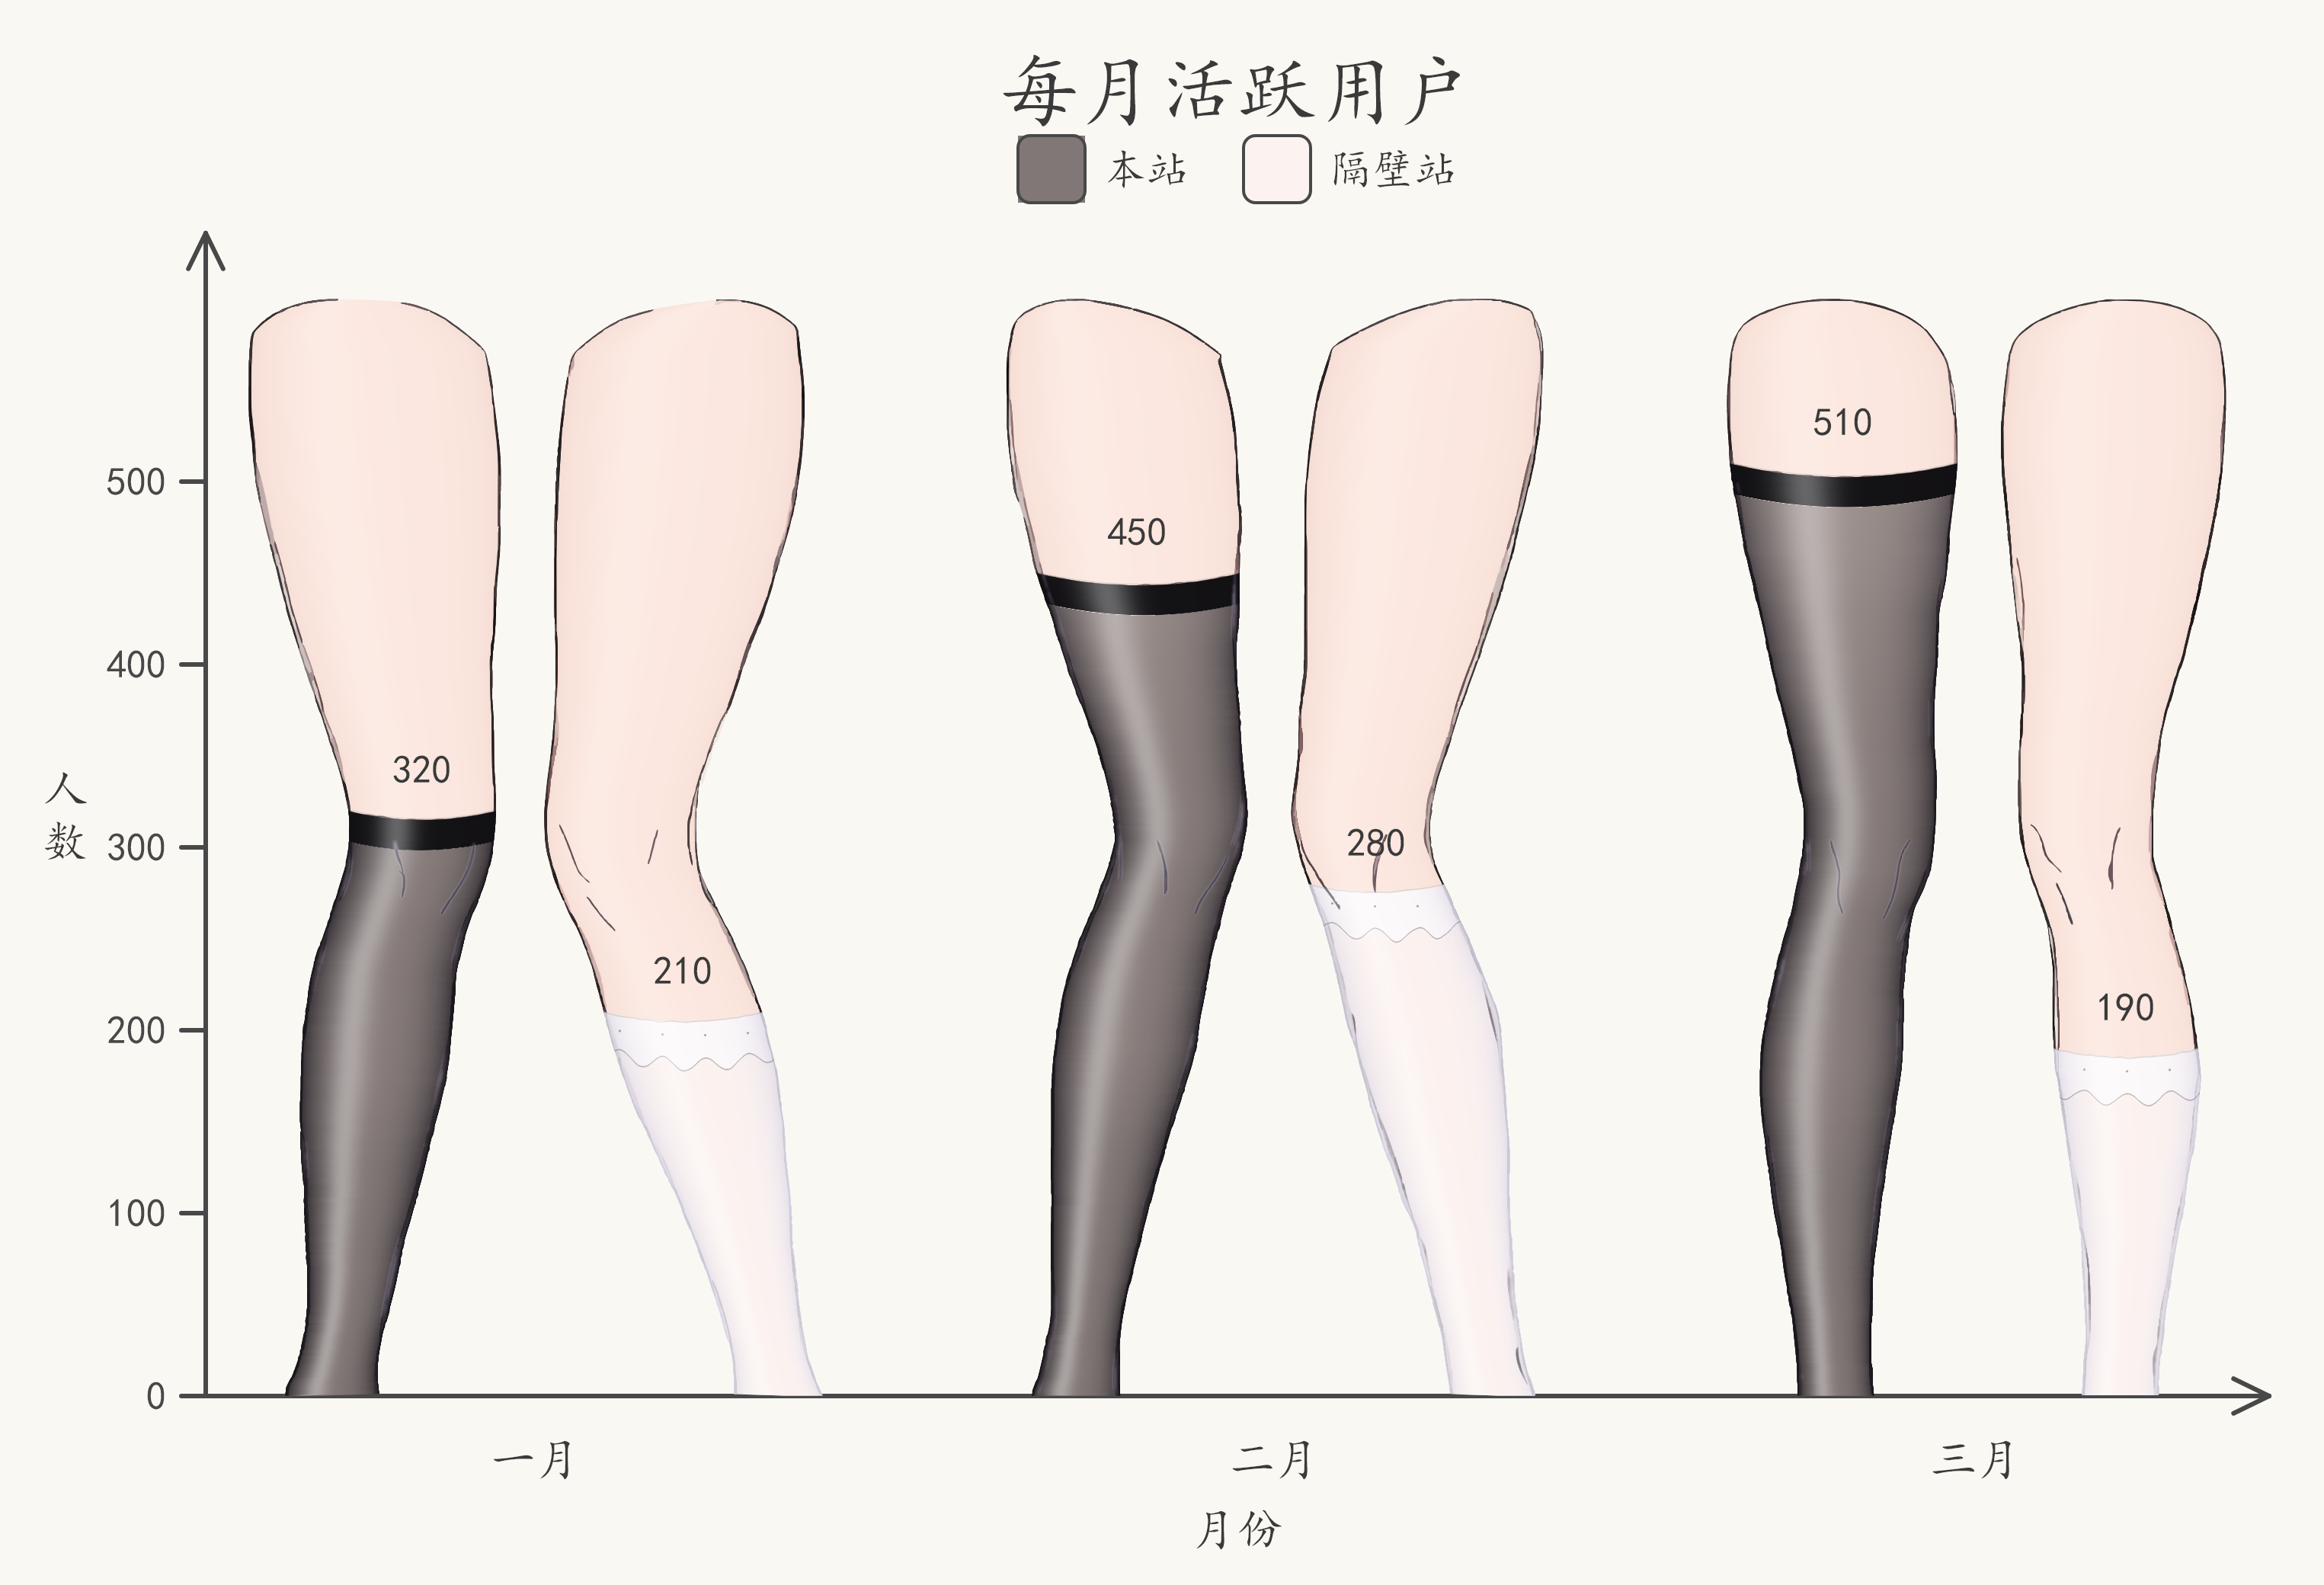
stockchart 是柱状图的一种有趣替代:每个数值对应一条腿上丝袜被拉起的高度,
数值越大丝袜越高,0 则是一条裸腿。它适合信息图、幻灯片、海报,以及任何希望
图表更有个性、而不只是“标准”的场合。
- 数值 → 丝袜高度:支持分组、成对,以及正负值上下镜像。
- 19 种内置样式:透肉丝袜、厚袜、条纹、针织、网袜、波点、爱心、蕾丝边等。
- 支持常见数据类型:列表、NumPy 数组、字典、pandas
DataFrame/Series。 pandas 是可选依赖,库本身不会 import 它。 - 原生高分辨率输出:丝袜纹理与光影按目标像素密度重新生成,不是把小图放大。
- 分层可组合:一行
bar()即可出图;需要自由排版时可下沉到逐像素放置。 - 不依赖 matplotlib:文字与线条由 Skia 渲染,逐字符字体回退,中文可正常显示。
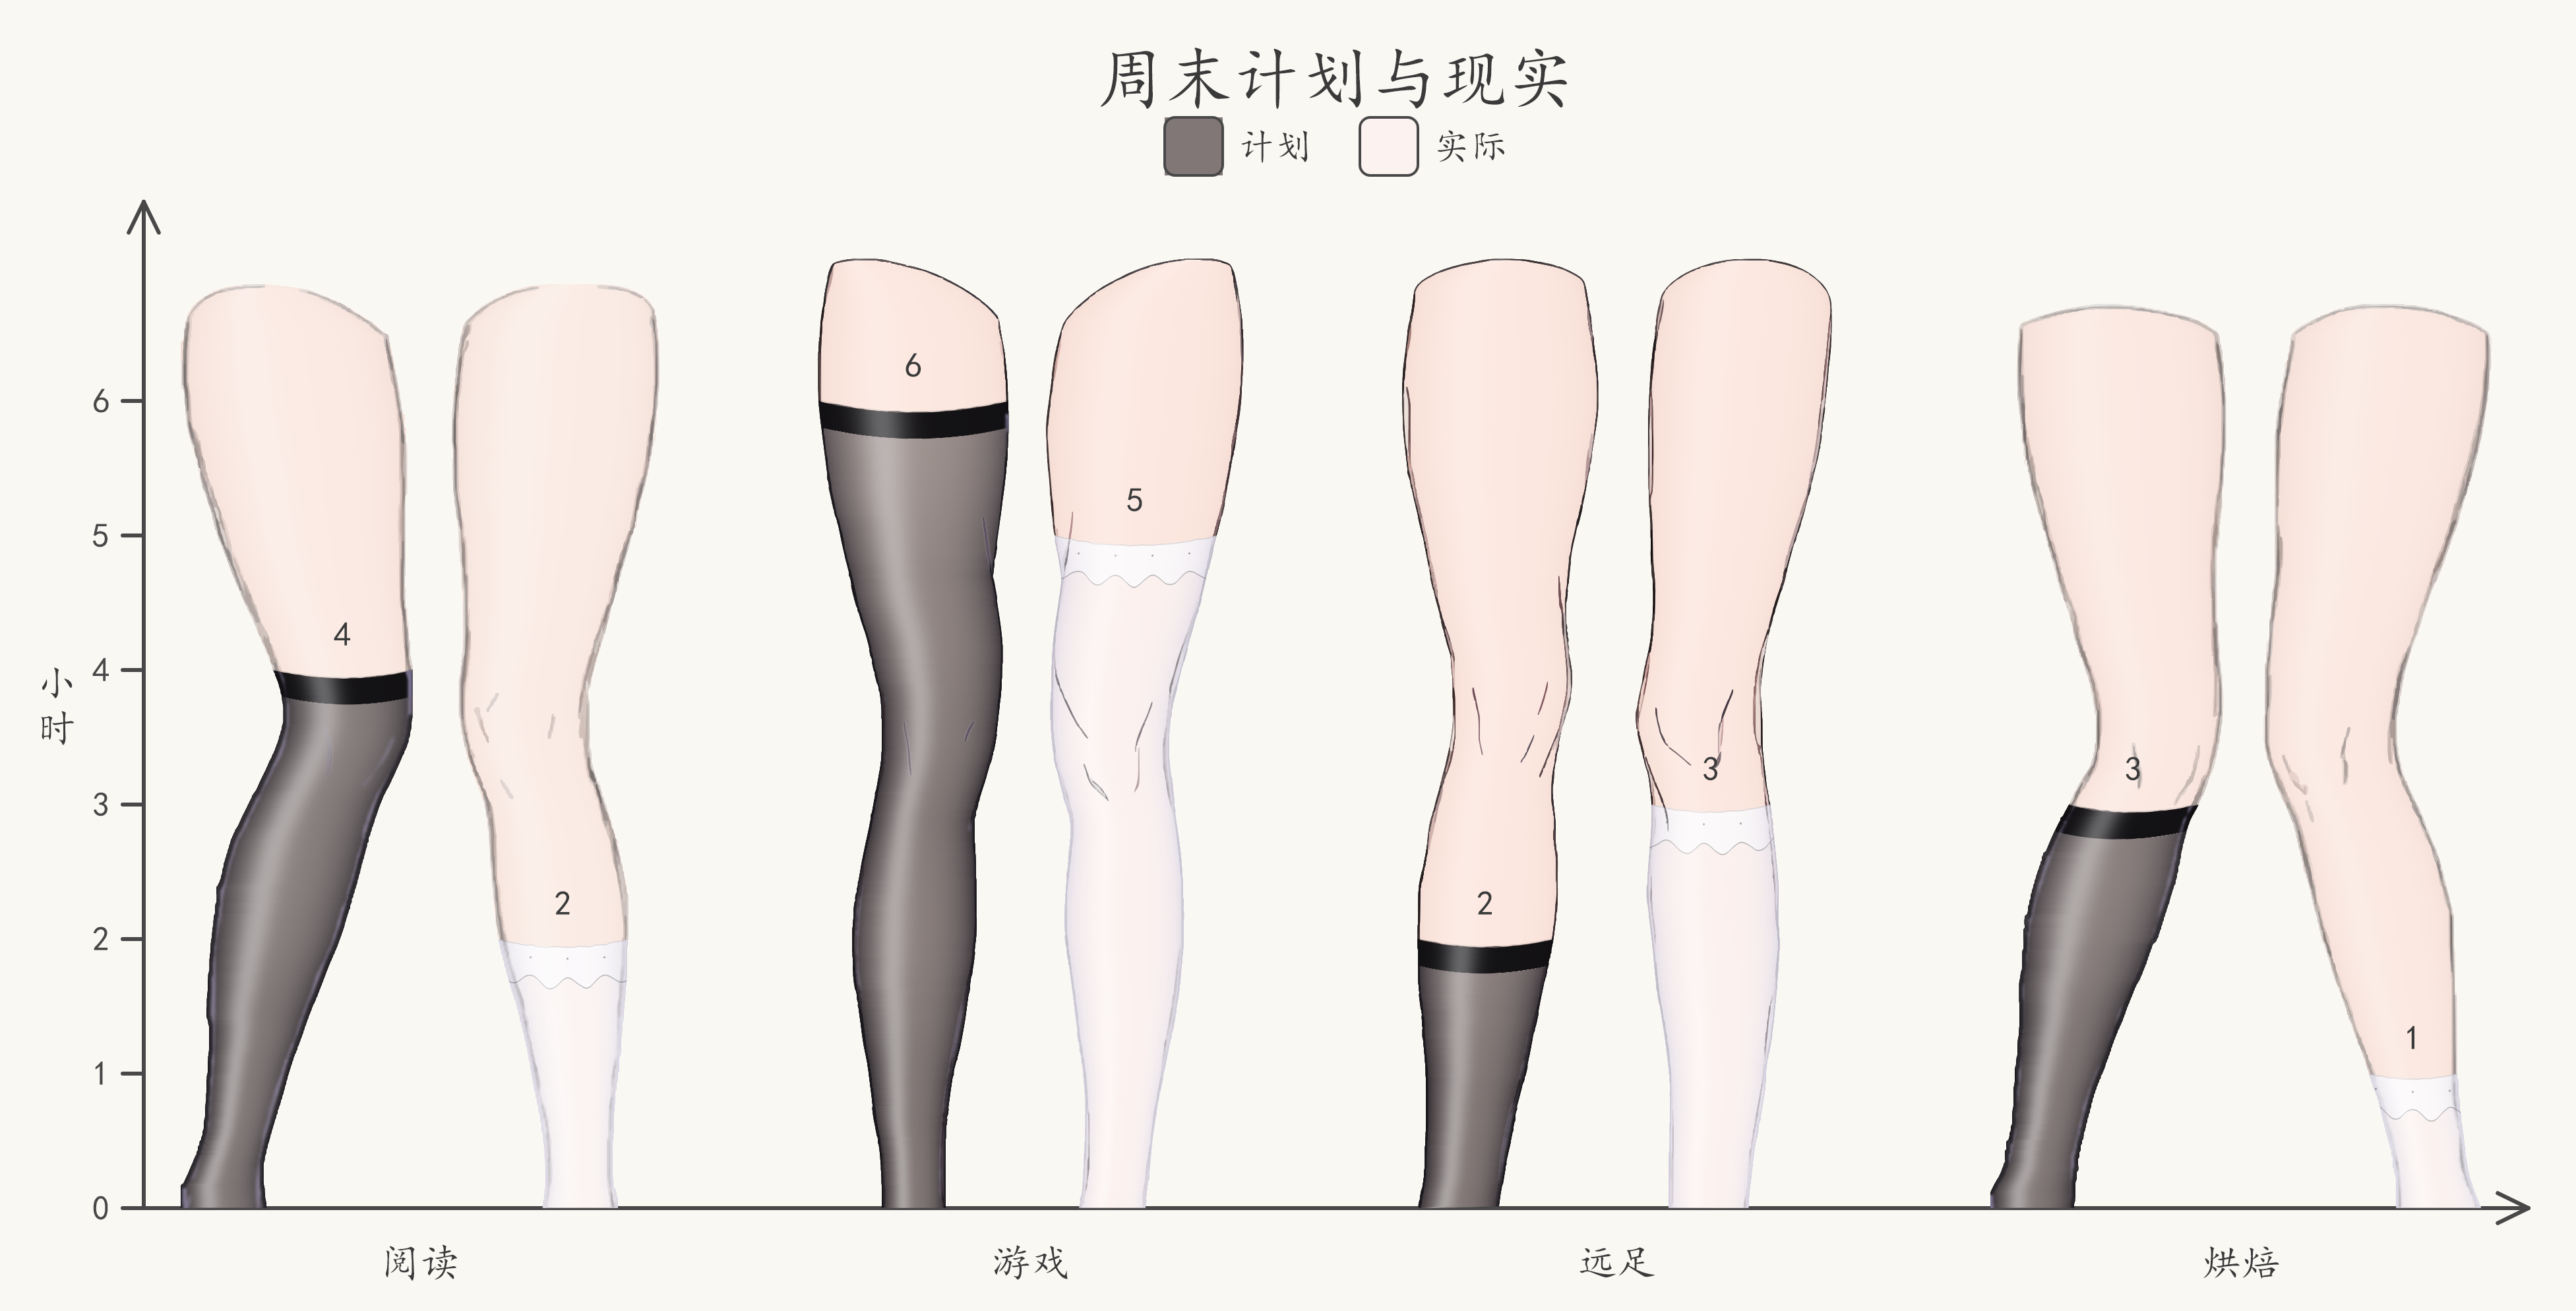 分组图 —— black_sheer(松紧袜口)与 white_sheer(蕾丝边)
|
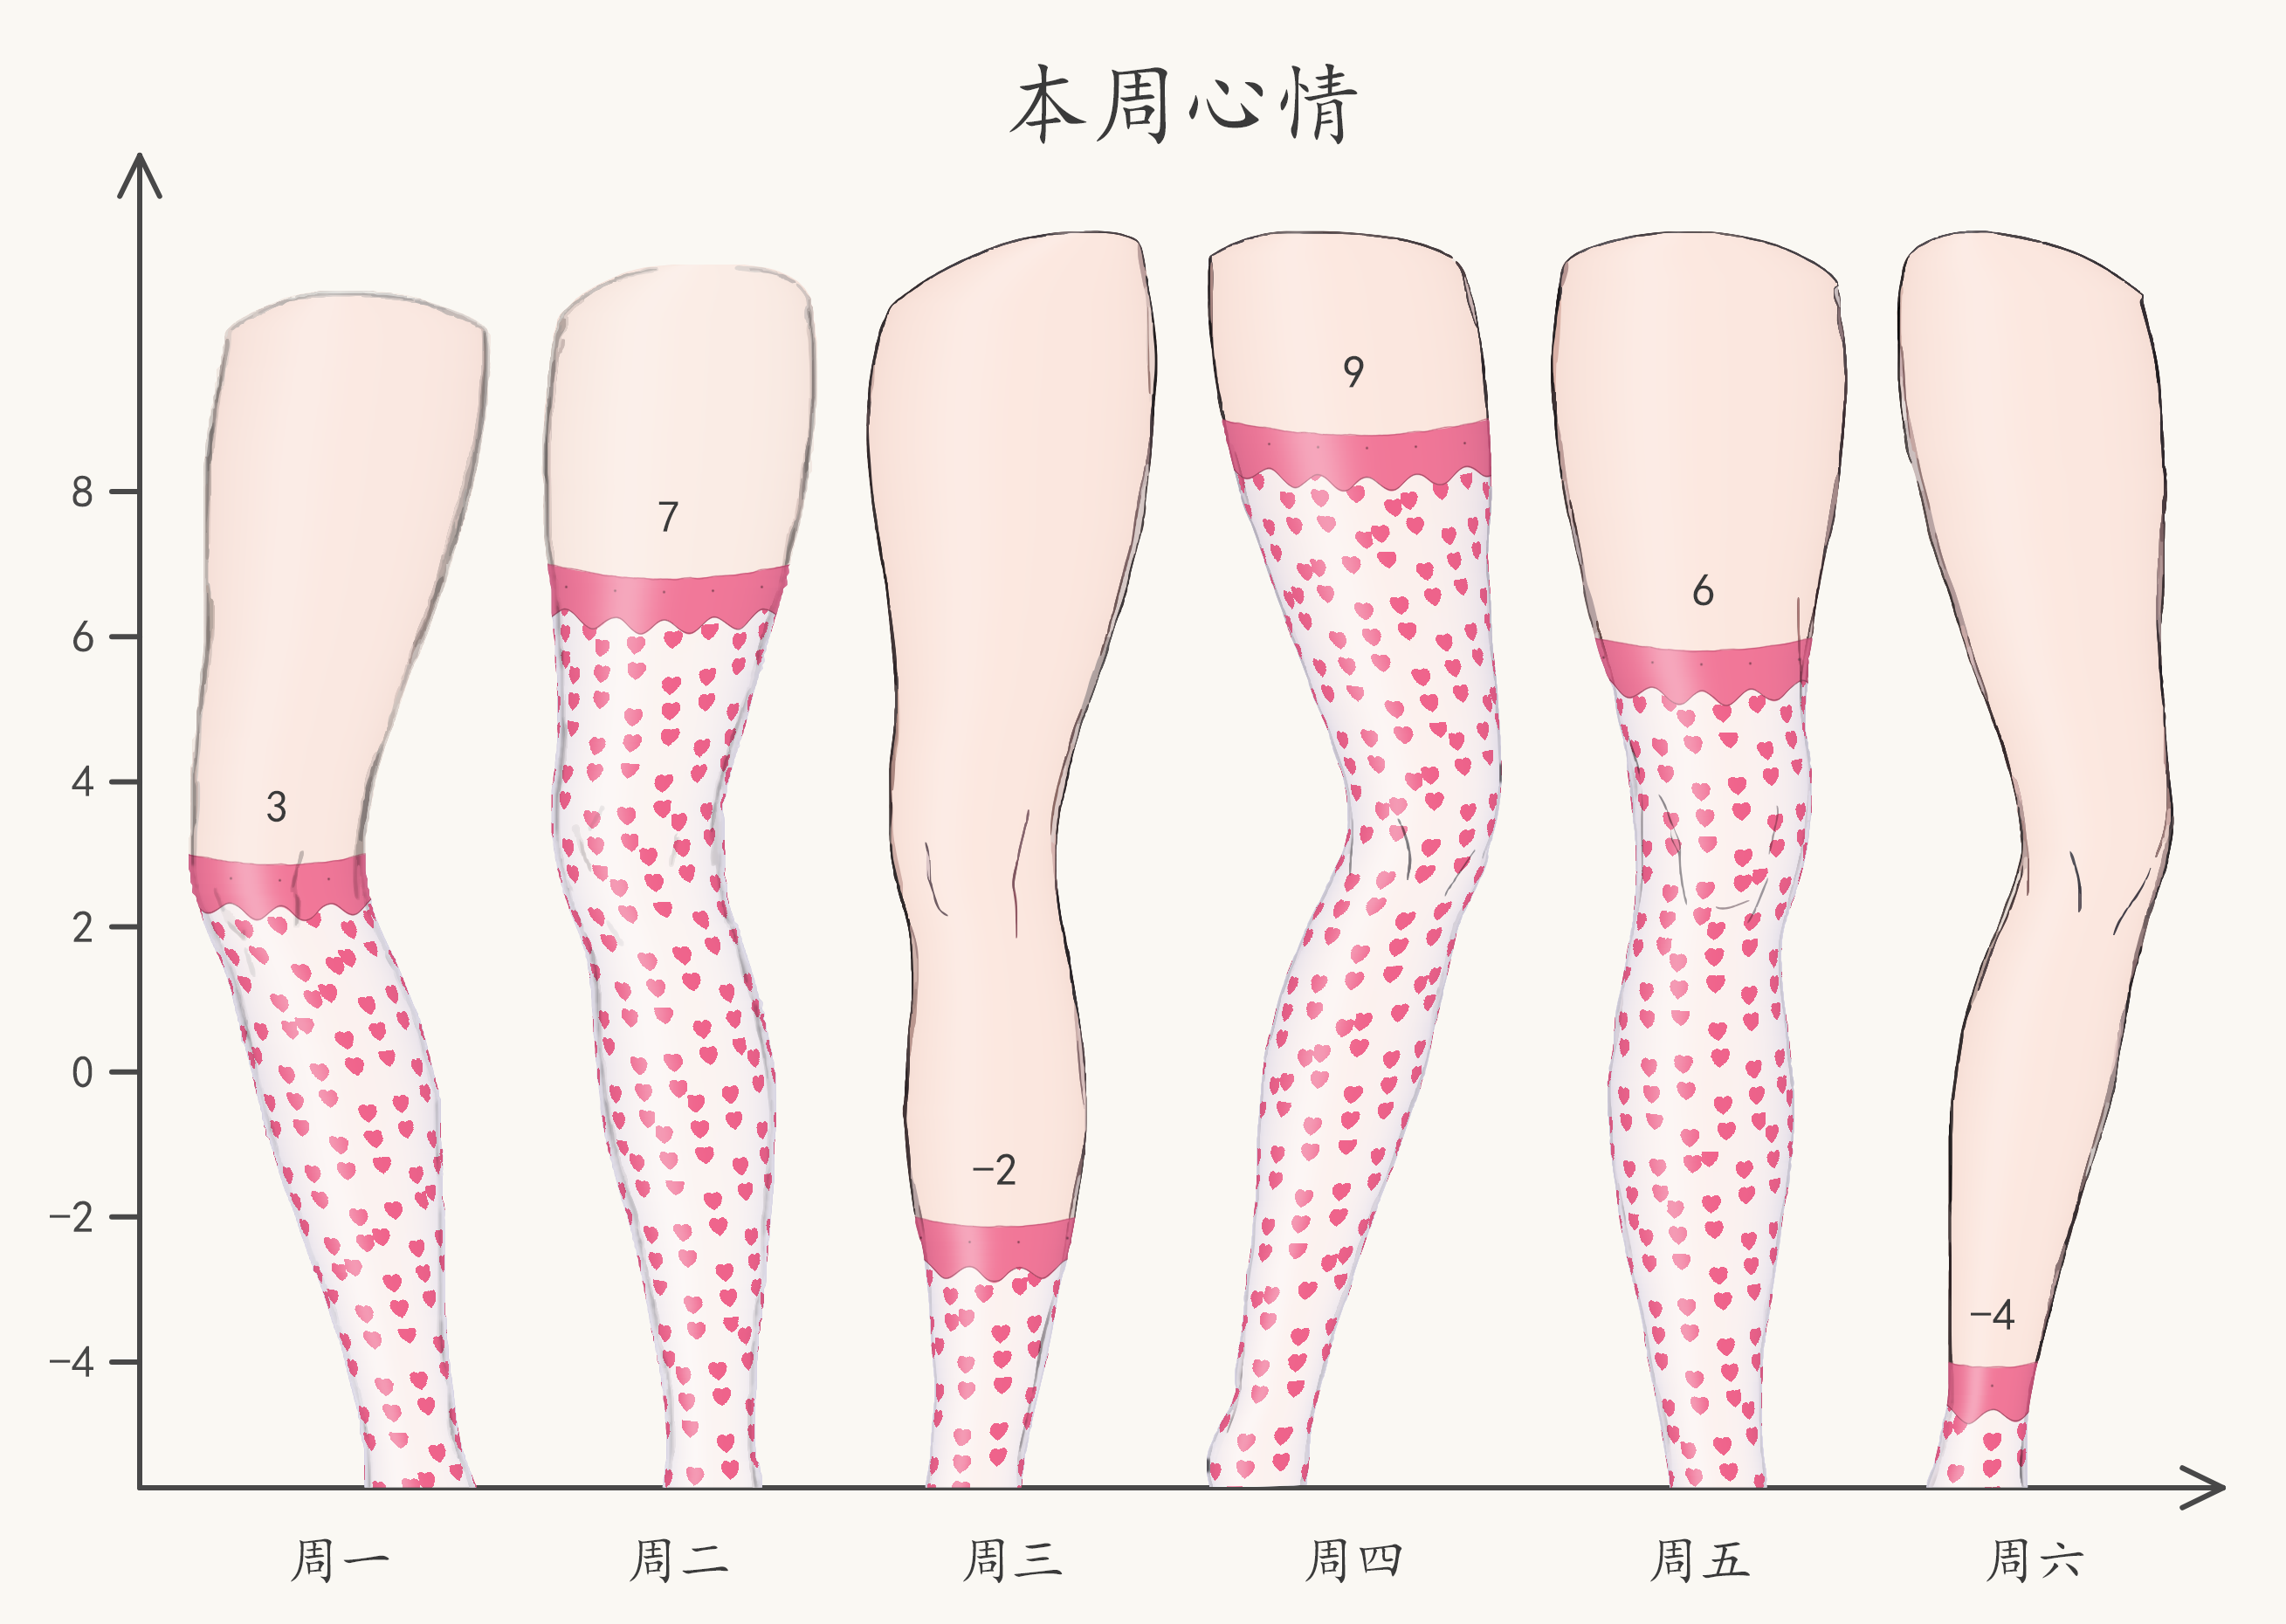 单系列含负值 —— 依旧全是朝上的腿( heart_white)
|
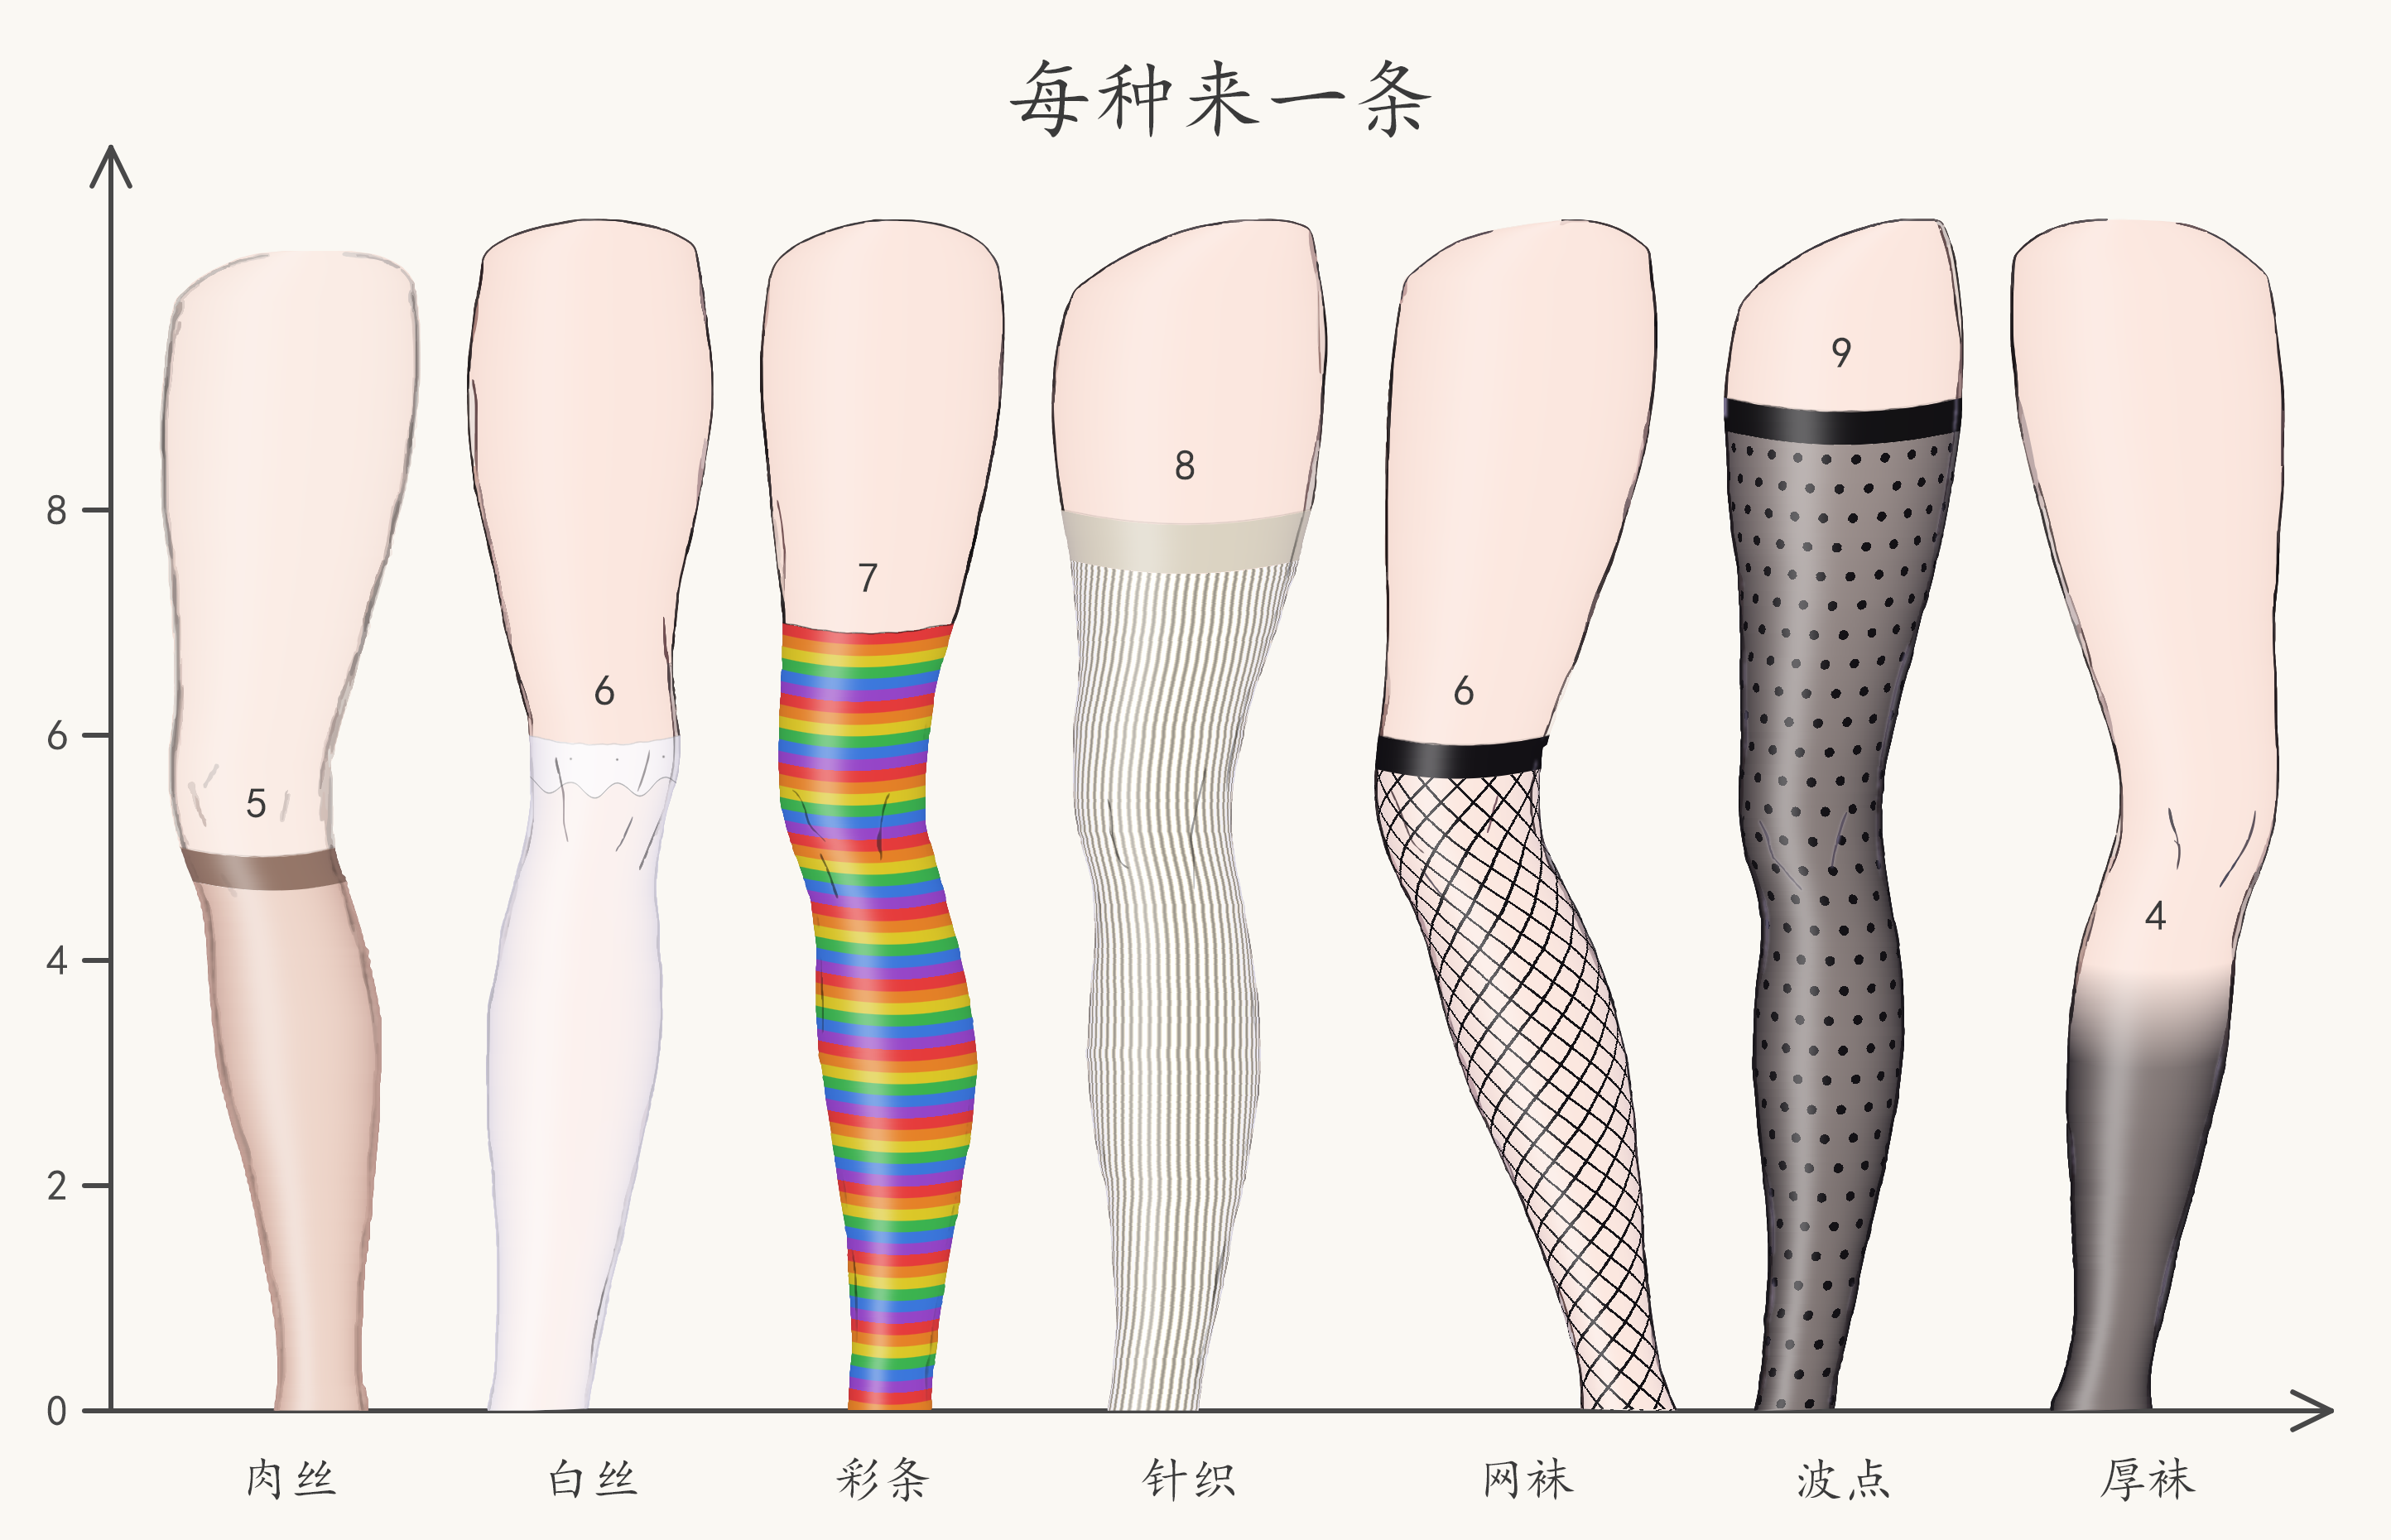 样式巡礼 —— 5 种袜身、4 种上沿 |
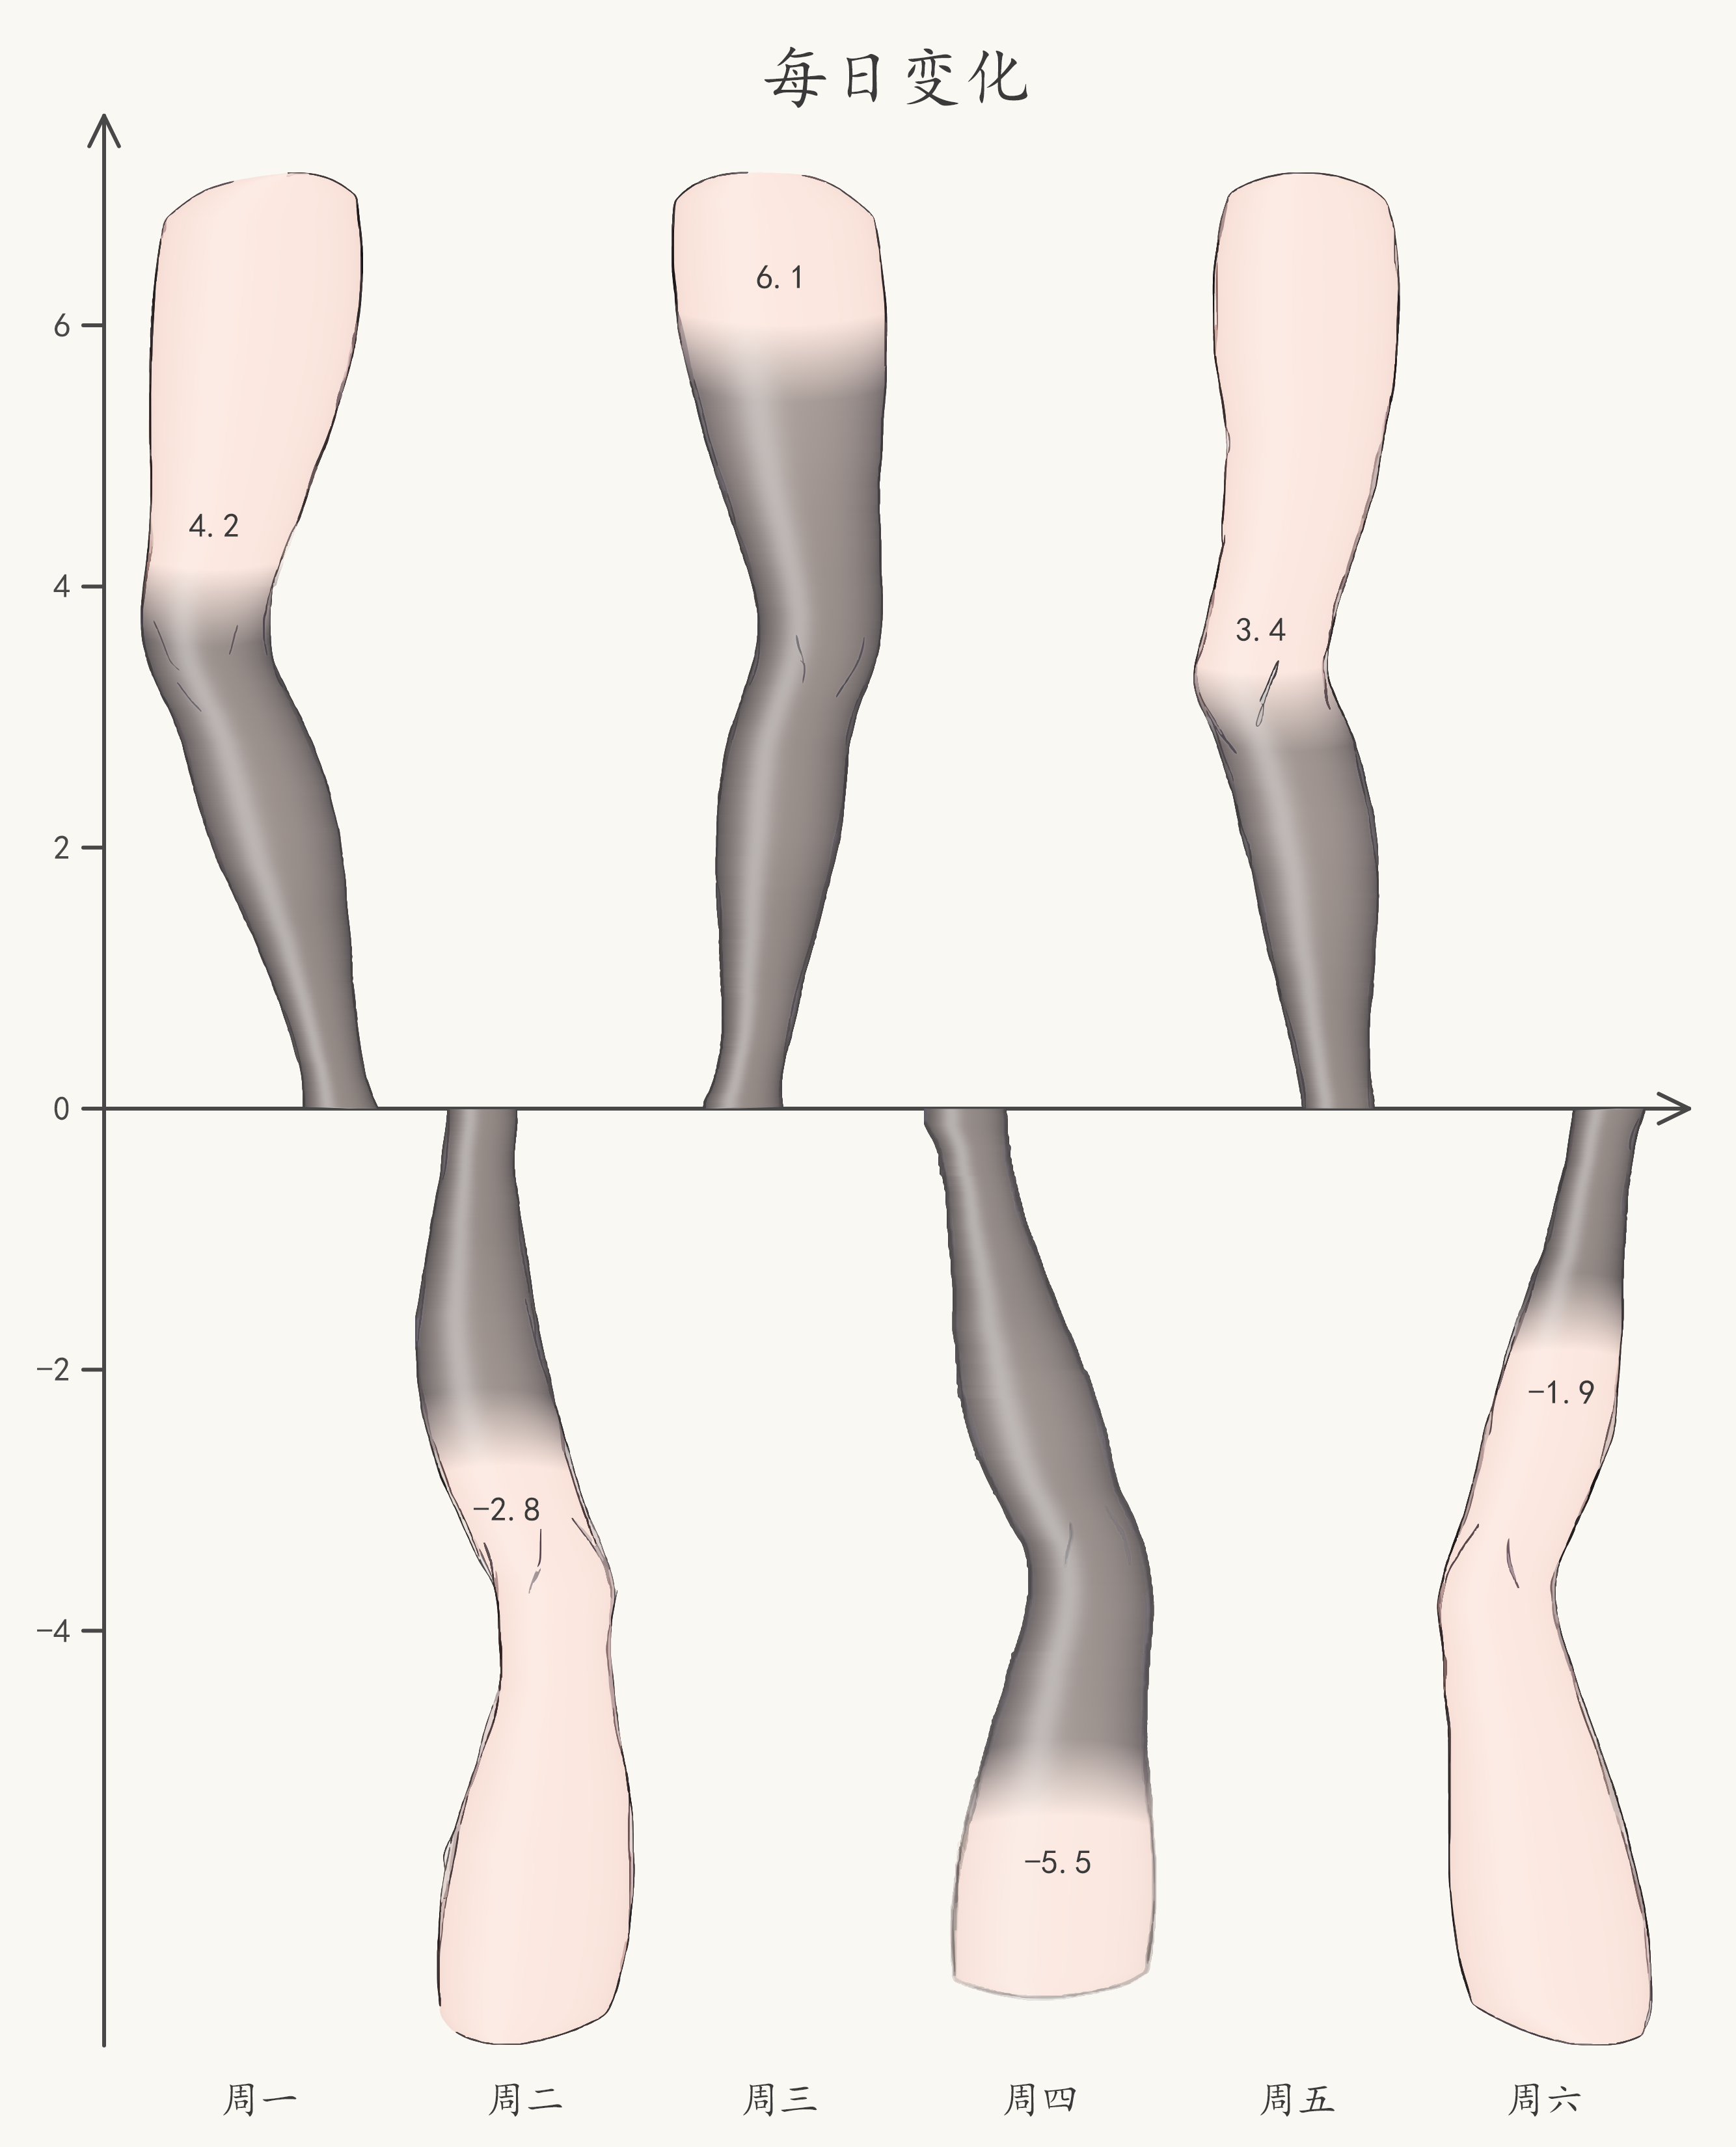 镜像图 —— 正负值上下分布 |
安装
pip install stockchart
或使用 uv:
uv add stockchart
需要 Python 3.12 或更高版本。运行时依赖只有 skia-python、numpy、pillow。
快速开始
from stockchart import bar

bar(
    [[320, 210], [450, 280], [510, 190]],
    labels=["一月", "二月", "三月"],
    series_labels=["本站", "隔壁站"],
    title="每月活跃用户",
    xlabel="月份",
    ylabel="人数",
    style=["black_sheer", "white_sheer"],
    value_labels=True,
    seed=2,
).save("chart.png")
输出就是本文顶部那张图。bar() 会自动完成数值映射、选腿、分组布局与坐标轴绘制,
返回一个可以直接 .save()、也可以继续微调的 BarPlot。
正负值镜像图:
from stockchart import mirror_bar

mirror_bar(
    [4.2, -2.8, 6.1, -5.5, 3.4, -1.9],
    labels=["周一", "周二", "周三", "周四", "周五", "周六"],
    title="每日变化",
    style="gray_sheer",
    value_labels=True,
    seed=2,
).save("mirror.png")
数据输入
直接传入手头的数据结构即可:
| 输入 | 解释 |
|---|---|
| 一维列表 / 元组 / 序列 | 单系列 |
二维序列 (组数, 系列数) |
分组数据 |
numpy.ndarray |
一维或二维数组 |
| 标量值字典 | 键作 x 轴标签,单系列 |
| 等长序列字典 | 键作系列名,并自动生成图例 |
pandas DataFrame |
index → x 标签,columns → 系列名 |
pandas Series |
index → x 标签,单系列 |
PlotData |
已归一化的数据 |
例如 DataFrame 会自动带上标签和图例:
import pandas as pd
from stockchart import bar

df = pd.DataFrame(
    {"本站": [320, 450, 510], "隔壁站": [210, 280, 190]},
    index=["一月", "二月", "三月"],
)
bar(df, title="每月活跃用户", style=["black_sheer", "white_sheer"]).save("chart.png")
显式传入的 labels= / series_labels= 会覆盖从数据推断出的值。自定义容器可以用
register_data_type 注册,详见
数据输入参考。
丝袜样式
传一个预设名,或用列表让样式循环:
bar(
    [5, 6, 7, 8, 6, 9, 4],
    labels=["肉丝", "白丝", "彩条", "针织", "网袜", "波点", "厚袜"],
    title="每种来一条",
    style=[
        "nude_sheer",
        "white_sheer",
        "stripe_rainbow",
        "knit_cream",
        "fishnet_black",
        "polka_black",
        "black_pantyhose",
    ],
    value_labels=True,
    seed=3,
)
19 个预设覆盖透肉丝袜、厚袜、条纹、针织、网袜、波点、爱心、蕾丝边等。需要更细的
控制时,可以直接构造 StockingStyle:袜身用 Plain / Striped / Ribbed /
Fishnet / Dotted,上沿用 Bare / Welt / Lace / Fade。完整样式表见
渲染原语参考。
标题、轴名与选项
bar(
    [[320, 210], [450, 280], [510, 190]],
    labels=["一月", "二月", "三月"],
    series_labels=["本站", "隔壁站"],
    title="每月活跃用户",  # 默认在绘图区上方居中
    xlabel="月份",
    ylabel="人数",
    title_align="left",  # 需要时改回左对齐
    grid=True,
    axis_style="handdrawn",
    legend_loc="bottom",
)
图表语义参数留在函数签名里;grid、axis_style、legend_loc、legend_ncol、
x_label_rotation、bar_gap、group_gap 等下层选项通过类型化的选项包透传。
完整列表见
ChartOptions 表。
API 分层
库里刻意分成五层,按需要的控制力选择即可:
| 层 | 提供什么 | 入口 |
|---|---|---|
| L0 素材 | 腿素材的元数据与内置图形 | Leg、LegLibrary、load_leg |
| L1 渲染原语 | 单条丝袜、文字、手绘线条 | render_stocking、StockingStyle、STYLES、draw_text、sketch_* |
| L2 自由柱状图 | 画布、基线、任意位置贴腿 | BarPlot、Scale、Canvas |
| L3 布局封装 | 统一间距、自动选腿 | add_bars、add_grouped_bars、add_paired_bars |
| L4 一行出图 | 数据归一 + 全自动布局 | bar、mirror_bar |
例如 L2/L3 可以自己摆放每一条腿:
from stockchart import BarPlot, Scale

plot = BarPlot(1200)
plot.add_bars([300, 500, 400], style="black_sheer")
plot.add_x_labels(["A", "B", "C"])
plot.add_y_axis(Scale((0, 500), (0, 760)))
plot.add_title("自由排版")
plot.save("chart.png")
输出
BarPlot 输出 PNG,也可以直接拿 PIL Image 或 NumPy 数组:
plot.save("chart.png", scale=2)  # 2 倍像素密度的 PNG
image = plot.to_pil()
array = plot.to_numpy()
scale 控制输出像素密度;丝袜纹理与光影会按该密度重新生成。库不提供 SVG / PDF
输出:袜身是逐像素算法,转矢量需要另写渲染器,输出只有 PNG。
文档
开发
git clone https://github.com/xie-huaaaan/stockchart.git
cd stockchart
uv sync
uv run python -m pytest
uv run ruff check . && uv run ruff format .
uv run python -m pyright
欢迎提 issue 或 PR。
状态
0.1.x 是早期公开版本。渲染管线已经稳定,但公开 API 仍可能在小版本中调整。
许可证
Copyright © 2026 xie-huaaaan。
源代码以 Mozilla Public License 2.0(MPL-2.0)发布。你可以在闭源项目中
使用 stockchart;如果修改了受 MPL 覆盖的源文件,这些文件需要继续以 MPL-2.0 提供。
内置腿部素材(src/stockchart/assets/leg_*.svg 与 legs.json)为
All Rights Reserved(保留所有权利),不在 MPL-2.0 覆盖范围内,详见
素材许可。素材可用于通过 stockchart 渲染图表,
你生成的图表归你所有;素材本身除作为未修改的完整软件包的一部分外,不得单独提取或再分发。
1 maintainer

Metadata
1 maintainer
Release files for stockchart 0.1.1
For a detailed explanation of source distributions (sdists) and built distributions (wheels), please see the package formats documentation.
Source distribution (sdist)
| File | Size | Uploaded | Provenance | Actions |
|---|---|---|---|---|
| stockchart-0.1.1.tar.gz | 6.1 MB | With provenance | Details for stockchart-0.1.1.tar.gz |
Built distribution (wheel)
| File | Interpreter | ABI | Platform | Actions Reset |
|---|---|---|---|---|
| stockchart-0.1.1-py3-none-any.whl | Python 3 | none | any | Details for stockchart-0.1.1-py3-none-any.whl |
Total release size: 12.2 MB
Release files / stockchart-0.1.1.tar.gz
| Download URL | stockchart-0.1.1.tar.gz |
|---|---|
| Size | 6.1 MB |
| Tags | Source |
|
SHA-256 checksum How to use checksums |
13611406ab99636a909094d8efb9c8268b8d76d2dff7247f0e2b2eabd0ee45fb
|
|
BLAKE2b-256 checksum How to use checksums |
7a1763f9bd268420f8fe28002e8dfbdcfad0a3bd610e5780361d9785877caf2a
|
| Upload date | |
|
Uploaded using Trusted Publishing? What is trusted publishing? |
Yes |
| Uploaded via |
twine/7.0.0 CPython/3.13.16
|
Provenance
Provenance describes where a file came from. On PyPI, provenance is shared via attestations, which provide a verifiable record of the build or publishing details. View details, limitations and caveats.


PyPI Publish Attestation
PyPI verified that this artifact, at this checksum, originated from the publisher listed below.
Signed by GitHub Actions, verified by PyPI on Nov 1, 2026.
Transparency logRelease files / stockchart-0.1.1-py3-none-any.whl
| Download URL | stockchart-0.1.1-py3-none-any.whl |
|---|---|
| Size | 6.1 MB |
| Tags | Python 3 |
|
SHA-256 checksum How to use checksums |
22e94595016c9976ffefca6f75d123d7a6853f2405480ddfa662bcf170a685a9
|
|
BLAKE2b-256 checksum How to use checksums |
594d987b4ab46b7aa20957deffd068ef77ecbaf0fd4a2cc36d1d2e746907371a
|
| Upload date | |
|
Uploaded using Trusted Publishing? What is trusted publishing? |
Yes |
| Uploaded via |
twine/7.0.0 CPython/3.13.16
|
Provenance
Provenance describes where a file came from. On PyPI, provenance is shared via attestations, which provide a verifiable record of the build or publishing details. View details, limitations and caveats.
PyPI Publish Attestation
PyPI verified that this artifact, at this checksum, originated from the publisher listed below.
Signed by GitHub Actions, verified by PyPI on Nov 1, 2026.
Transparency logSecurity for stockchart 0.1.1
Provenance
Provenance describes where a file came from. On PyPI, provenance is shared via attestations, which provide a verifiable record of the build or publishing details. View details, limitations and caveats.
Full provenance
Both files in this release have been uploaded with provenance metadata.
Attestation for stockchart-0.1.1.tar.gz
PyPI Publish Attestation
PyPI verified that this artifact, at this checksum, originated from the publisher listed below.
Signed by GitHub Actions, verified by PyPI on Nov 1, 2026.
Transparency logA note on package security
PyPI is a repository for distributing packages, not a service for auditing them. While third-party security researchers and our staff do their best to detect and remove malicious packages, PyPI cannot guarantee the quality, security or suitability of any given package.
To learn more about protecting yourself from malicious actors, visit our package security documentation.














