
Matplotlib extension to plot real time data

Project description
StreamEngine
StreamEngine is an extention of the matplotlib Animation class which enables the user to easily plot real time streaming data.
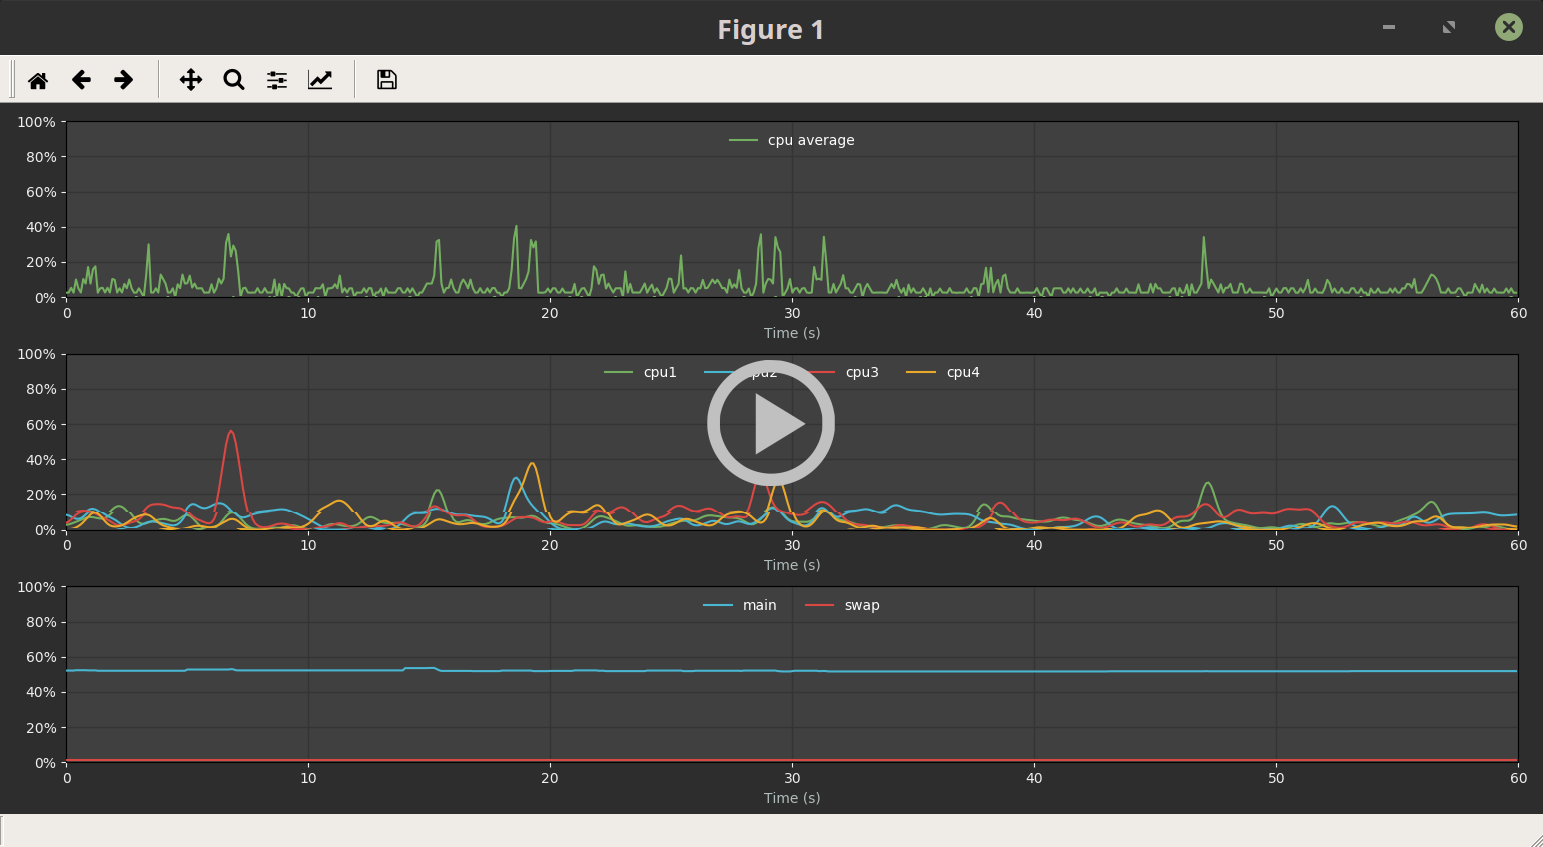
Install
pip install stream_engine
Basic Example
import matplotlib.pyplot as plt
from stream_engine.stream import Stream, StreamAnimation

if __name__ == '__main__':
    from psutil import cpu_percent

    # Define a function that returns data. This function will be repetedly called.
    def cpu_average():
        return [cpu_percent()]

    fig = plt.figure(figsize=(10, 3))
    ax1 = fig.add_subplot(111)
    ax1.set_xlim(0, 600)
    ax1.set_ylim(0, 100)

    anim = StreamAnimation(fig, interval=100)  # Create a StreamAnimation object.
    anim.add_stream(Stream(ax1, cpu_average))  # Add a Stream with a data function to it.

    plt.tight_layout()
    plt.show()
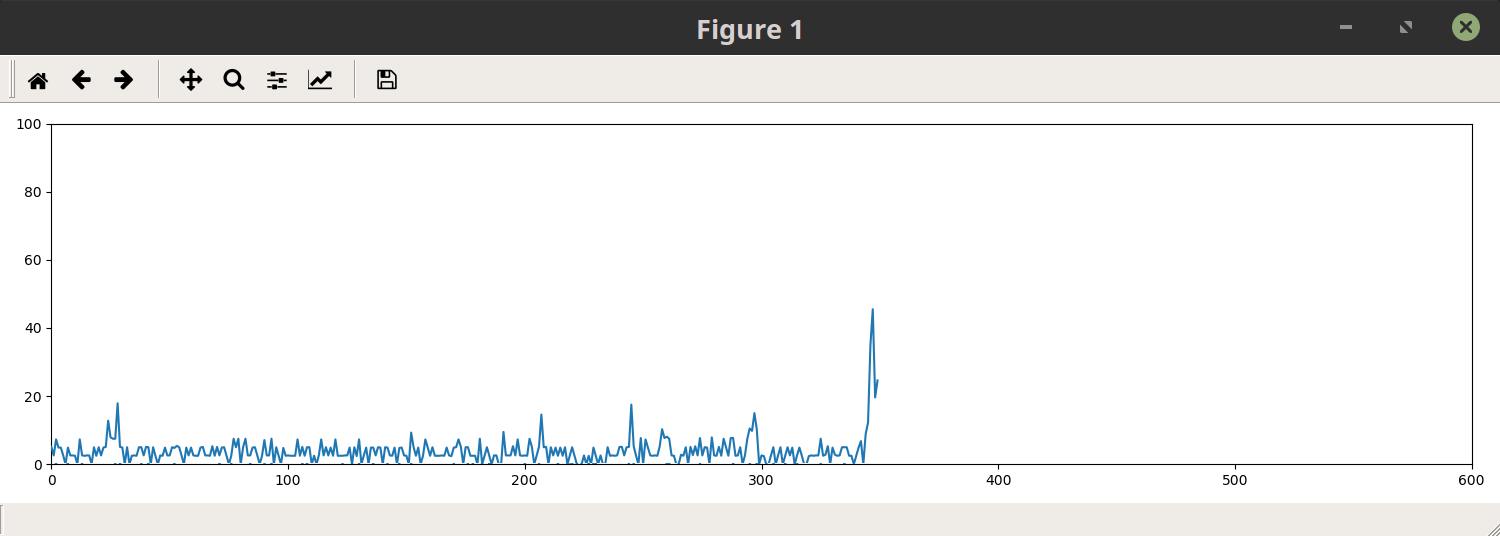
Streams With Multiple Inputs.
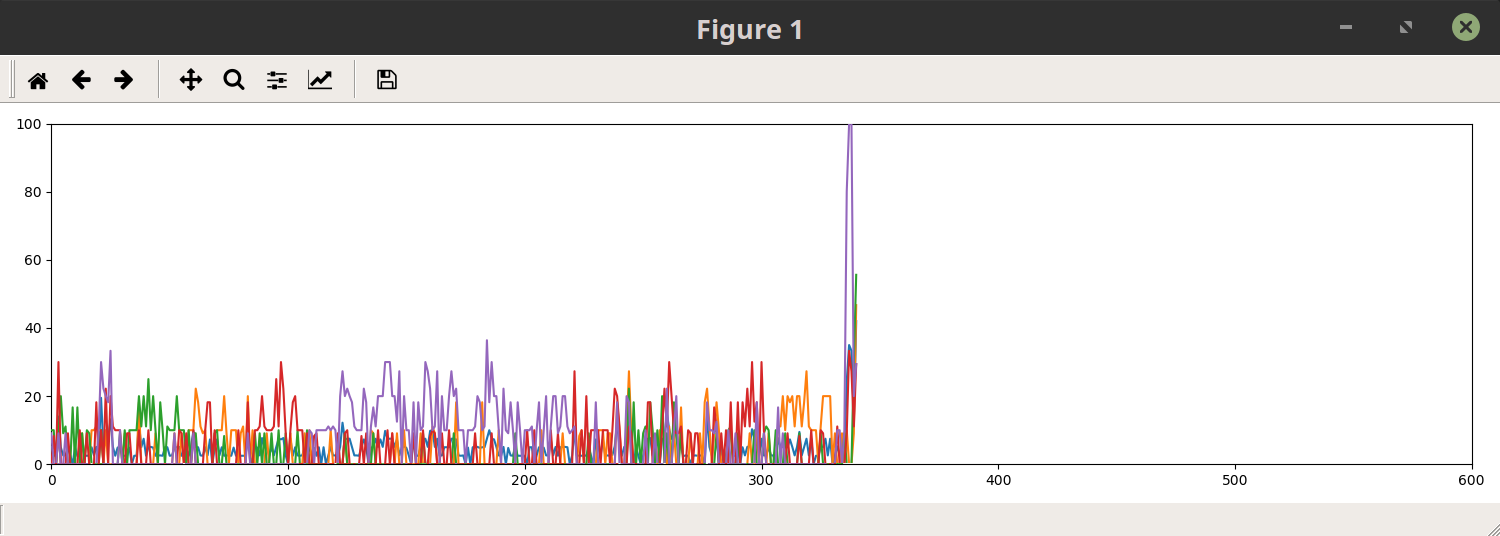
A new Stream.thread is created for each value in a list retured by the defined data function. A Stream.thread is simply an objects that holds the line and line data to be plotted for the Stream.
Note: A data function must return a list of data. The above data function returns one value so we bracket the return value.
For example if we were to create a new function that returns the cpu % for each individual cpu im our computer, instead of a single average. A new Stream.thread will be added to the Stream for each cpu in our computer (a new line to be plotted).
from psutil import cpu_percent
def all_cpu():
    return cpu_percent(percpu=True)  # Note: we do not have to bracket the return because
                                     # psutil.cpu_percent(percpu=True) returns a list by default.
                                     # returns --> [cpu1%, cpu2%, cpu3%, cpu4%] (4 stream.threads created)
Now lets create a new Stream with our new data function and add it to our StreamAnimation object.
ave_stream = Stream(ax1, cpu_average)
cpu_stream = Stream(ax1, all_cpu)
anim.add_stream(ave_stream, cpu_stream)
Processing Data
By default no processing is done to the data. It is simply graphed as it is recieved. However you can define a custom data processor to process Stream data before it is plotted.
In our example above we are plotting the raw cpu percent values which are very sporadic and hard to read. We can define a custom processor to smooth the data before we plot it which will make it more readable and mimic a standard system monitor tool.
A Stream processor takes in a thread (the line object and the line data) and data (the next value to be added tot the thread).
# The default data processor.
def stream_proc(thread, data):
    thread['data'].appendleft(data)  # adds the new data from our data function to the thread.
    thread['line'].set_ydata(thread['data'])  # updates the line with our new data.
    return thread['line']  # sends the line to be plotted
If we want to filter the data. We can define a filter processor.
from scipy.ndimage.filters import gaussian_filter1d

def filter_proc(thread, data):
    thread['data'].appendleft(data)
    thread['line'].set_ydata(gaussian_filter1d(thread['data'], 3))  # apply a guassian filter to our data.
    return thread['line']

# We add the filter_proc to the Streams we want to be filtered.
# In this case we will filter the cpu_stream and leave the ave_stream unfiltered.
cpu_stream = Stream(ax1, all_cpu, proc=filter_proc)
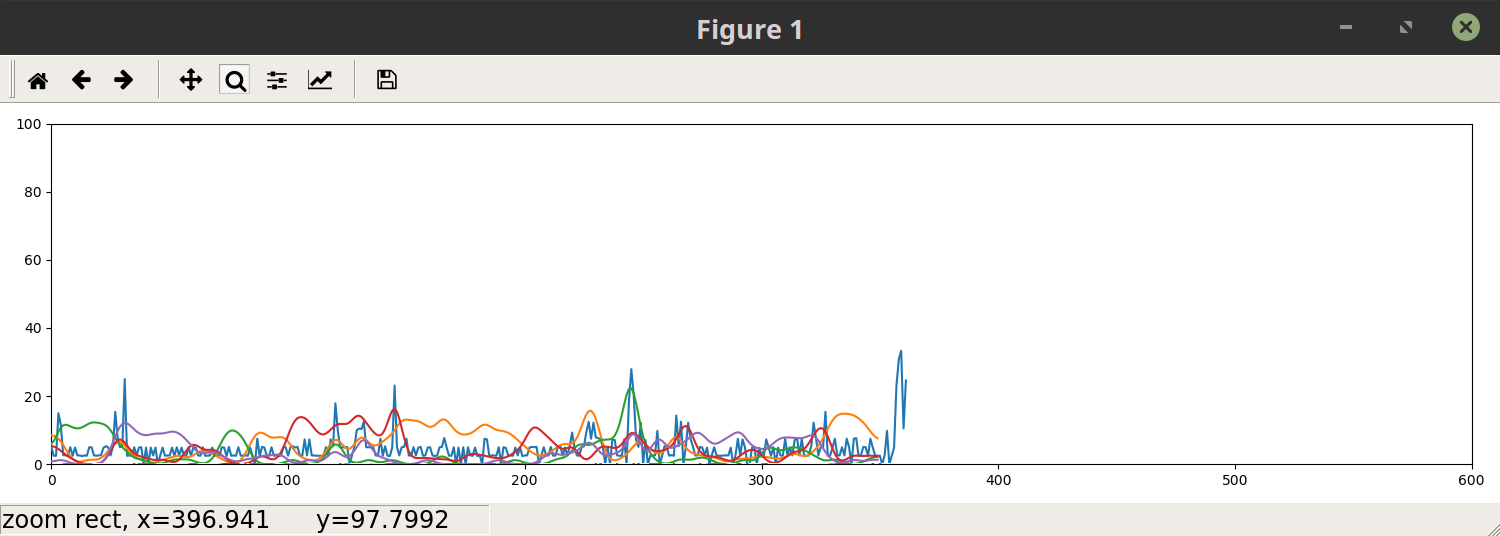
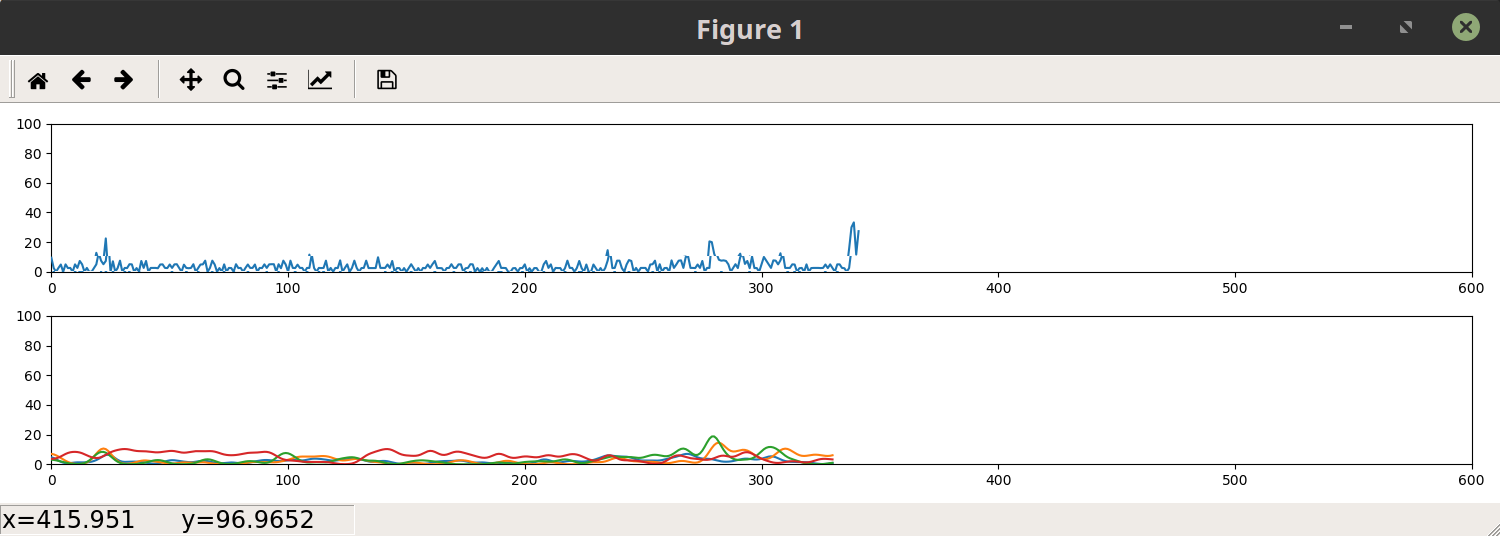
The data now looks much cleaner. Lets put each Stream on its own axes.
# Just create a new axes and reassign one of the streams to the new axes.
ax1 = fig.add_subplot(211)    # change the fig configuration to hold more than one plot
ax1.set_xlim(0, 600)
ax1.set_ylim(0, 100)

ax2 = fig.add_subplot(212)
ax2.set_xlim(0, 600)
ax2.set_ylim(0, 100)

ave_stream = Stream(ax1, cpu_average)
cpu_stream = Stream(ax2, all_cpu, proc=filter_proc)  # Set to ax2
anim.add_stream(ave_stream, cpu_stream)
Styles
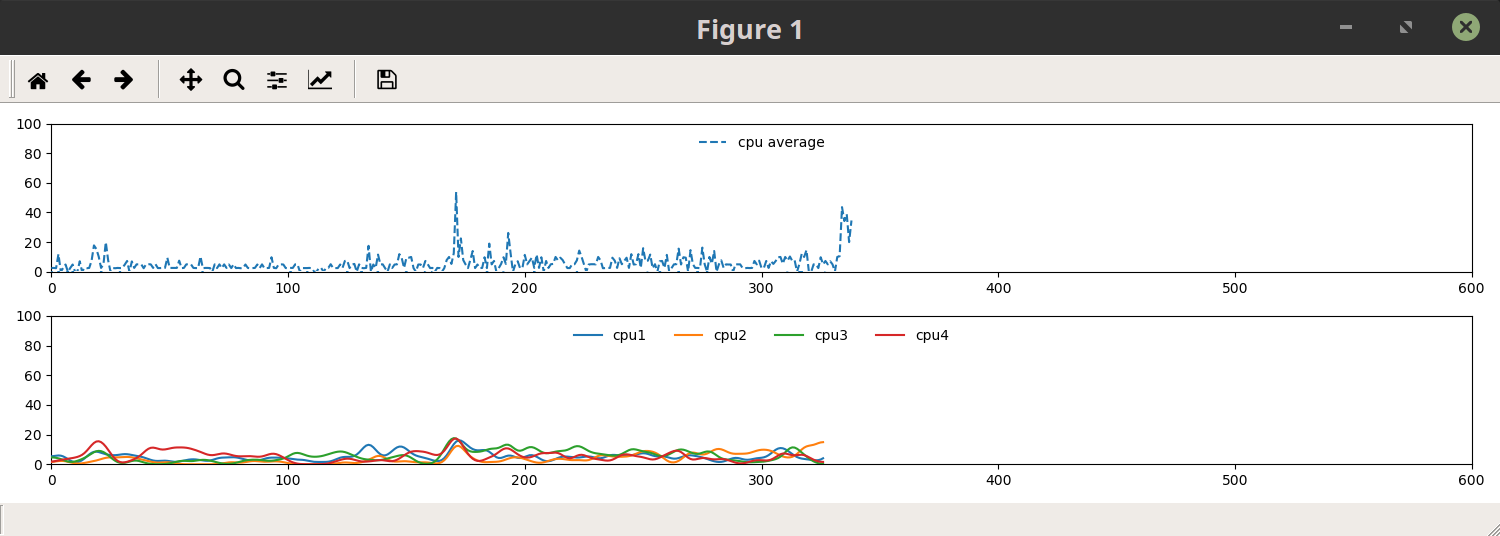
Each Stream line can be styled like any other matplotlib line.
# A style should be passed as a list containing dicts eg.--> style=[{'color': 'r', 'label': 'foo'}]

# For single Streams
ave_style = [{'linestyle': '--', 'label': 'cpu average'}]
ave_stream = Stream(ax1, cpu_average, style=ave_style)

# For multiple streams.
cpu_style = [{'linestyle': '-', 'label': 'cpu1'},
             {'linestyle': '-', 'label': 'cpu2'},
             {'linestyle': '-', 'label': 'cpu3'},
             {'linestyle': '-', 'label': 'cpu4'}]
cpu_stream = Stream(ax2, all_cpu, proc=filter_proc, style=cpu_style)

ax1.legend(framealpha=.0, loc=9)
ax2.legend(framealpha=.0, loc=9, ncol=4)
Taking It Further.
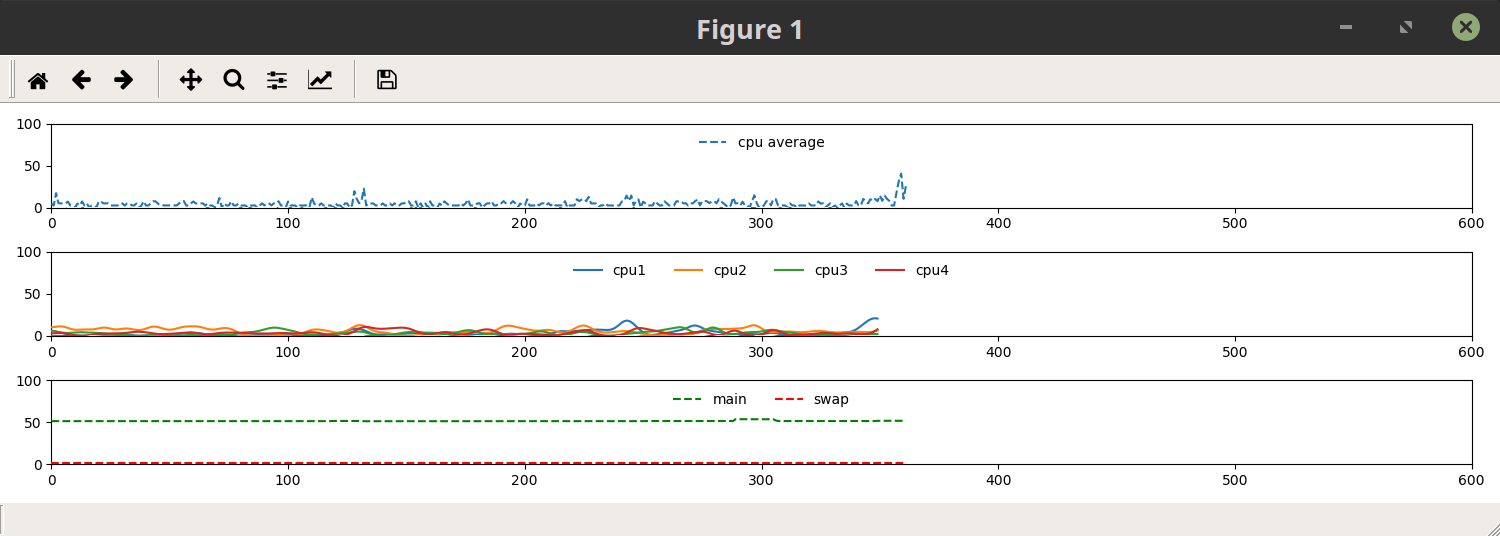
Lets add a new Stream that represents our computers memory usage.
# Lets make our new data function that returns our computers memory usage.
from psutil import virtual_memory, swap_memory

def memory_percent():
    return virtual_memory().percent, swap_memory().percent   # returns a tuple of data which is also exceptable.

# We want this stream to be on it's own axes so make a third axes.
ax3 = fig.add_subplot(313)
ax3.set_xlim(0, 600)
ax3.set_ylim(0, 100)

# Lets create our Stream object.
# Lets also create a style for it while we're at it.
mem_style = [{'linestyle': '--', 'label': 'main', 'color': 'g'},
             {'linestyle': '--', 'label': 'swap', 'color': 'r'}]
mem_stream = Stream(ax3, mem_percent, style=mem_style)
ax3.legend(framealpha=.0, loc=9, ncol=2)

# Add to our StreamAnimation object.
 anim.add_stream(ave_stream, cpu_stream, mem_stream)
Putting It All Together
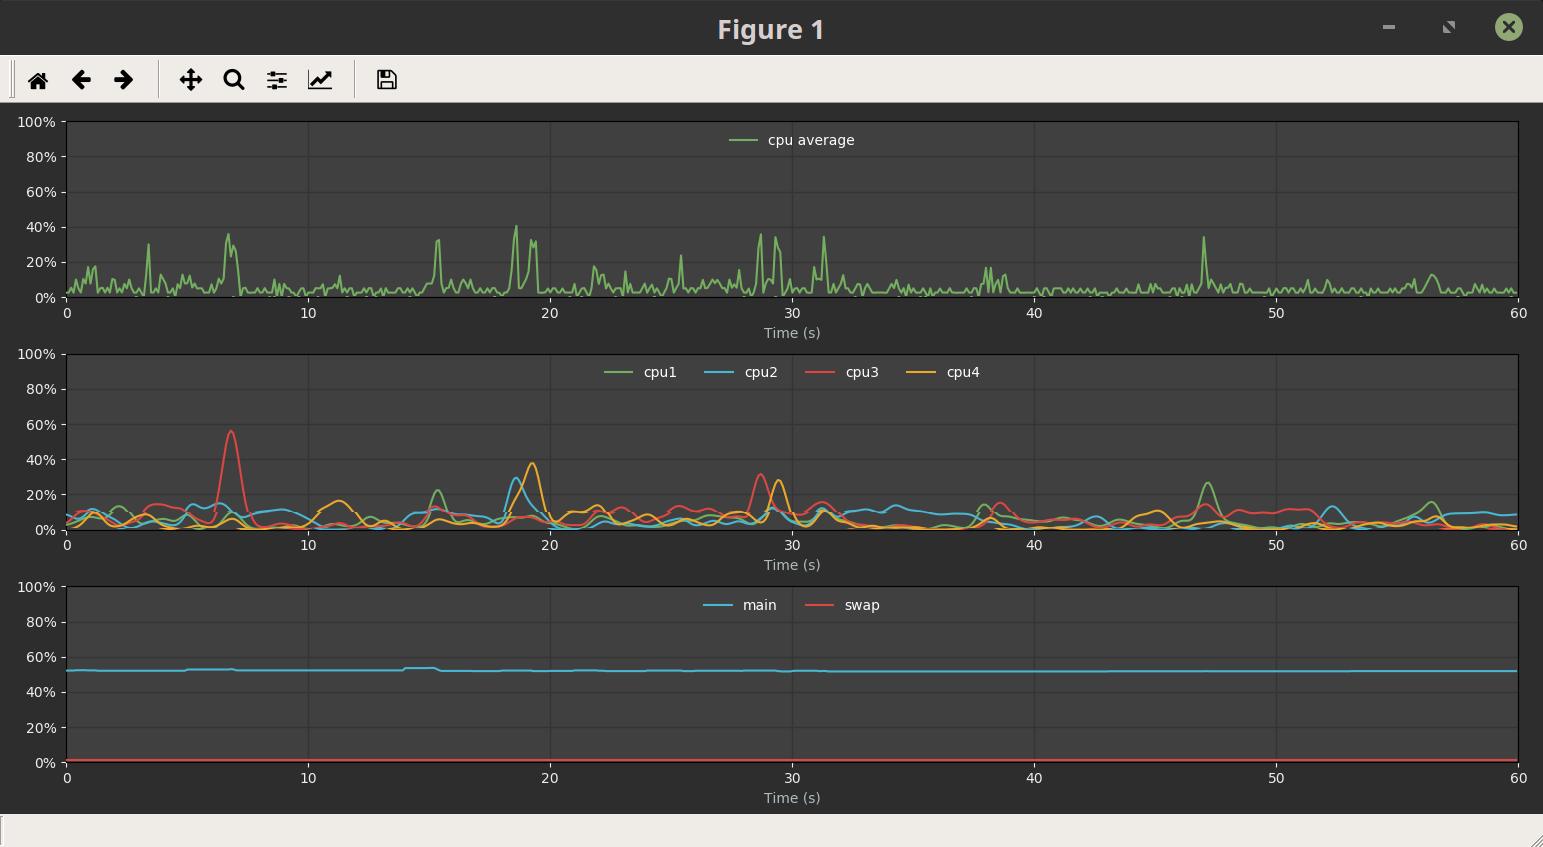
import matplotlib.pyplot as plt
from stream_engine.stream import Stream, StreamAnimation
from matplotlib.ticker import FuncFormatter, FormatStrFormatter

base_style = {'figure.facecolor': '2d2d2d',
              'axes.facecolor': '404040',
              'axes.labelcolor': 'b0bdbb',
              'axes.prop_cycle': "cycler('color', ['74af60', '49b6d2', 'db4743', 'eba92b'])",
              'axes.grid': 'True',
              'grid.color': '343434',
              'grid.linestyle': '-',
              'grid.linewidth': '1.0',
              'text.color': 'b0bdbb',
              'xtick.color': 'efefef',
              'ytick.color': 'efefef'}

ave_style = [{'label': 'cpu average'}]

cpu_style = [{'label': 'cpu1'},
             {'label': 'cpu2'},
             {'label': 'cpu3'},
             {'label': 'cpu4'}]

mem_style = [{'label': 'main', 'color': '#49b6d2'},
             {'label': 'swap', 'color': '#db4743'}]


def config(*args):
    def x_format(x, pos):
        return '%1.0f' % abs(x / 10)
    for ax in args:
        ax.xaxis.set_major_formatter(FuncFormatter(x_format))
        ax.yaxis.set_major_formatter(FormatStrFormatter('%.0f%%'))
        ax.set_xlabel('Time (s)')

        leg = ax.legend(loc=9, ncol=6, framealpha=.2)
        for text in leg.get_texts():
            text.set_color('w')

with plt.style.context(base_style):
    fig = plt.figure(figsize=(8, 5))
    ax1 = fig.add_subplot(311)
    ax1.set_xlim(0, 600)
    ax1.set_ylim(0, 100)

    ax2 = fig.add_subplot(312)
    ax2.set_xlim(0, 600)
    ax2.set_ylim(0, 100)

    ax3 = fig.add_subplot(313)
    ax3.set_xlim(0, 600)
    ax3.set_ylim(0, 100)


if __name__ == '__main__':
    from psutil import cpu_percent, virtual_memory, swap_memory

    def cpu_percents():
        return cpu_percent(percpu=True)

    def cpu_average():
        return [cpu_percent()]

    def memory_percent():
        return virtual_memory().percent, swap_memory().percent

    ave_stream = Stream(ax1, cpu_average, buffer=5, style=ave_style)
    cpu_stream = Stream(ax2, cpu_percents,  buffer=5, style=cpu_style, filt=True)
    mem_stream = Stream(ax3, memory_percent, buffer=5, style=mem_style)

    config(ax1, ax2, ax3)

    anim = StreamAnimation(fig, interval=100)
    anim.add_stream(ave_stream, cpu_stream, mem_stream)

    plt.tight_layout()
    plt.show()
Release history Release notifications | RSS feed

Download files
Download the file for your platform. If you're not sure which to choose, learn more about installing packages.
Source Distribution
Built Distribution
Filter files by name, interpreter, ABI, and platform.
If you're not sure about the file name format, learn more about wheel file names.
Copy a direct link to the current filters
File details
Details for the file stream_engine-0.1.0.tar.gz.
File metadata
- Download URL: stream_engine-0.1.0.tar.gz
- Upload date:
- Size: 5.2 kB
- Tags: Source
- Uploaded using Trusted Publishing? No
File hashes
| Algorithm | Hash digest | |
|---|---|---|
| SHA256 |
4c75fafc2bb6f8b867bc2a1ac56c044562a151e42cc25dfdeee0e4afb7fe6e96
|
|
| MD5 |
c9d08ad53f8cb867f8dd8a24a42a5b0c
|
|
| BLAKE2b-256 |
b77ff4d2fb9e05e6efa6a0a10b1b8925f9be3caa12be6ba40c68648a70bff6ff
|
File details
Details for the file stream_engine-0.1.0-py3-none-any.whl.
File metadata
- Download URL: stream_engine-0.1.0-py3-none-any.whl
- Upload date:
- Size: 4.9 kB
- Tags: Python 3
- Uploaded using Trusted Publishing? No
File hashes
| Algorithm | Hash digest | |
|---|---|---|
| SHA256 |
c8a2debfb90a44377d6cc04e28246fea73eef04587601209c886f4806b44a506
|
|
| MD5 |
d833ecc562c12d0d7ae26cd30bfc9001
|
|
| BLAKE2b-256 |
ab4ca8fd4e2be66aac0414c5c751fcb6b9d35f0a2db9e4a11f940097adb69a7f
|






