Enjoy animating images into GIFs and MP4s!

Project description
🌈 StreamJoy 😊


🔥 Enjoy animating!
Streamjoy turns your images into animations using sensible defaults for fun, hassle-free creation.
It cuts down the boilerplate and time to work on animations, and it's simple to start with just a few lines of code.
Install it with just pip to start, blazingly fast!
pip install streamjoy
Or, try out a basic web app version here:
https://huggingface.co/spaces/ahuang11/streamjoy
🛠️ Built-in features
- 🌐 Animate from URLs, files, and datasets
- 🎨 Render images with default or custom renderers
- 🎬 Provide context with a short intro splash
- ⏸ Add pauses at the beginning, end, or between frames
- ⚡ Execute read, render, and write in parallel
- 🔗 Connect multiple animations together
🚀 Quick start
🐤 Absolute basics
Stream from a list of images--local files work too!
from streamjoy import stream

if __name__ == "__main__":
    URL_FMT = "https://www.goes.noaa.gov/dimg/jma/fd/vis/{i}.gif"
    resources = [URL_FMT.format(i=i) for i in range(1, 11)]
    stream(resources, uri="goes.gif")  # .gif, .mp4, and .html supported
💅 Polish up
Specify a few more keywords to:
- add an intro title and subtitle
- adjust the pauses
- optimize the GIF thru pygifsicle
from streamjoy import stream

if __name__ == "__main__":
    URL_FMT = "https://www.goes.noaa.gov/dimg/jma/fd/vis/{i}.gif"
    resources = [URL_FMT.format(i=i) for i in range(1, 11)]
    himawari_stream = stream(
        resources,
        uri="goes_custom.gif",
        intro_title="Himawari Visible",
        intro_subtitle="10 Hours Loop",
        intro_pause=1,
        ending_pause=1,
        optimize=True,
    )

👀 Preview inputs
If you'd like to preview the repr before writing, drop uri.
Output:
<AnyStream>
---
Output:
  max_frames: 50
  fps: 10
  display: True
  scratch_dir: streamjoy_scratch
  in_memory: False
---
Intro:
  intro_title: Himawari Visible
  intro_subtitle: 10 Hours Loop
  intro_watermark: made with streamjoy
  intro_pause: 1
  intro_background: black
---
Client:
  batch_size: 10
  processes: True
  threads_per_worker: None
---
Resources: (10 frames to stream)
  https://www.goes.noaa.gov/dimg/jma/fd/vis/1.gif
  ...
  https://www.goes.noaa.gov/dimg/jma/fd/vis/10.gif
---
Then, when ready, call the write method to save the animation!
himawari_stream.write()
🖇️ Connect streams
Connect multiple streams together to provide further context.
from streamjoy import stream, connect

URL_FMTS = {
    "visible": "https://www.goes.noaa.gov/dimg/jma/fd/vis/{i}.gif",
    "infrared": "https://www.goes.noaa.gov/dimg/jma/fd/rbtop/{i}.gif",
}

if __name__ == "__main__":
    visible_stream = stream(
        [URL_FMTS["visible"].format(i=i) for i in range(1, 11)],
        intro_title="Himawari Visible",
        intro_subtitle="10 Hours Loop",
    )
    infrared_stream = stream(
        [URL_FMTS["infrared"].format(i=i) for i in range(1, 11)],
        intro_title="Himawari Infrared",
        intro_subtitle="10 Hours Loop",
    )
    connect([visible_stream, infrared_stream], uri="goes_connected.gif")
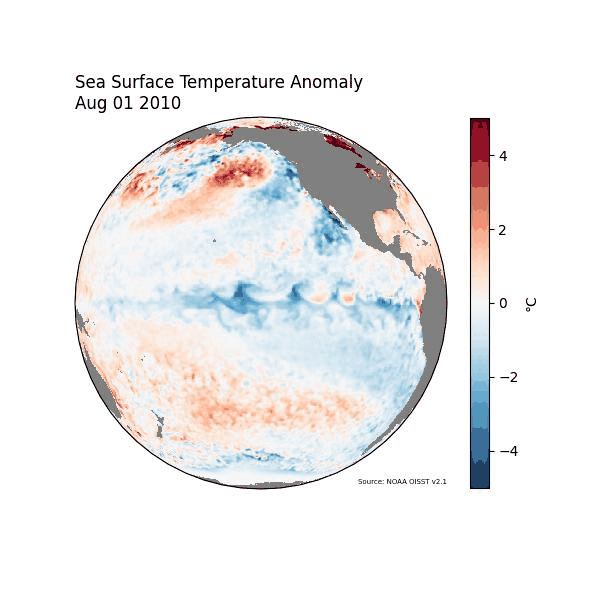
📷 Render datasets
You can also render images directly from datasets, either through a custom renderer or a built-in one, and they'll also run in parallel!
The following example requires xarray, cartopy, matplotlib, and netcdf4.
pip install xarray cartopy matplotlib netcdf4
import numpy as np
import cartopy.crs as ccrs
import matplotlib.pyplot as plt
from streamjoy import stream, wrap_matplotlib

@wrap_matplotlib()
def plot(da, central_longitude, **plot_kwargs):
    time = da["time"].dt.strftime("%b %d %Y").values.item()
    projection = ccrs.Orthographic(central_longitude=central_longitude)
    subplot_kw = dict(projection=projection, facecolor="gray")
    fig, ax = plt.subplots(figsize=(6, 6), subplot_kw=subplot_kw)
    im = da.plot(ax=ax, transform=ccrs.PlateCarree(), add_colorbar=False, **plot_kwargs)
    ax.set_title(f"Sea Surface Temperature Anomaly\n{time}", loc="left", transform=ax.transAxes)
    ax.set_title("Source: NOAA OISST v2.1", loc="right", size=5, y=-0.01)
    ax.set_title("", loc="center")  # suppress default title
    plt.colorbar(im, ax=ax, label="°C", shrink=0.8)
    return fig

if __name__ == "__main__":
    url = (
      "https://www.ncei.noaa.gov/data/sea-surface-temperature-"
      "optimum-interpolation/v2.1/access/avhrr/201008/"
    )
    pattern = "oisst-avhrr-v02r01.*.nc"
    stream(
        url,
        uri="oisst.gif",
        pattern=pattern,  # GifStream.from_url kwargs
        max_files=30,
        renderer=plot,  # renderer related kwargs
        renderer_iterables=[np.linspace(-140, -150, 30)],  # iterables; central longitude per frame (30 frames)
        renderer_kwargs=dict(cmap="RdBu_r", vmin=-5, vmax=5),  # renderer kwargs
        # cmap="RdBu_r", # renderer_kwargs can also be propagated for convenience
        # vmin=-5,
        # vmax=5,
    )
Check out all the supported formats here or best practices here. (Or maybe you're interested in the design--here)
❤️ Made with considerable passion.
🌟 Appreciate the project? Consider giving a star!
Release history Release notifications | RSS feed


Download files
Download the file for your platform. If you're not sure which to choose, learn more about installing packages.
Source Distribution
Built Distribution
Filter files by name, interpreter, ABI, and platform.
If you're not sure about the file name format, learn more about wheel file names.
Copy a direct link to the current filters
File details
Details for the file streamjoy-0.0.10.tar.gz.
File metadata
- Download URL: streamjoy-0.0.10.tar.gz
- Upload date:
- Size: 133.4 kB
- Tags: Source
- Uploaded using Trusted Publishing? No
- Uploaded via: twine/5.1.0 CPython/3.12.4
File hashes
| Algorithm | Hash digest | |
|---|---|---|
| SHA256 |
a6a121a1e727bcb683d1d206f0960deca71f51a7625fc07df8c77ae93f101e46
|
|
| MD5 |
e6d89809d89f3233db5a813fde098974
|
|
| BLAKE2b-256 |
26afd62a0e5166dafce22ddf8ea51e99e1f0be7f47e8dbc8477601003d78755e
|
File details
Details for the file streamjoy-0.0.10-py3-none-any.whl.
File metadata
- Download URL: streamjoy-0.0.10-py3-none-any.whl
- Upload date:
- Size: 32.2 kB
- Tags: Python 3
- Uploaded using Trusted Publishing? No
- Uploaded via: twine/5.1.0 CPython/3.12.4
File hashes
| Algorithm | Hash digest | |
|---|---|---|
| SHA256 |
6df47f39f234545b95e264c5e18fc1721b93d386694dce75cf410e119bf8dec3
|
|
| MD5 |
8898993e8cd2c932d49ca47fd0369250
|
|
| BLAKE2b-256 |
7769e1a30242b444cf40708a638be7a44f337a3ae8f38393deb658539a9343ef
|


