An wrapper of the threeJS globe to display points and labels on a globe.

Project description
streamlit_globe
Streamlit Globe is a wrapper around globe.gl and provides some simple data visualization functionality in Streamlit. In the current release points and labels are implemented.
Usage
- You either have to provide pointsData or labelsData (or both) to render the globe.
- Watch out to create the correct object structure for both arrays.
- daytime parameter accepts 'day' or 'night'
- You have to provide a width and a height, this is not determined automatically by streamlit.
Example usage
from streamlit_globe import streamlit_globe
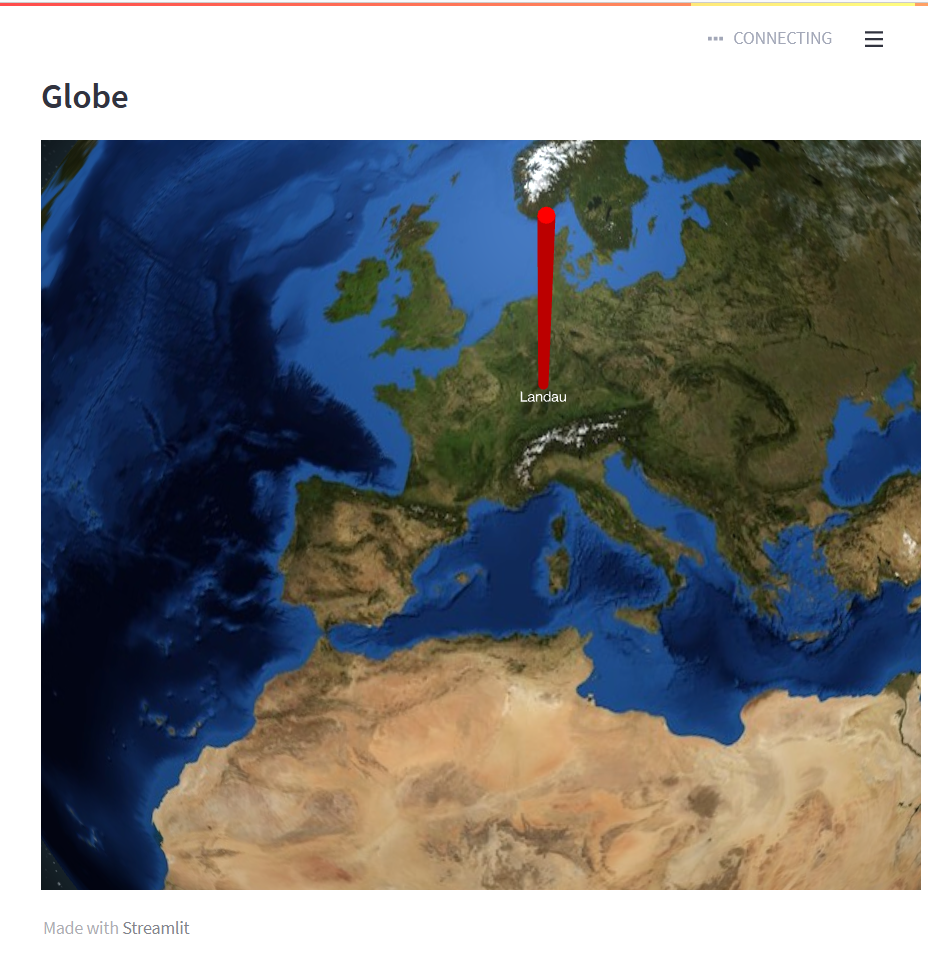
st.subheader("Globe")
pointsData=[{'lat': 49.19788311472706, 'lng': 8.114625722364316, 'size': 0.3, 'color': 'red'}]
labelsData=[{'lat': 49.19788311472706, 'lng': 8.114625722364316, 'size': 0.3, 'color': 'red', 'text': 'Landau'}]
streamlit_globe(pointsData=pointsData, labelsData=labelsData, daytime='day', width=800, height=600)
Release history Release notifications | RSS feed

Download files
Download the file for your platform. If you're not sure which to choose, learn more about installing packages.
Source Distribution
streamlit_globe-0.2.1.tar.gz
(4.7 MB
view details)
Built Distribution
Filter files by name, interpreter, ABI, and platform.
If you're not sure about the file name format, learn more about wheel file names.
Copy a direct link to the current filters
File details
Details for the file streamlit_globe-0.2.1.tar.gz.
File metadata
- Download URL: streamlit_globe-0.2.1.tar.gz
- Upload date:
- Size: 4.7 MB
- Tags: Source
- Uploaded using Trusted Publishing? No
- Uploaded via: twine/4.0.0 CPython/3.8.13
File hashes
| Algorithm | Hash digest | |
|---|---|---|
| SHA256 |
a0f925f3a19cc3554ee7f06393d6462a29382597d11c40b0adc3b62e44a8e536
|
|
| MD5 |
f5d6ee7a316a9cd027ae2a4d0076006a
|
|
| BLAKE2b-256 |
5b83afd0d3d9afb905fba65e0d1505995009d23d501b27b22bdd5af4e9ed9b33
|
File details
Details for the file streamlit_globe-0.2.1-py3-none-any.whl.
File metadata
- Download URL: streamlit_globe-0.2.1-py3-none-any.whl
- Upload date:
- Size: 4.7 MB
- Tags: Python 3
- Uploaded using Trusted Publishing? No
- Uploaded via: twine/4.0.0 CPython/3.8.13
File hashes
| Algorithm | Hash digest | |
|---|---|---|
| SHA256 |
c67b2057ed01d7177cd25fd7cab2d1b087e73cef27861c6a30aecb6db48d5900
|
|
| MD5 |
dd815b8eeccd21e203f185fc8a9153ec
|
|
| BLAKE2b-256 |
7b350a2ad84145b75e473f163a7f185412dd94b1b79679ba63a3dcda8c07bc61
|


