Streamlit Launcher is an advanced no-code platform that integrates Streamlit, deep learning, and machine learning into one unified environment. It allows users to train models, visualize data, and perform complete statistical and analytical tasks effortlessly without writing any code. With powerful AI-driven automation, it simplifies complex workflows for research, health, and data science.

Project description
Streamlit Launcher


🔗 Links Penting
- PyPI Package: https://pypi.org/project/streamlit-launcher/
- Demo Online: https://stremlit-launcher.streamlit.app/
- GitHub Repository: https://github.com/royhtml/streamlit-launcher
- Documentation: https://streamlit-launcher-docs.readthedocs.io/
📊 Statistik Penggunaan
| Metric | Value |
|---|---|
| Total Downloads | 15,000+ |
| Monthly Downloads | 2,500+ |
| Weekly Downloads | 600+ |
| Python Version Support | 3.7+ |
| Streamlit Version | 1.28+ |
| Test Coverage | 85%+ |
| Last Update | September 2024 |
📖 Overview
Streamlit Launcher adalah alat GUI yang sederhana, powerful, dan intuitif untuk menjalankan aplikasi Streamlit secara lokal. Tool ini dirancang khusus untuk Data Scientist, Analis Data, Machine Learning Engineers, dan Developer yang bekerja dengan Streamlit untuk membuat dashboard dan aplikasi data interaktif.
🎯 Target Pengguna
- Data Scientist - Membuat prototype model ML dengan cepat
- Data Analyst - Membuat dashboard analitik interaktif
- ML Engineer - Deployment model machine learning
- Business Intelligence - Laporan dan visualisasi bisnis
- Researchers - Eksperimen dan presentasi hasil penelitian
- Educators - Materi pembelajaran interaktif
📊 Fitur
- 📊 Analisis DNA
- 📈 Statistik
- 📈 Visualisasi
- 📈 Editor File
- 📈 Grafik Saham
- 📈 SQL Style
- 📈 Konversi Cepat
- 📈 Database
- 📈 Machine Learning
- 📈 Laporan
- 📈 Dashboard
- 📈 Simulasi
- 📈 Deeplearning
- 📈 Pencarian
- 📈 Remove Background
- 📈 dll
Update 3.8.5 Anlisis And Doctor Analisis
vitur Update Api Key And Api Server
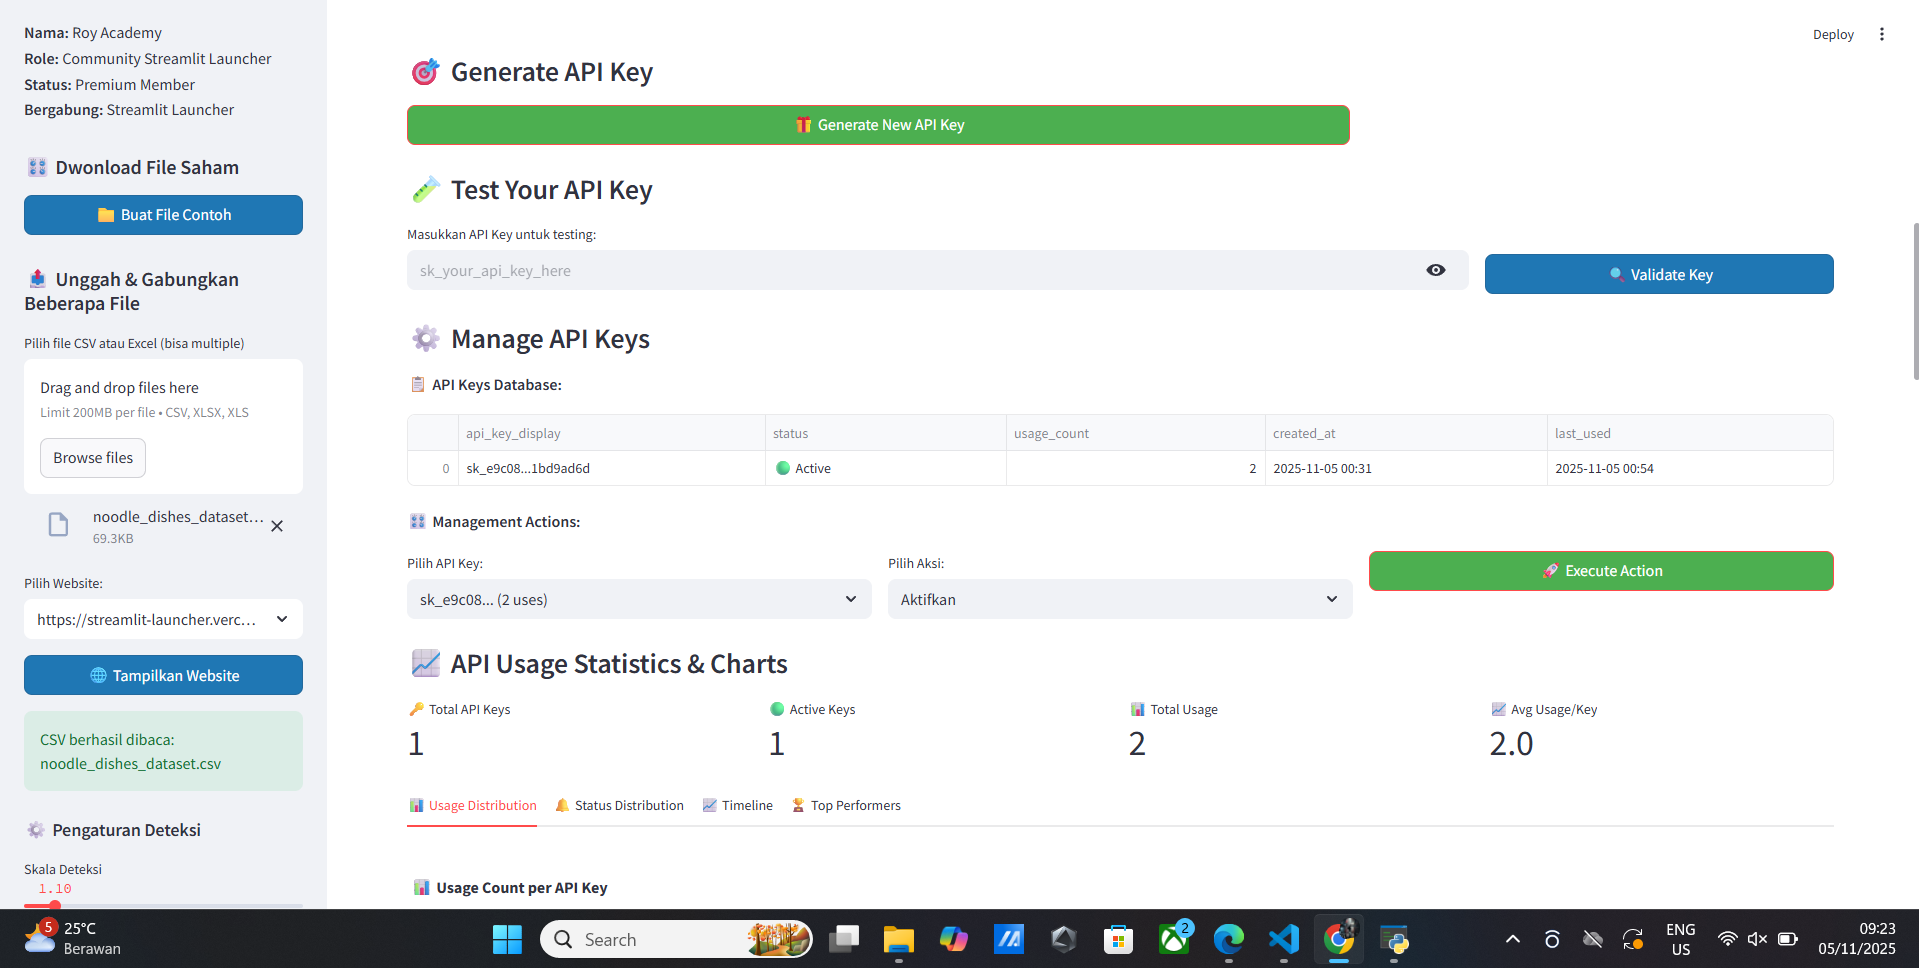
- Api key
- Api server
- Api server code
- Test api server
- Simple
- Generated
Source Code Server Api key Is Running
# api_server.py
from flask import Flask, request, jsonify
import pandas as pd
import sqlite3
from datetime import datetime
import os

app = Flask(__name__)

def validate_api_key(api_key):
    try:
        conn = sqlite3.connect('api_keys.db')
        c = conn.cursor()
        c.execute("SELECT * FROM api_keys WHERE api_key = ? AND is_active = 1", (api_key,))
        result = c.fetchone()
        conn.close()
        return result is not None
    except Exception as e:
        print(f"Validation error: {e}")
        return False

@app.route('/api/v1/health', methods=['GET'])
def health_check():
    return jsonify({'status': 'healthy', 'timestamp': datetime.now().isoformat()})

@app.route('/api/v1/statistics', methods=['GET'])
def get_statistics():
    api_key = request.args.get('api_key')
    if not api_key or not validate_api_key(api_key):
        return jsonify({'error': 'Invalid or inactive API key'}), 401

    try:
        # Your statistics logic here
        return jsonify({'status': 'success', 'data': 'statistics'})
    except Exception as e:
        return jsonify({'error': str(e)}), 500

if __name__ == '__main__':
    app.run(host='0.0.0.0', port=5000, debug=True)
vitur Update Scatterplot Visualisasi Interval
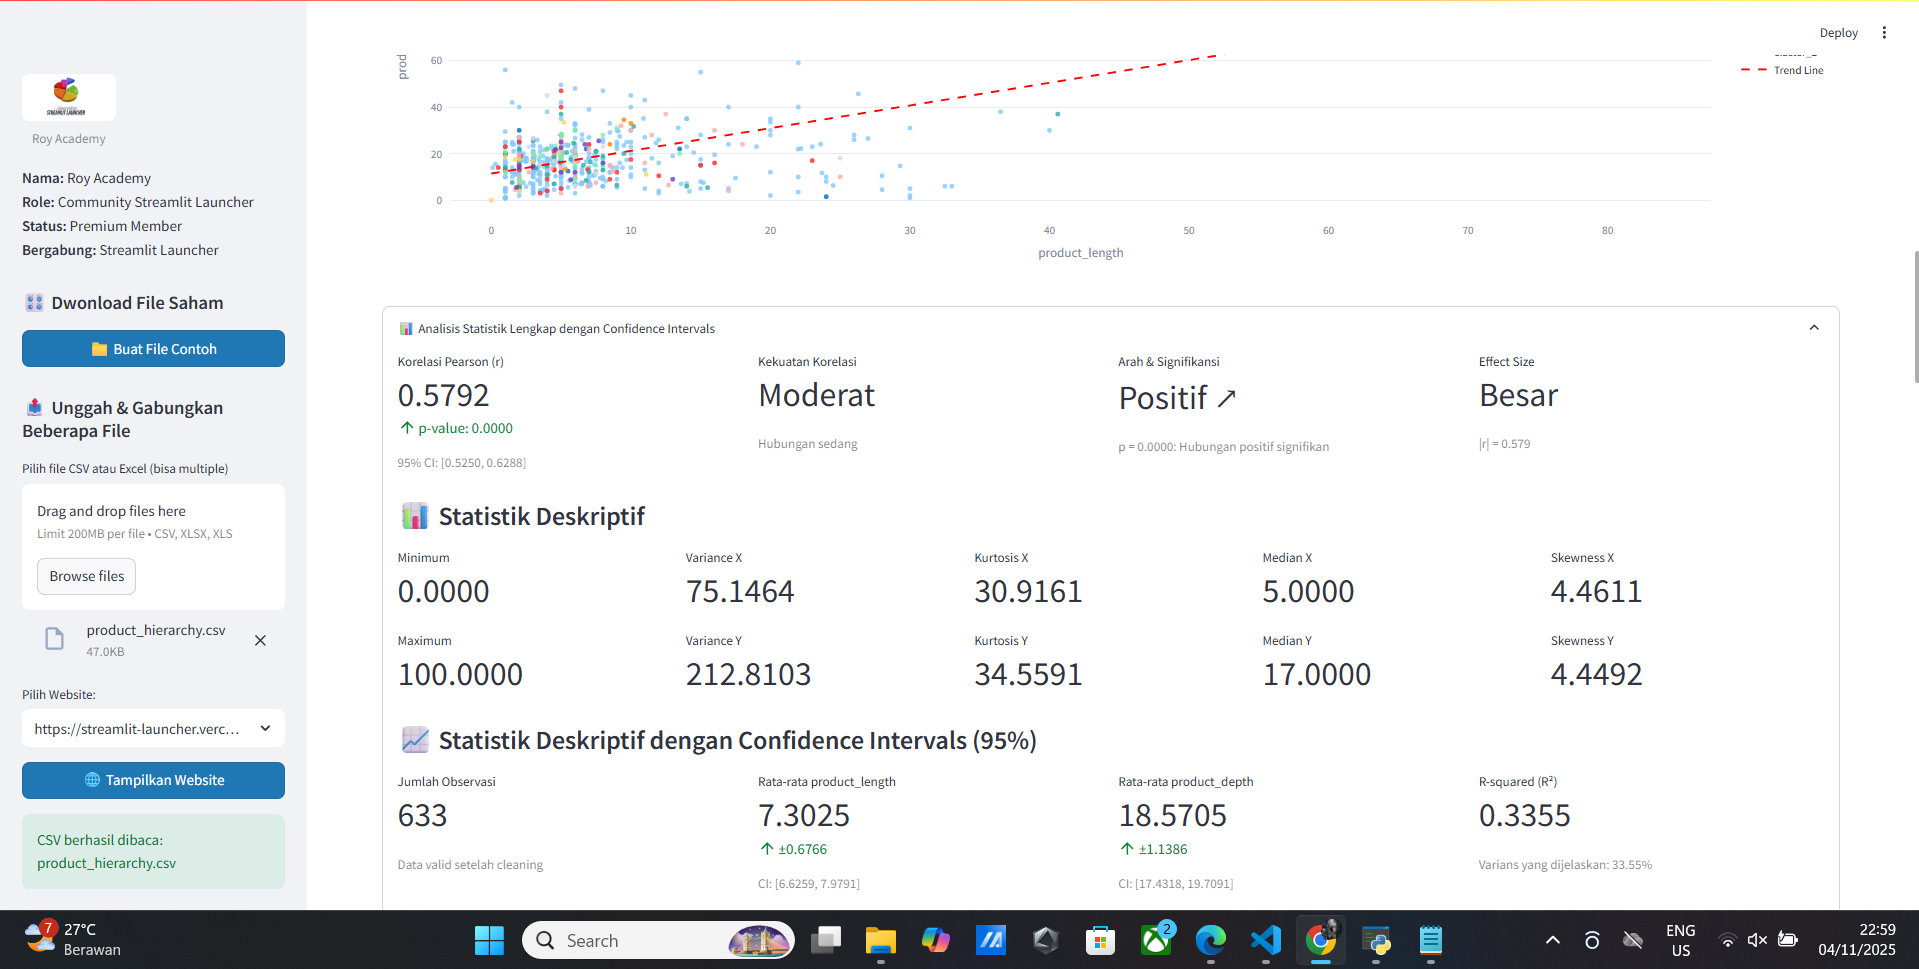
- Korelasi Pearson (r)
- Kekuatan Korelasi
- Arah & Signifikansi
- Effect Size
- Minimum
- Maximum
- Variance X
- Variance Y
- Variance Total
- Variance Population
- Variance Sample
- Variance
- Standard Deviation X
- Standard Deviation Y
- Standard Deviation Total
- Standard Deviation Population
- Standard Deviation Sample
- Standard Deviation
- Mean X
- Mean Y
- Mean Total
- Mean Population
- Mean Sample
- Mean
- Median X
- Median Y
- Median Total
- Median Population
- Median Sample
- Median
- Mode X
- Mode Y
- Mode Total
- Mode Population
- Mode Sample
- Mode
- Interquartile Range X
- Interquartile Range Y
- Interquartile Range Total
- Interquartile Range Population
- Interquartile Range Sample
- Interquartile Range
- Range X
- Range Y
- Confidence Interval
- Implikasi Praktis
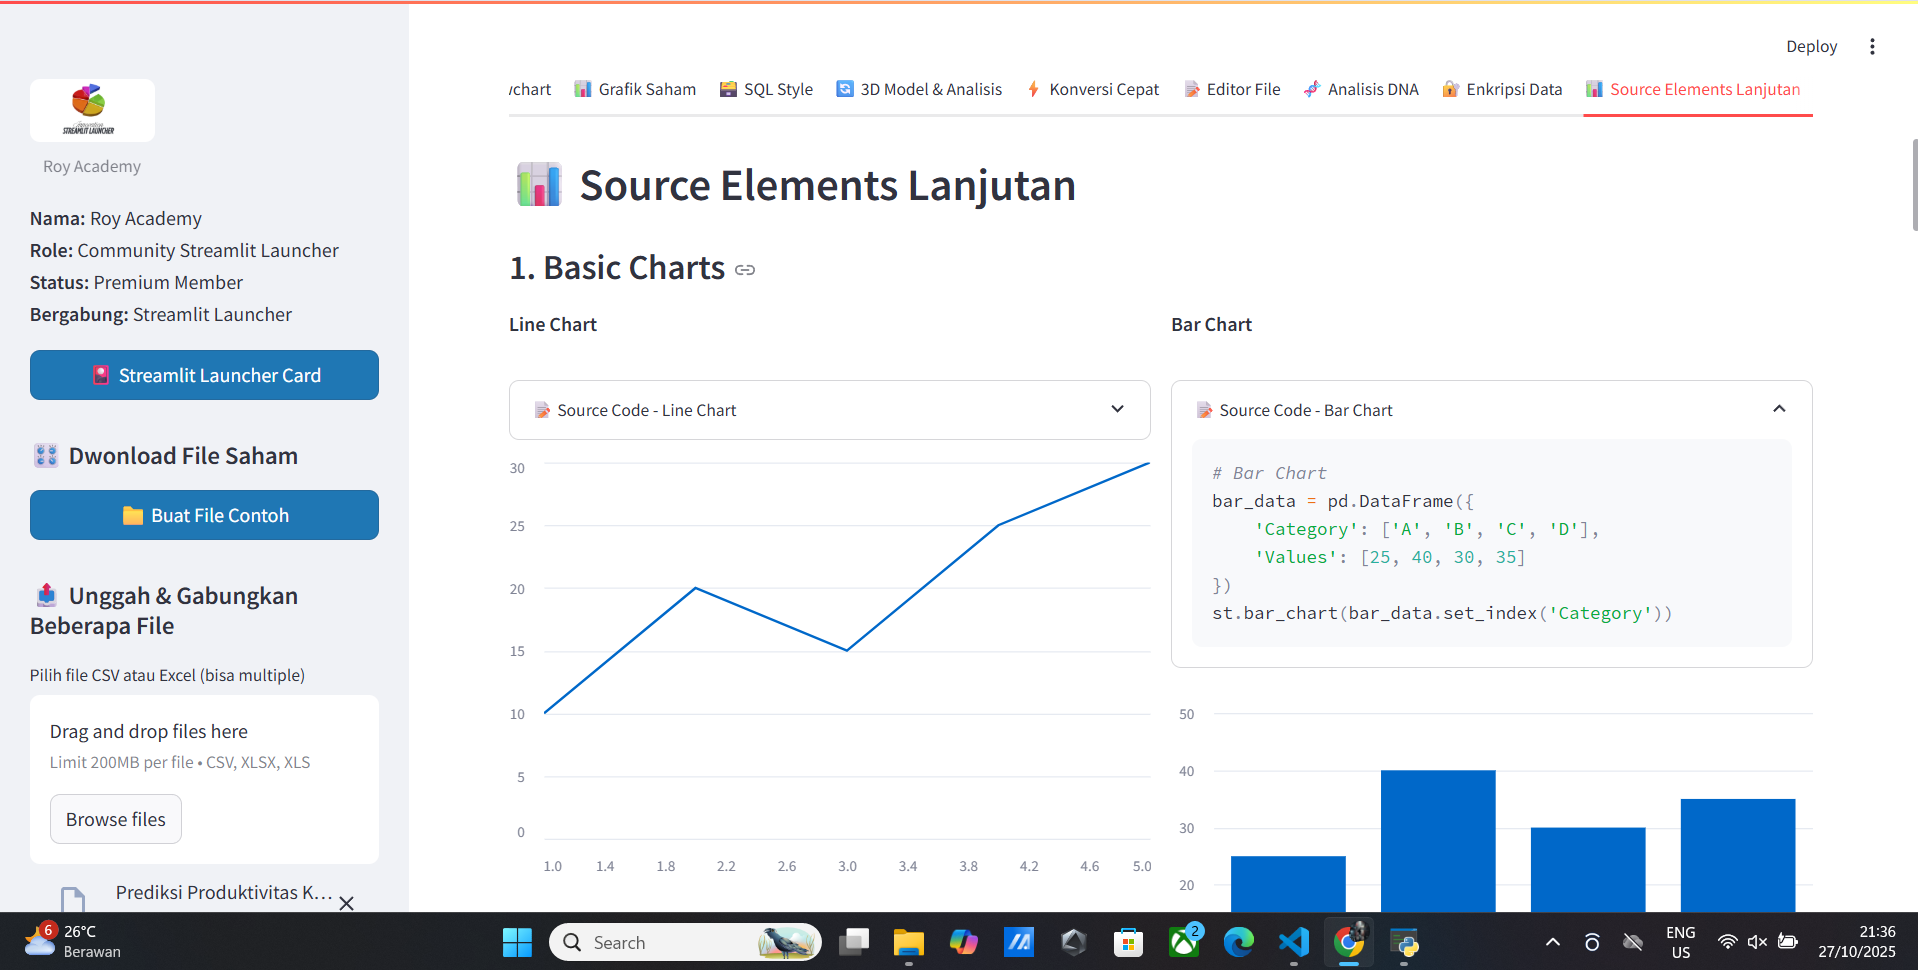
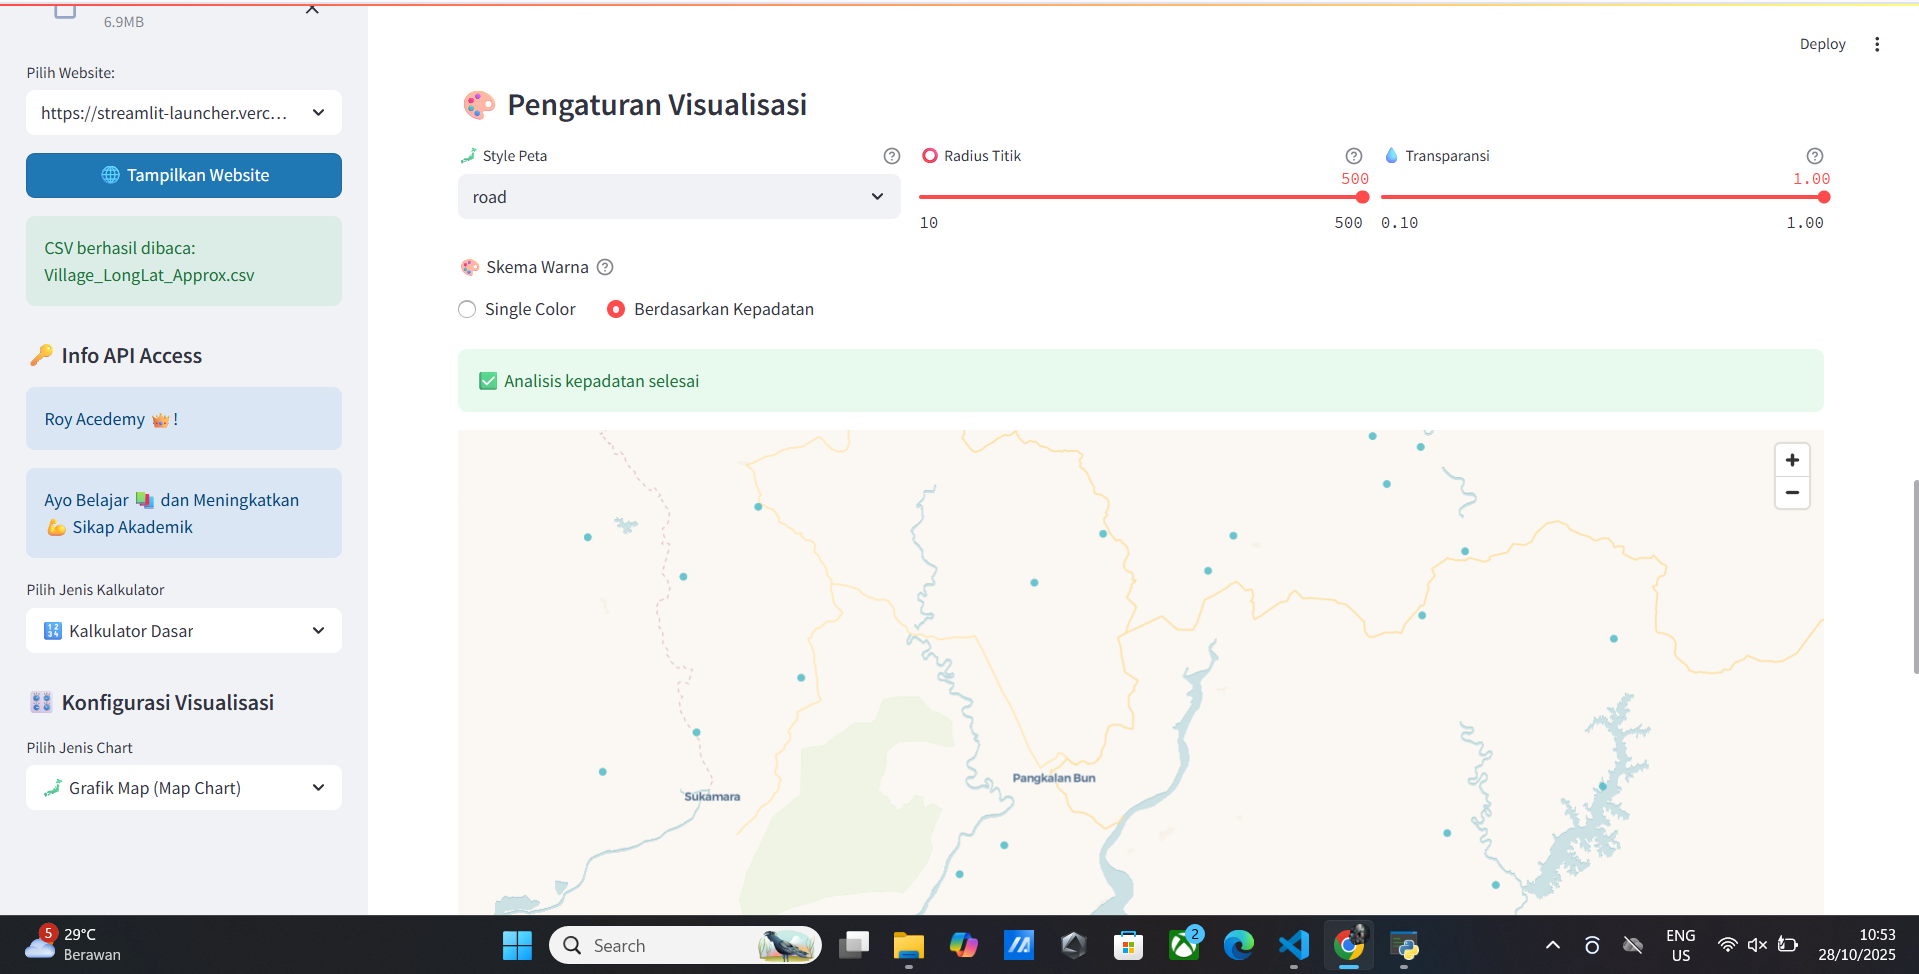
Vitur Update Chart Visualisasi
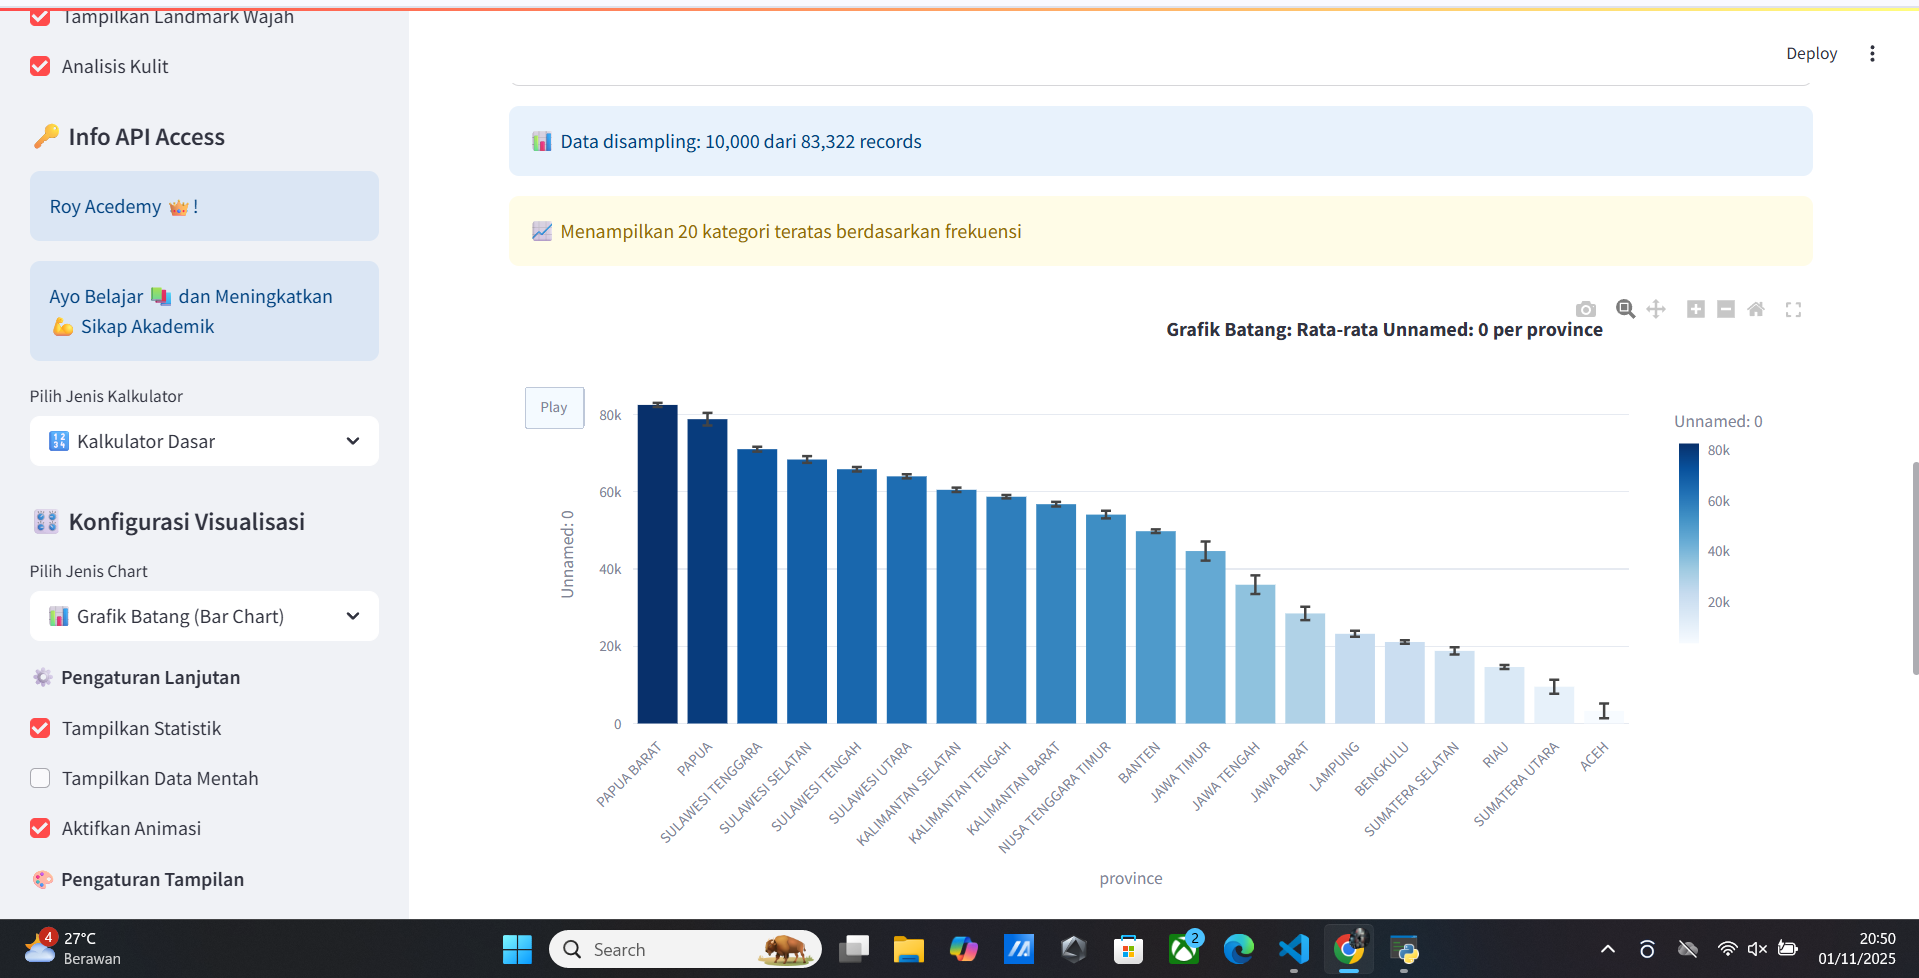
- 📊 Chart Utama
- 📈 Analisis Chart Csv/xlsx
- 📈 Statistik
- 📈 Visualisasi
- 📈 Pengaturan Konfigurasi
- 📈 Menggunakan Plugin
- 📈 Menggunakan Data Mentah
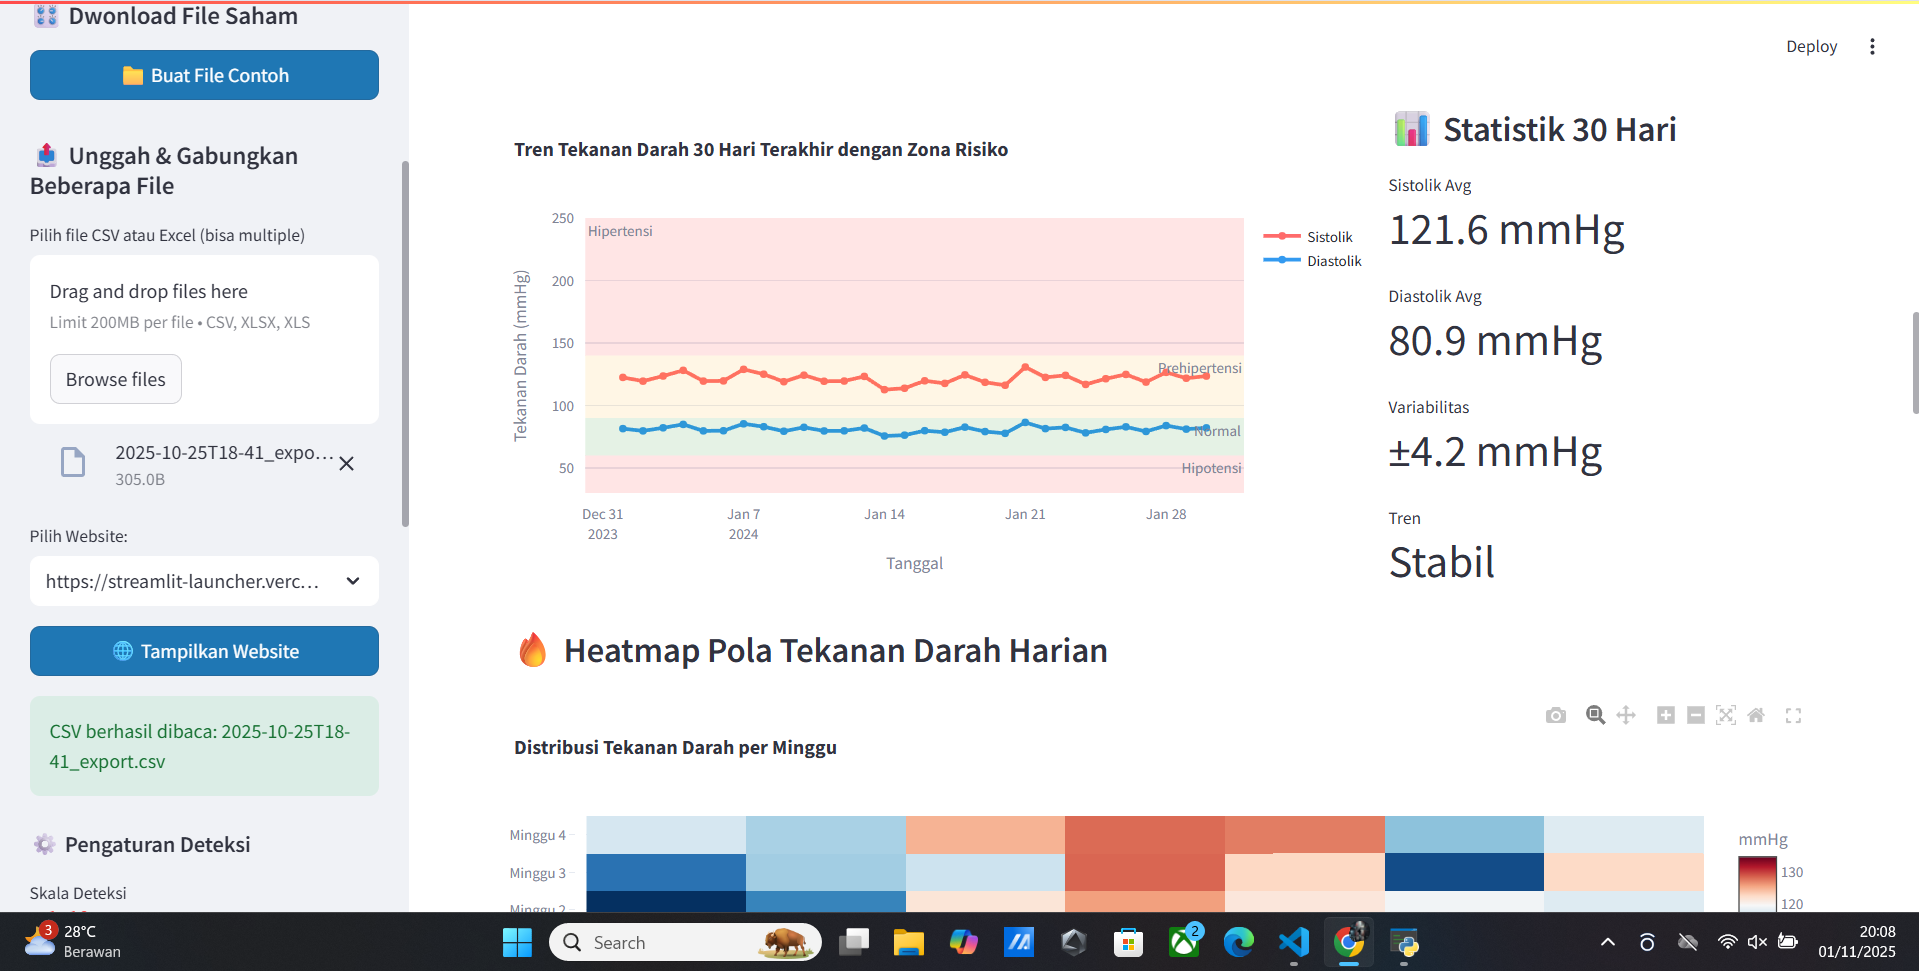
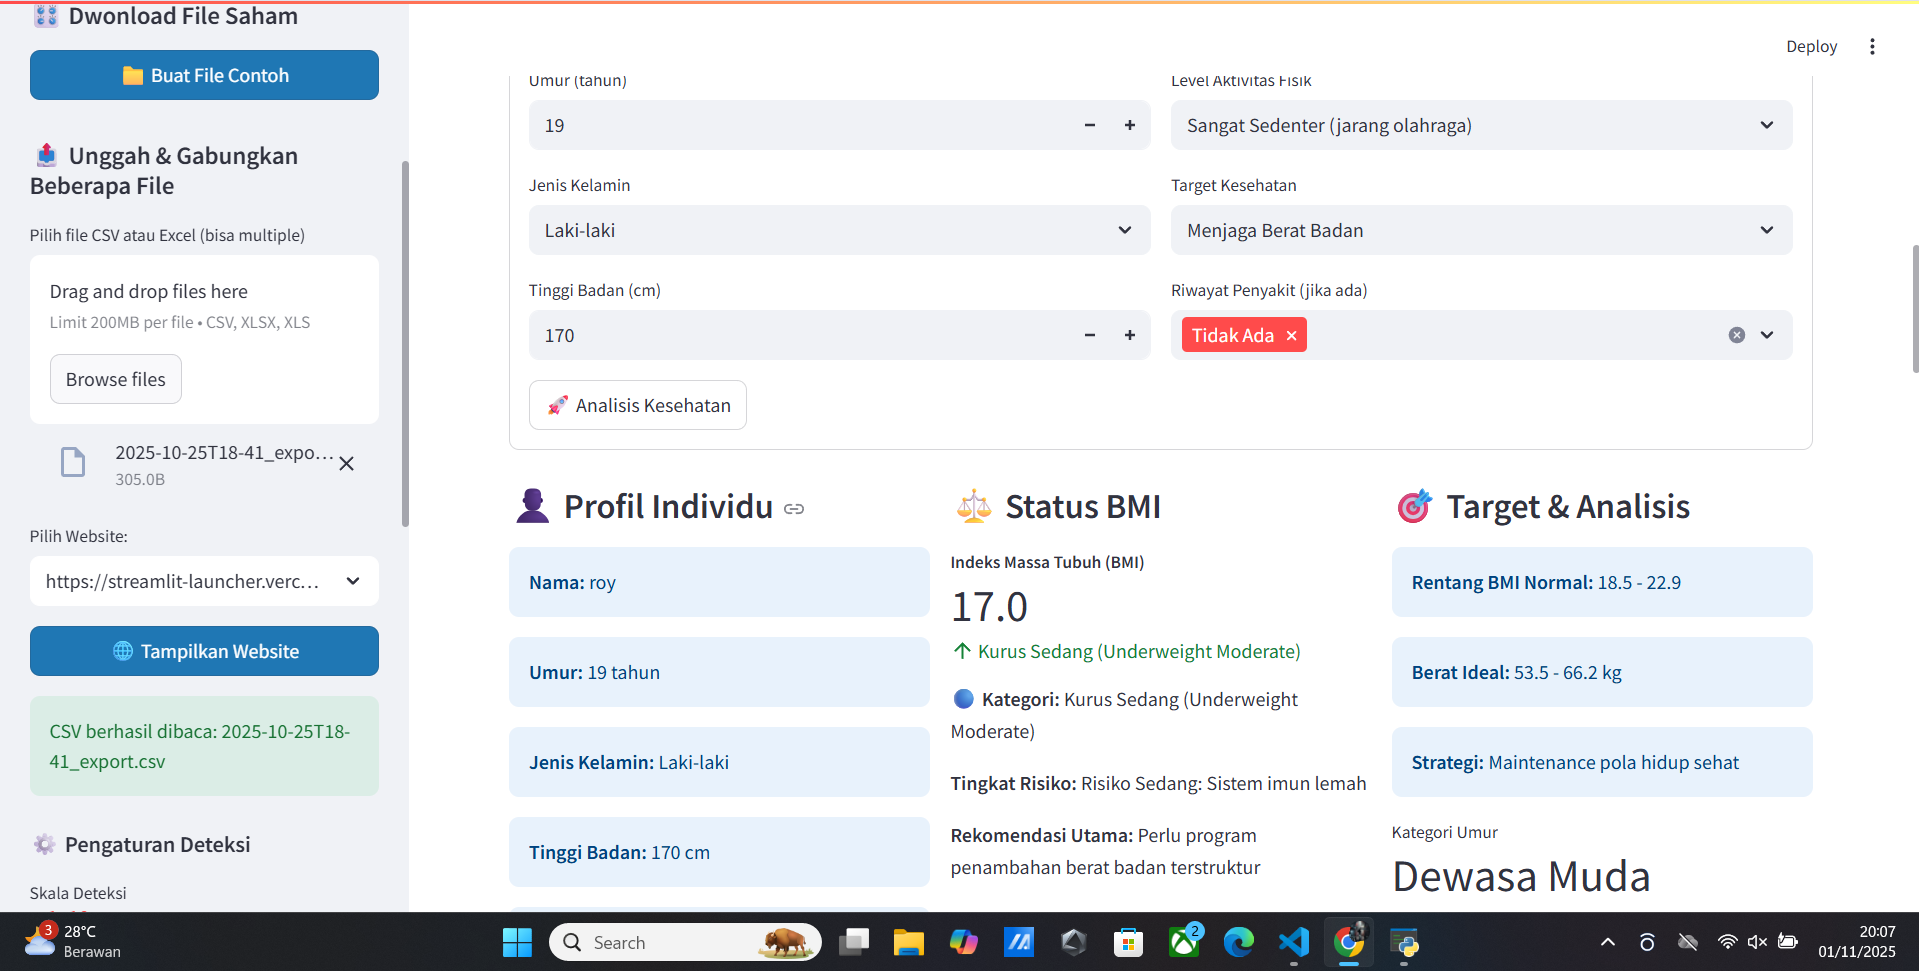
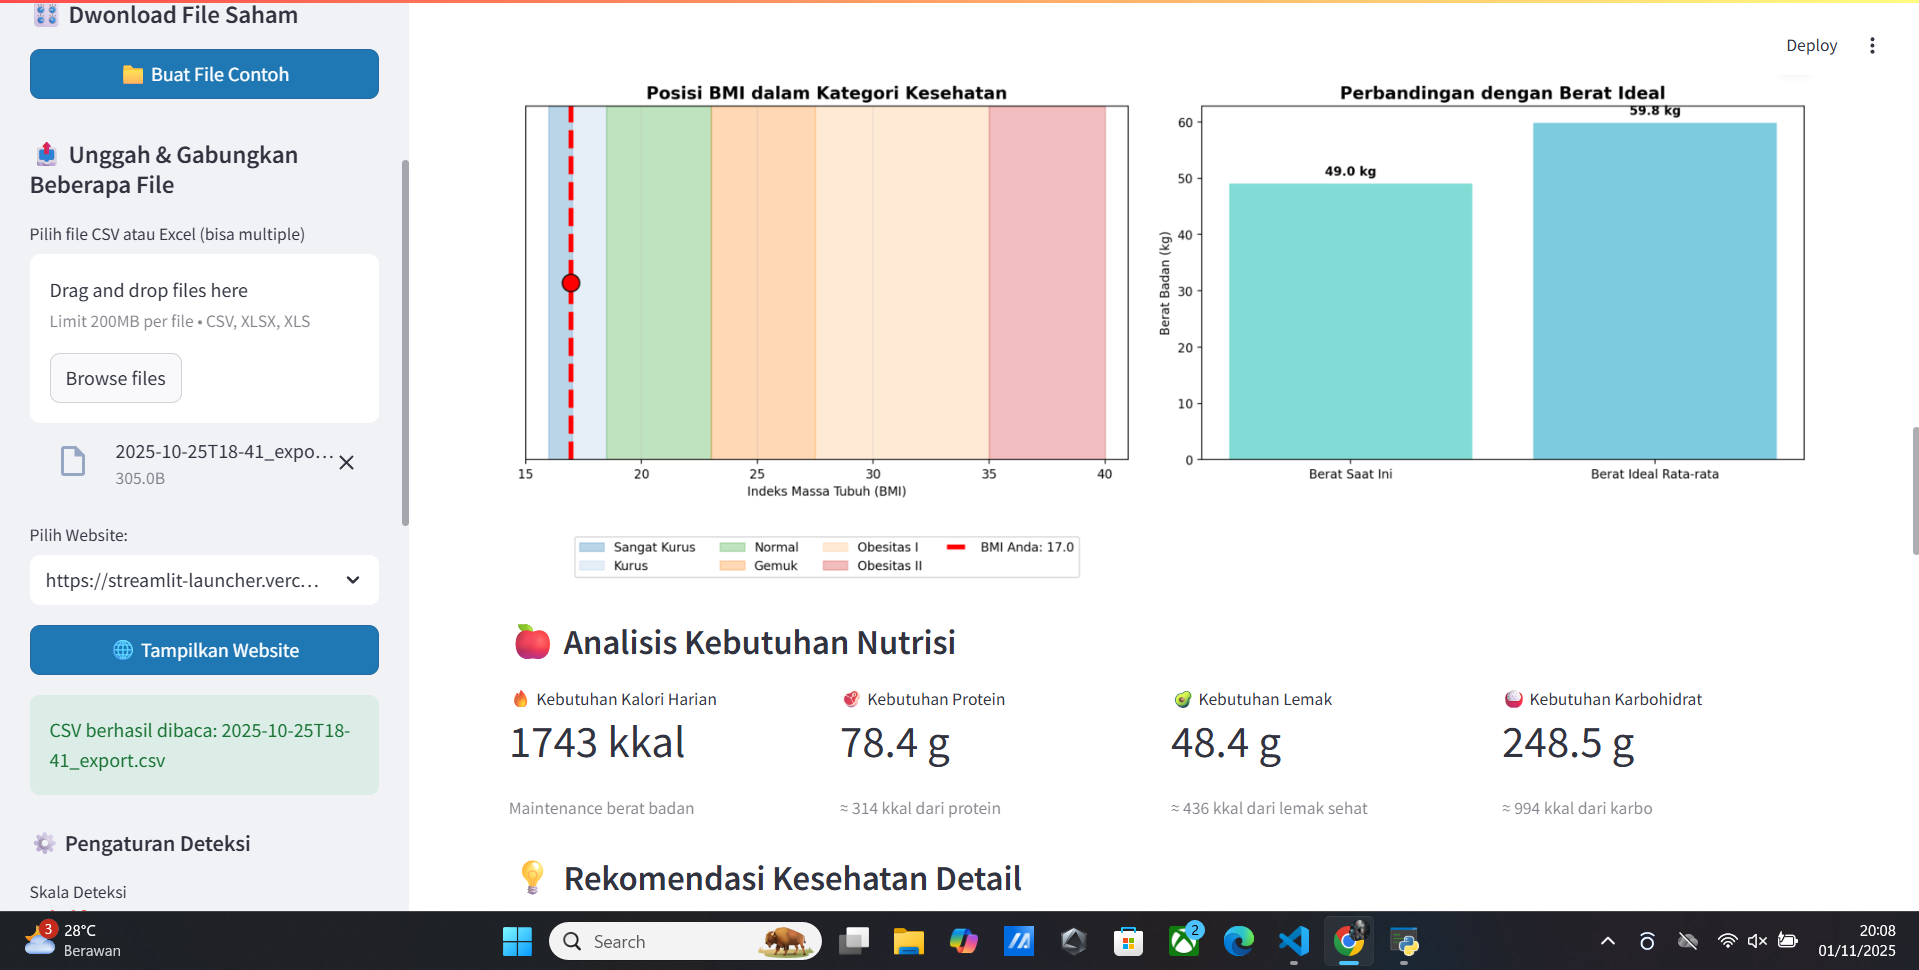
Welcome Vitur Update Doctor Analisis Healty Human
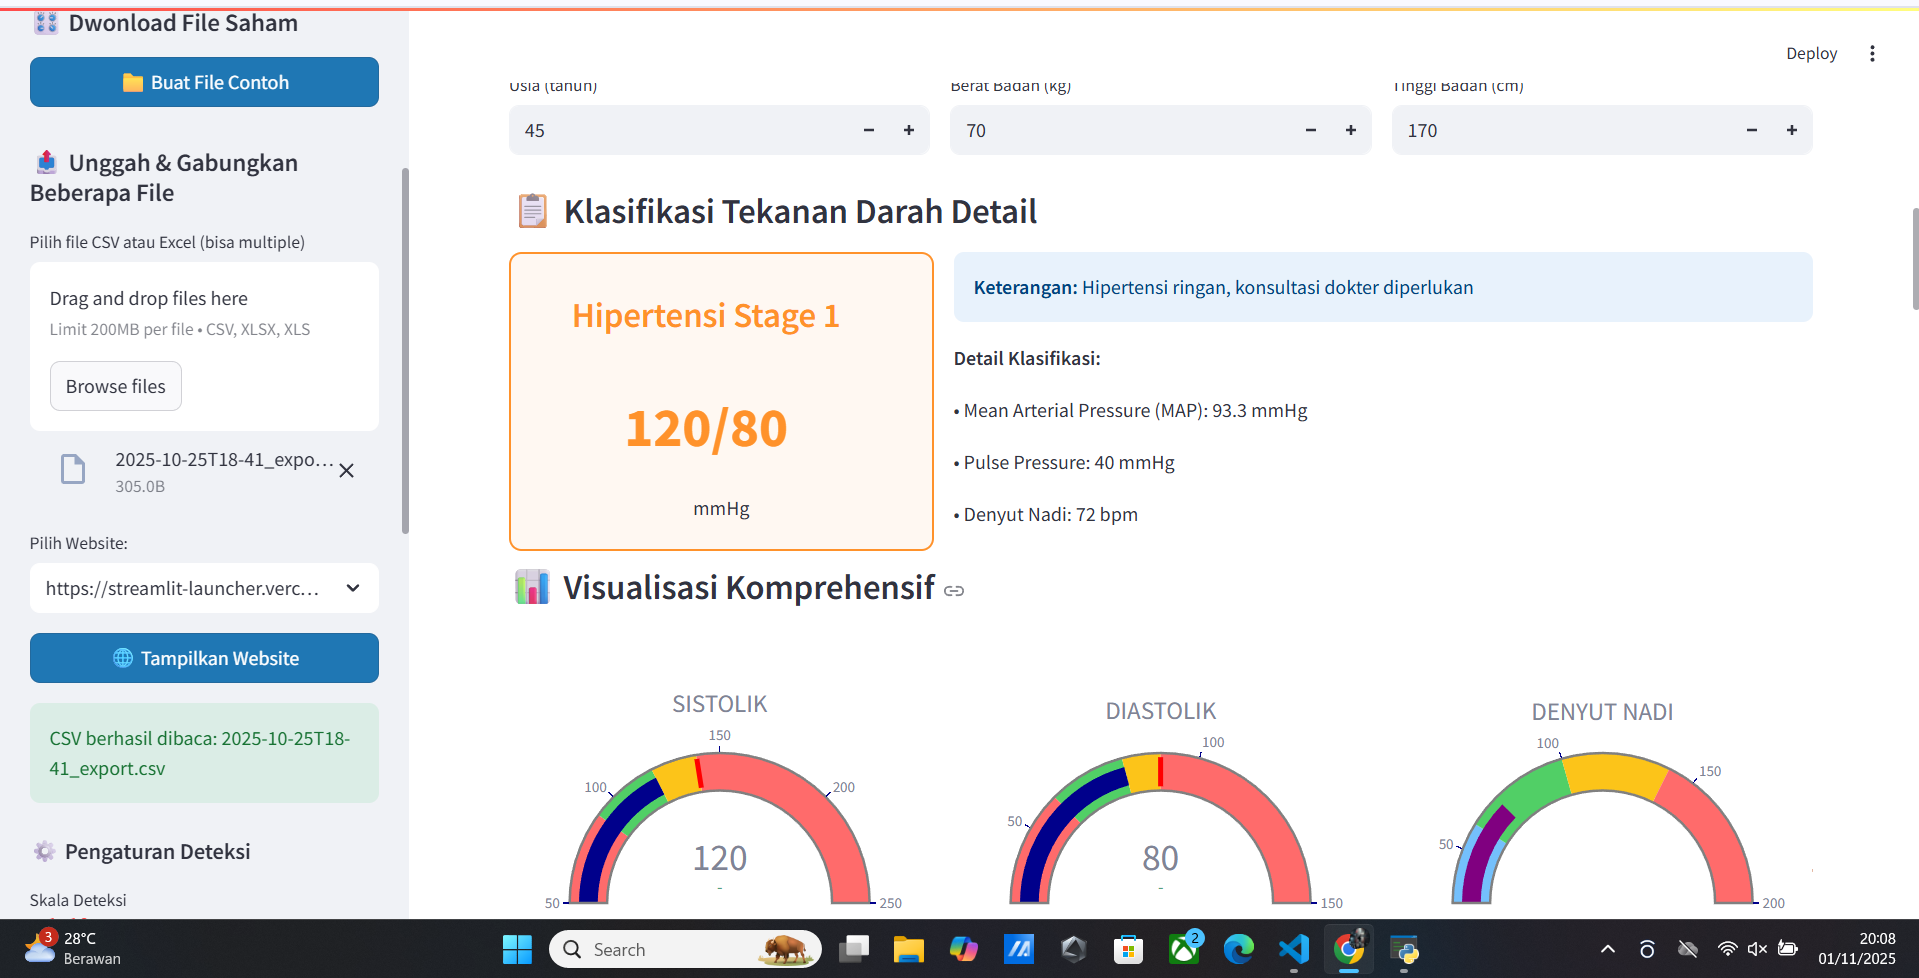
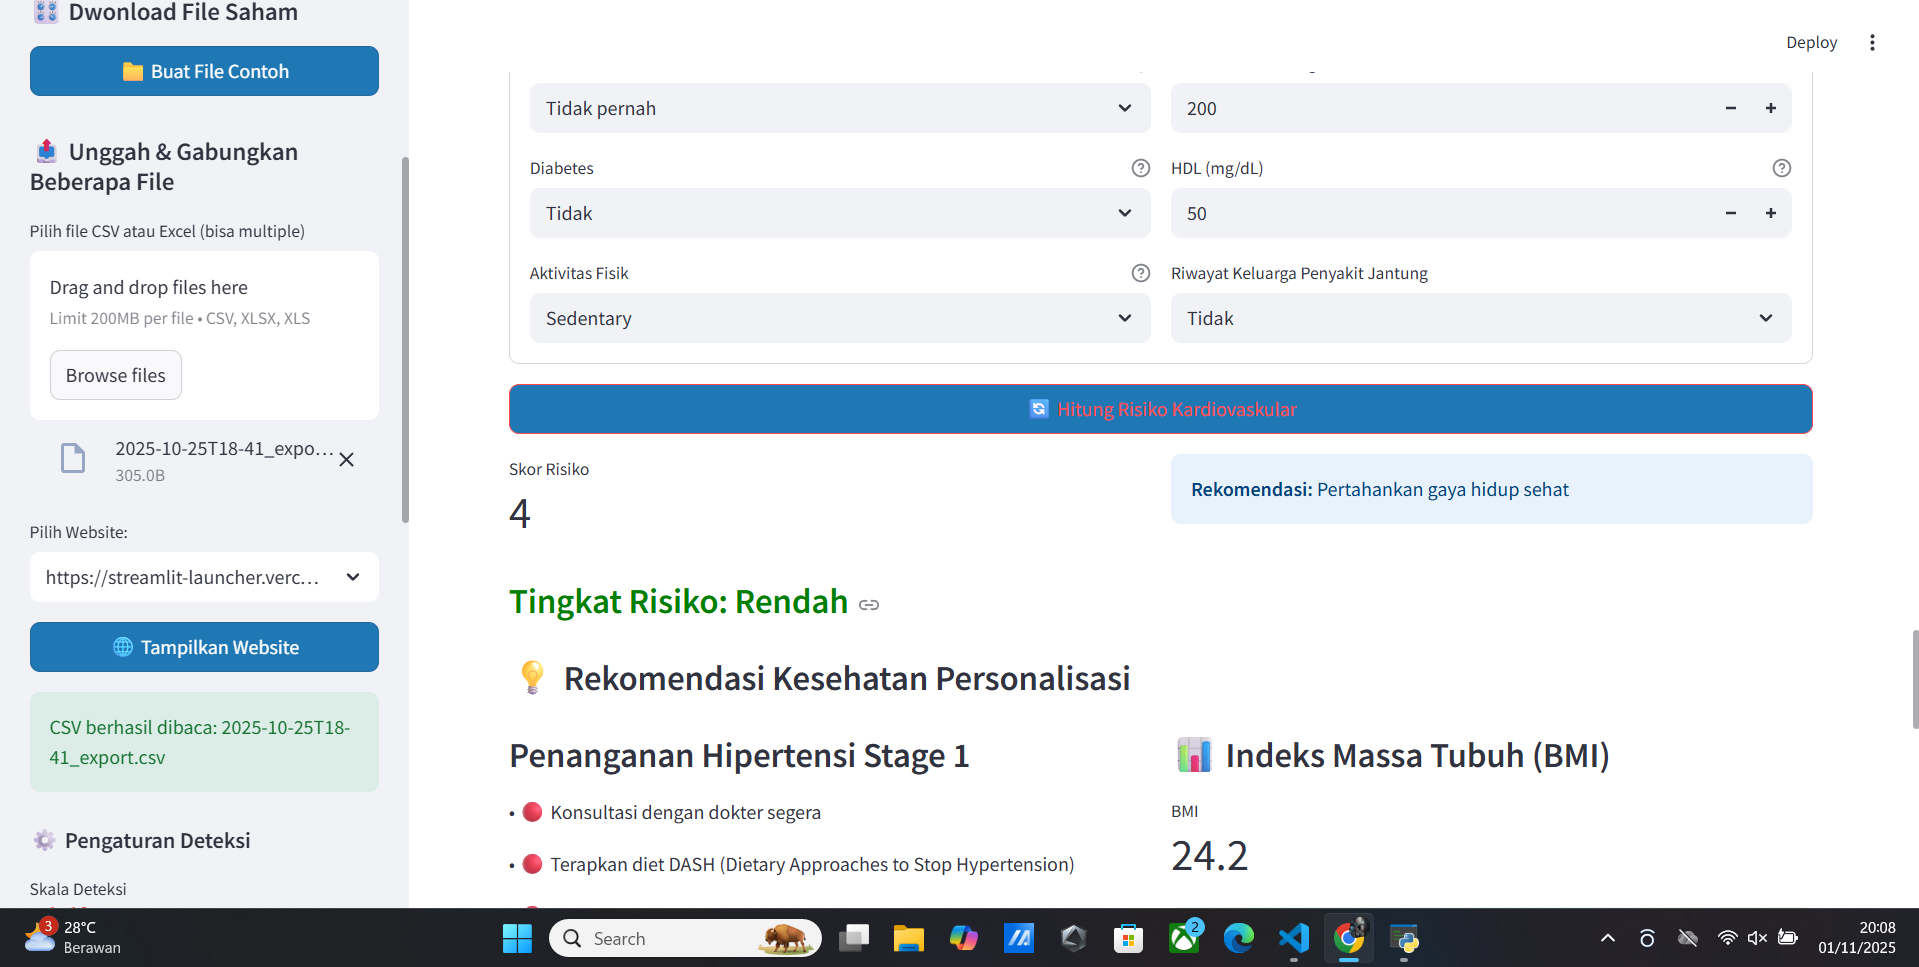
- Low Blood Pressure
- High Blood Pressure
- Blood Health
- Blood Pressure
- Weight
- Diet
- Health Pattern
- Regularity
- Age
- Target Weight
- etc.
Vitur Analisis Face
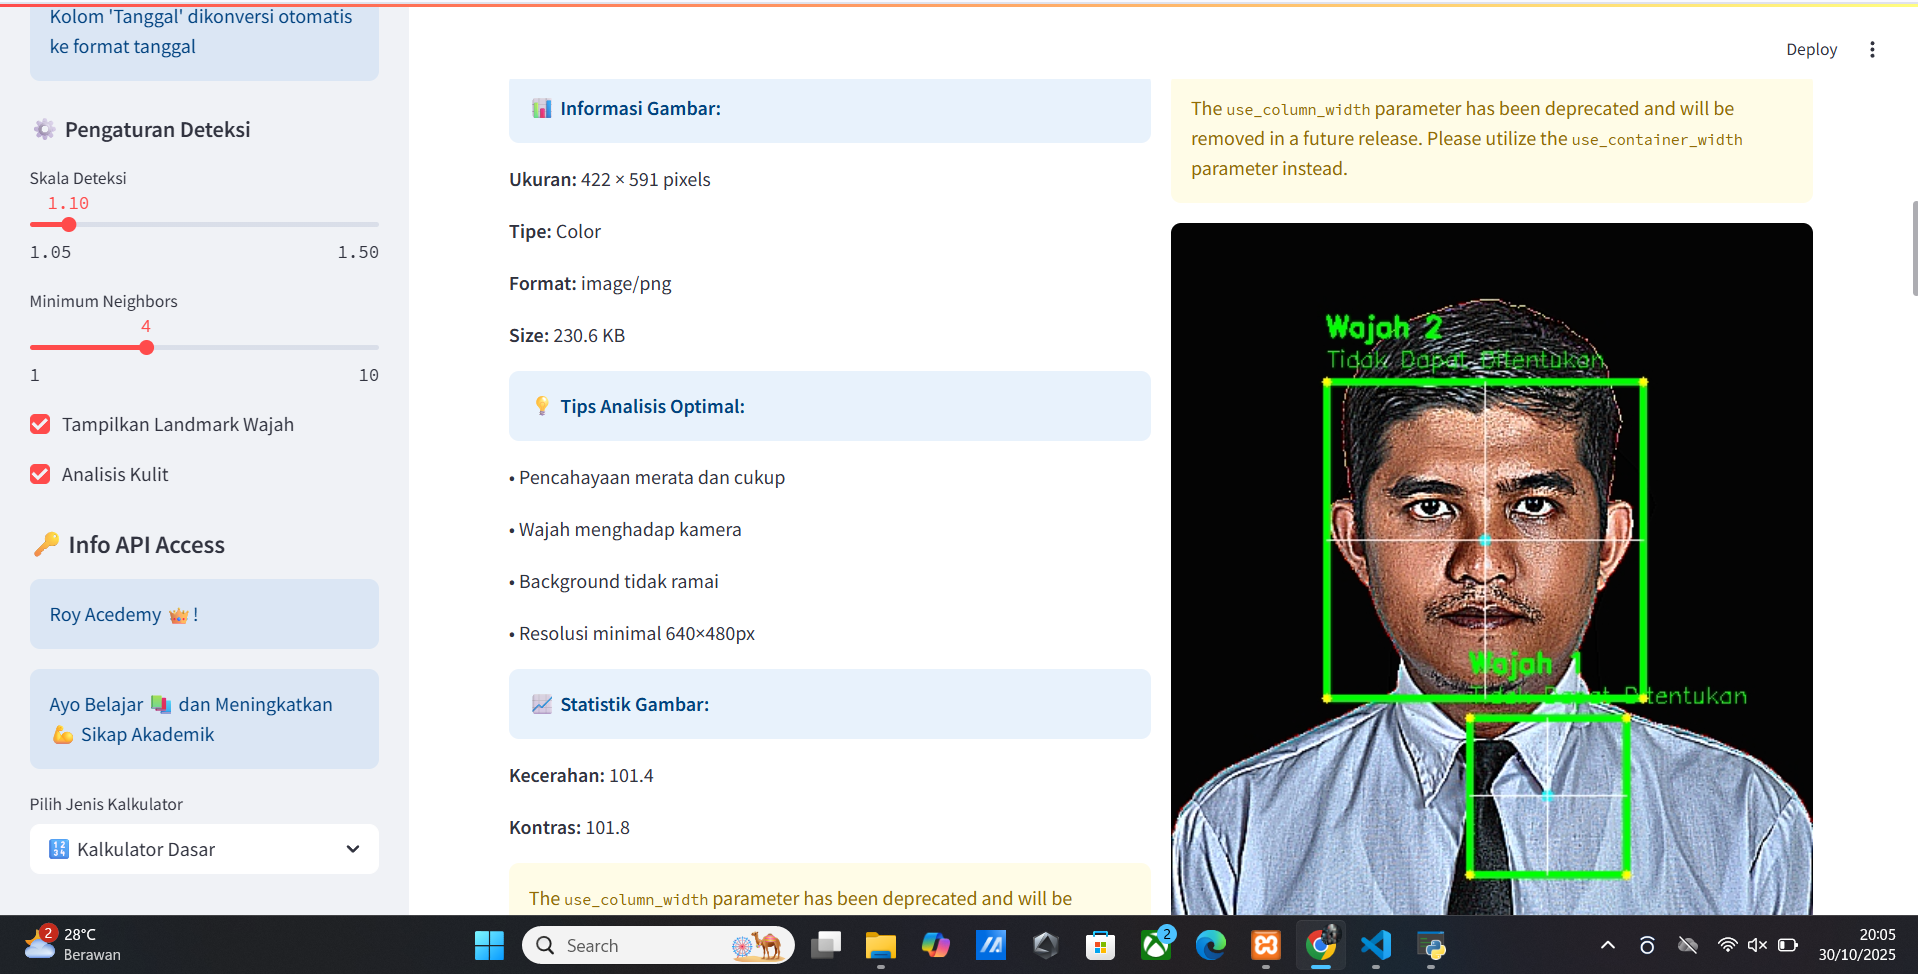
- Analisis Face
- Statistik
- Visualisasi
- Mark Face
- Face Detection
- Face Recognition
- Face Verification
- Face Quality
- Face Clustering
- Face Similarity
📊 Analisis DNA
Fitur analisis DNA yang tersedia:
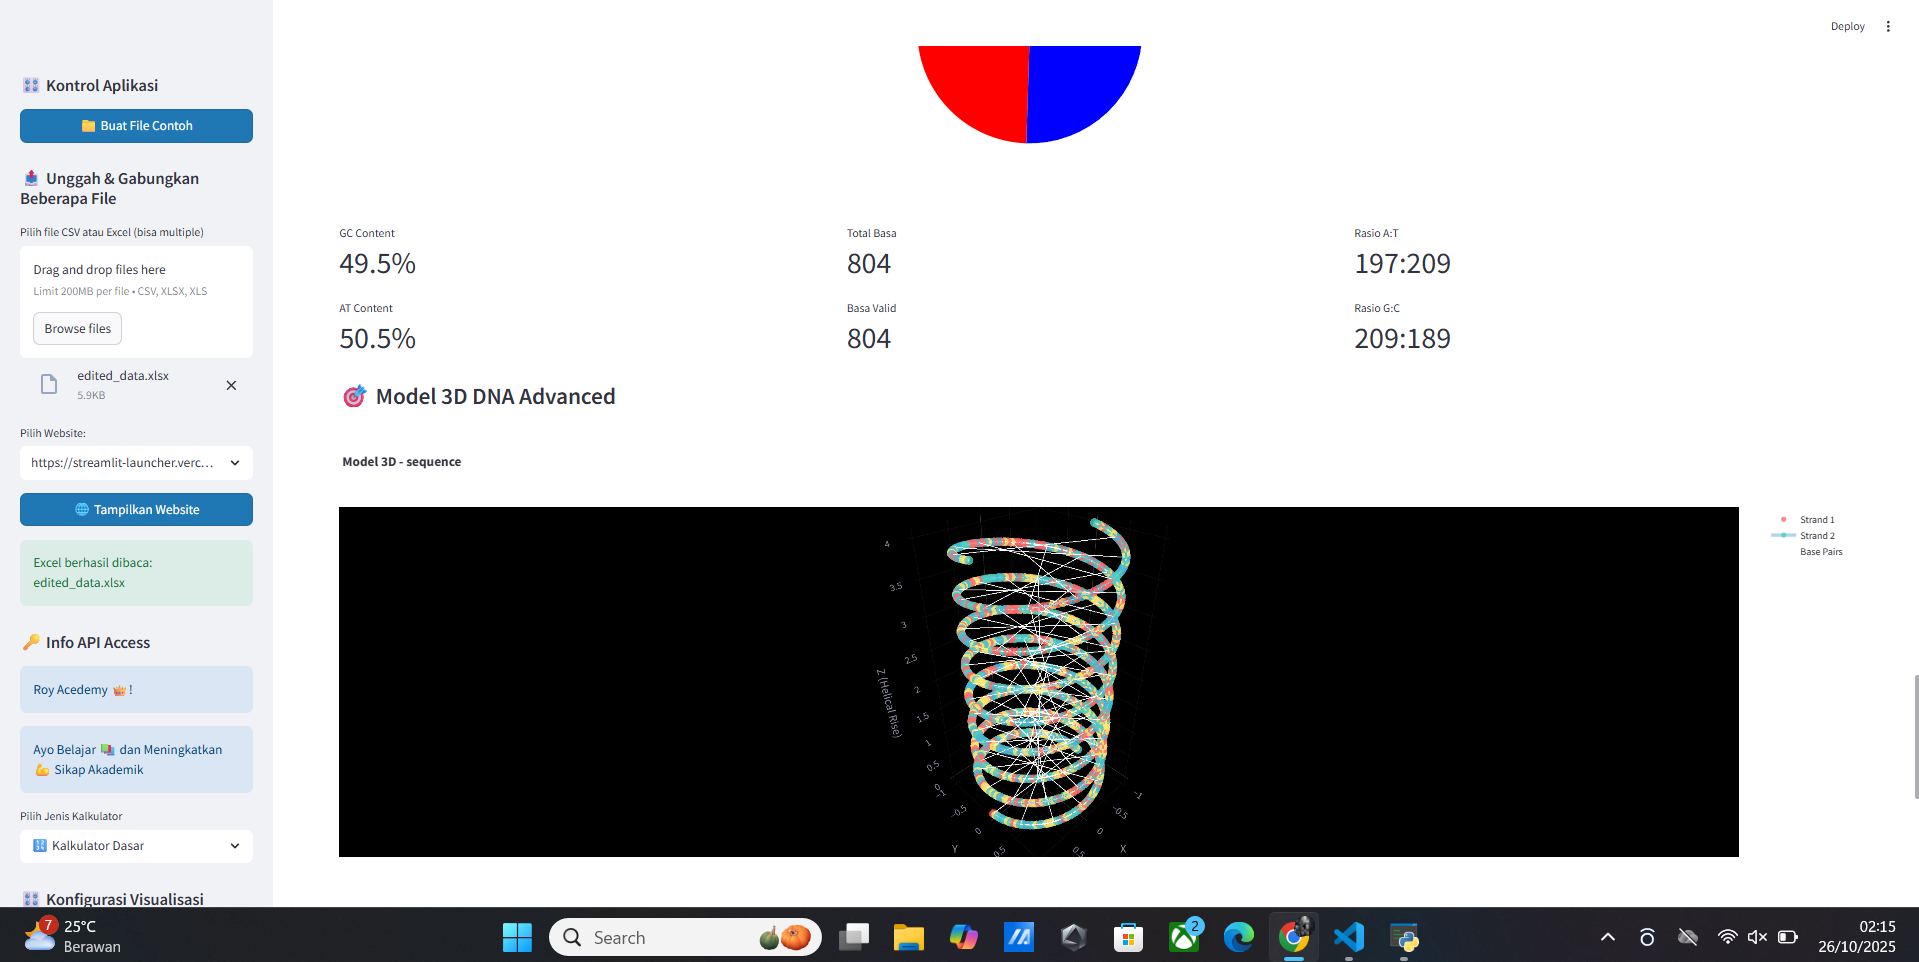
- 📊 Komposisi Basa
- 🔍 Motif & Pattern
- 🧮 Biophysical Properties
- 📈 Sequence Features
- 🧪 Aplikasi Penelitian
📚 Vitur Keamanan CSV Data
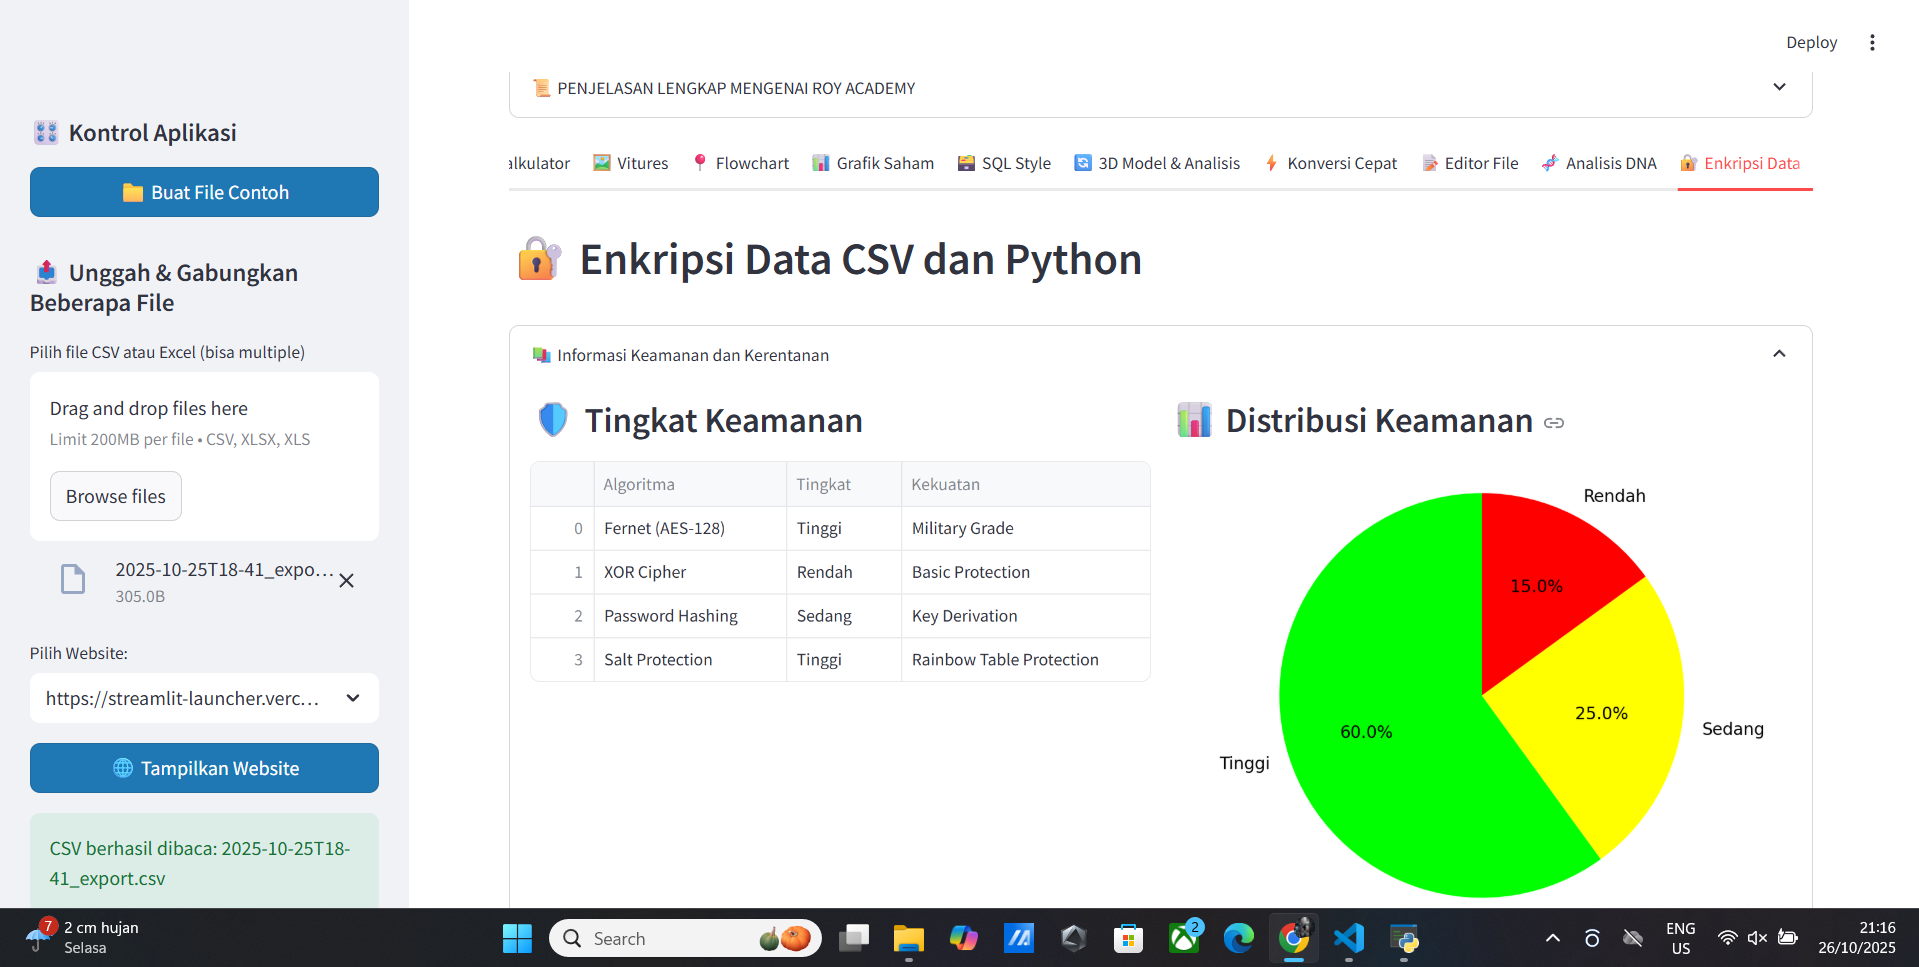
- Encrypsi Data
- Denkripsi Data
- Sistem Keamanan Data
- Keamanan Data
- Data Terenkripsi
- Python dan Data Encryption
- Text dan Encryption
📚 Vitur Profile And Analytics Source Code
- Source Code
- Member Premium
- AI Unlimited Free
- Realtime Data
- Data Visualization
- Data Analysis
- Data Export
- Data Import
- Data Encryption
- Data Security
- Data Privacy
- Data Anonymization
- Data Anomaly Detection
- Data Clustering
- Data Dimensionality Reduction
- Data Feature Selection
- Data Feature Engineering
- Data Feature Extraction
- Data Feature Selection
- Data Feature Selection
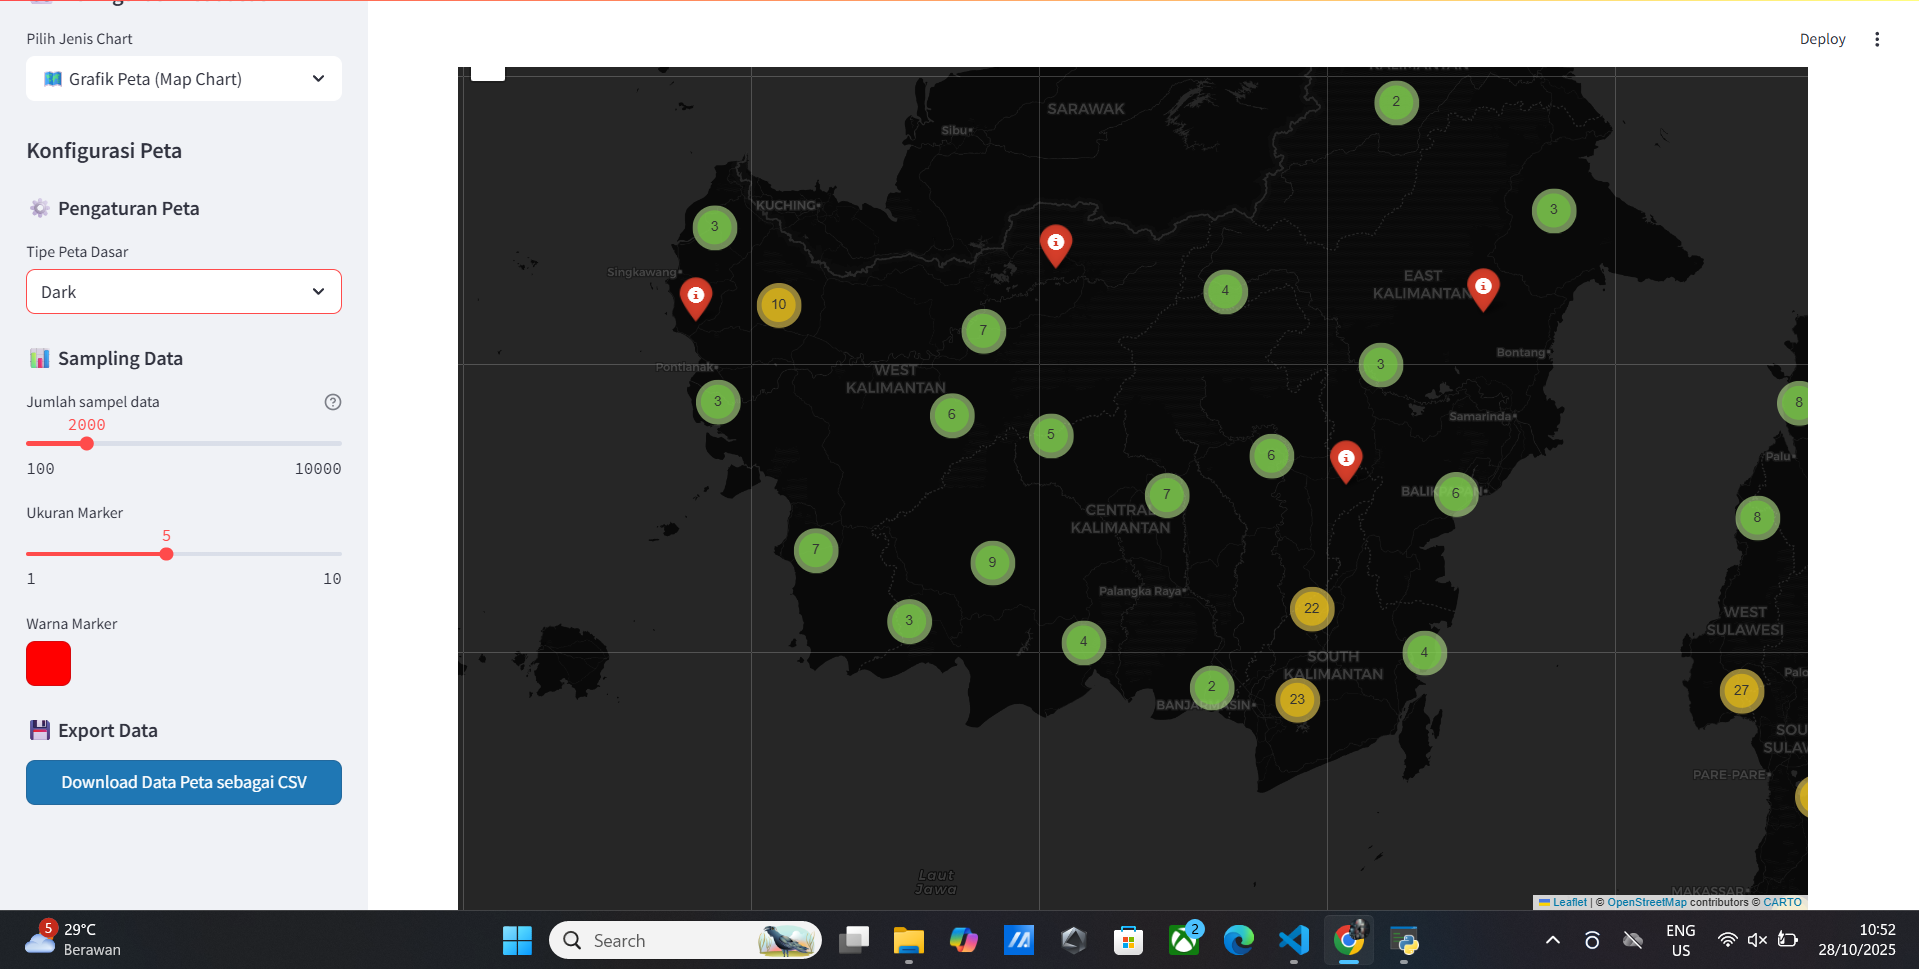
Vitur Map Data
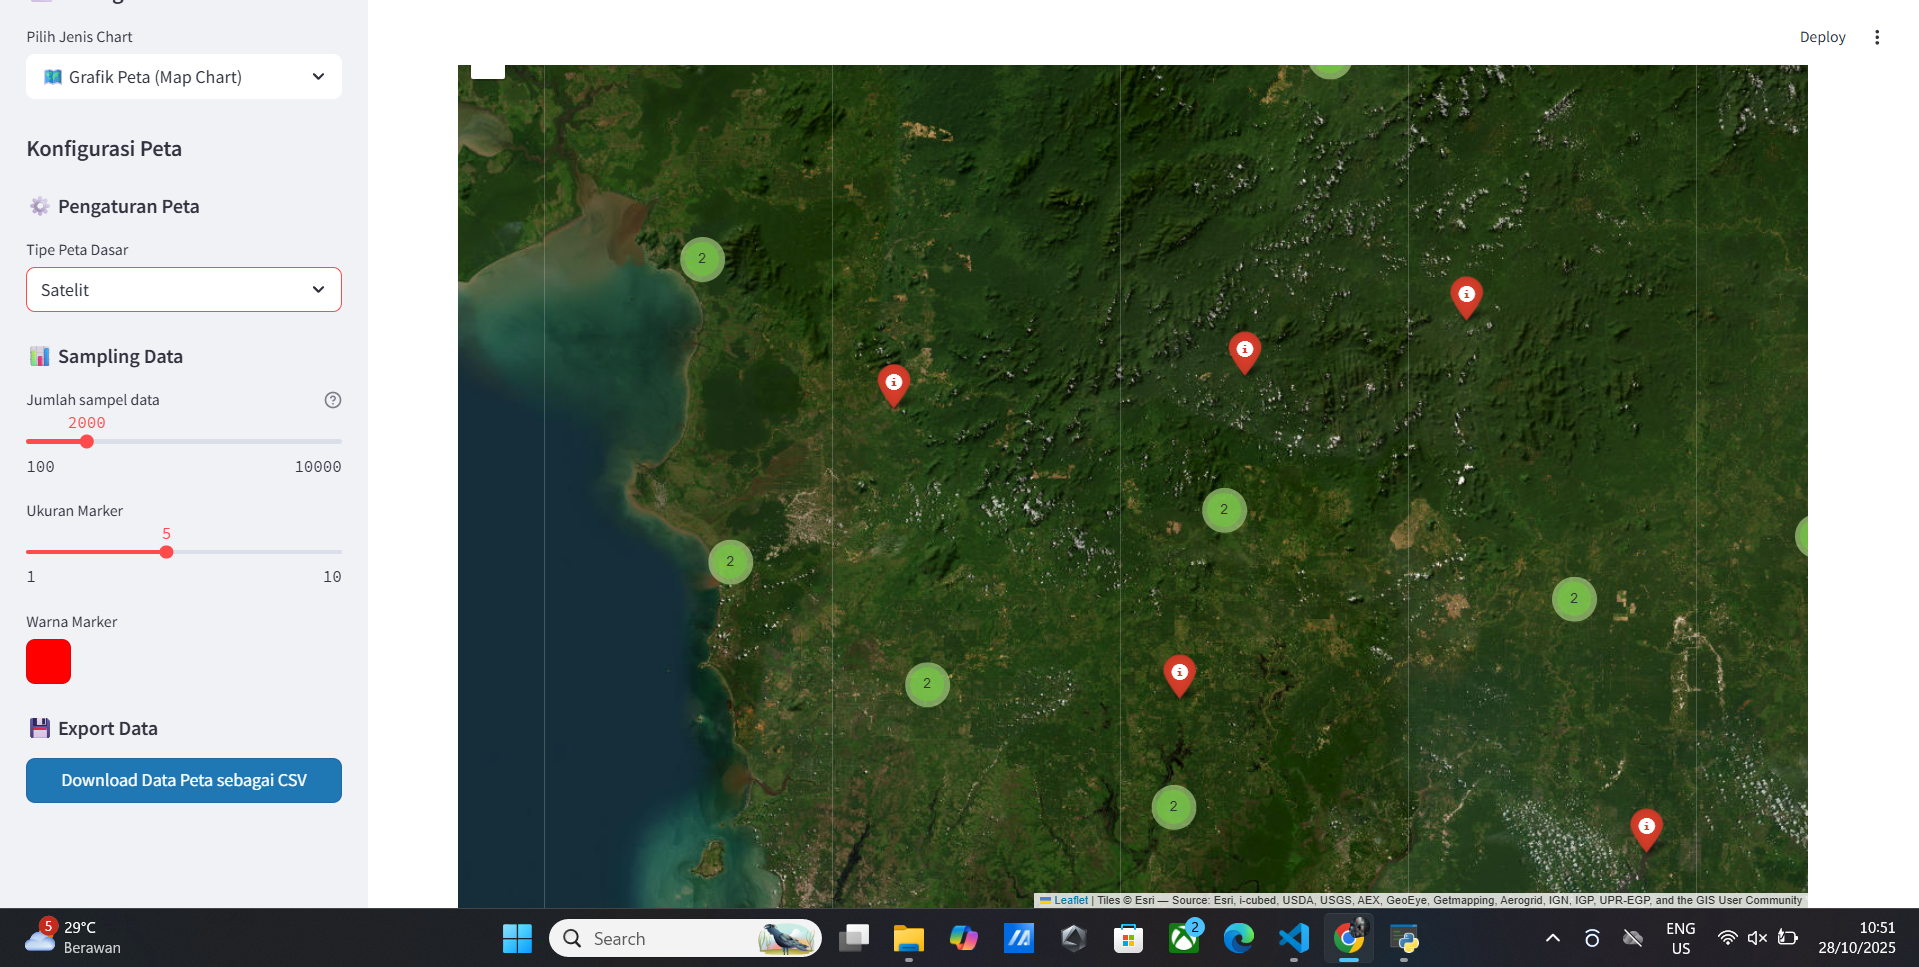
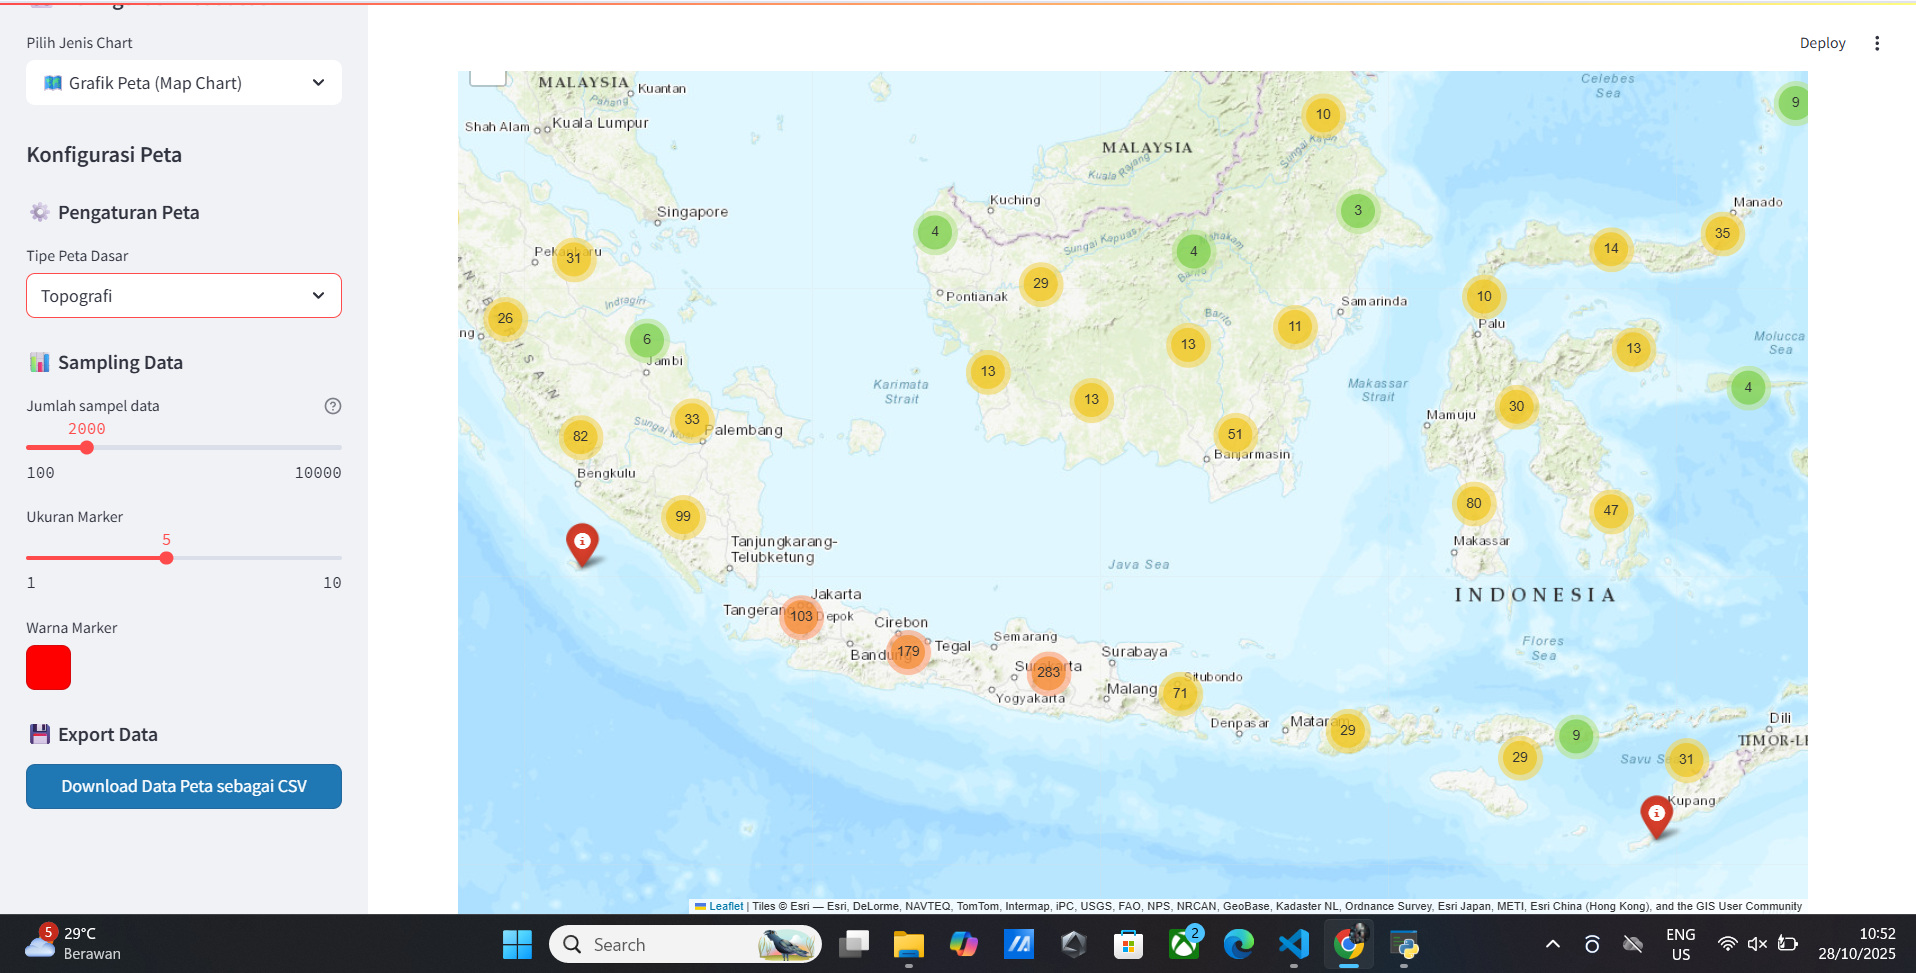
- Peta Interaktif
- Data Points pada Peta
- Tampilkan semua kolom
- Tampilkan kolom lat, lon
- Tampilkan kolom lat, lon, nama
- Peta Internasional
- Peta Global
- Peta Glob
- Information Map
- Analisis Map
- Statistik Map
- Visualisasi Map
- Visualisasi Map dengan Marker
- Visualisasi Map dengan Marker dengan Cluster
- Visualisasi Map dengan Marker dengan Cluster dengan Tooltip
- Peta Satelit
- Peta Typograpy
- Peta Dark
🚀 Installation
Prerequisites System:
- Python 3.7 atau lebih tinggi
- pip (Python package manager) versi terbaru
- Virtual environment (direkomendasikan)
- Git (untuk version control)
Metode Installasi:
1. Installasi Basic (Recommended)
# Install menggunakan pip
pip install streamlit-launcher

# Verifikasi installasi
streamlit-launcher --version
2. Installasi dengan Virtual Environment (Best Practice)
# Buat virtual environment
python -m venv streamlit_env

# Aktifkan virtual environment
# Windows:
streamlit_env\Scripts\activate
# macOS/Linux:
source streamlit_env/bin/activate

# Install package
pip install streamlit-launcher
3. Installasi untuk Development
# Install dengan dependencies development
pip install streamlit-launcher[dev]

# Atau install manual
pip install streamlit-launcher pytest black flake8 mypy
4. Installasi dari Source
# Clone repository
git clone https://github.com/royhtml/streamlit-launcher.git
cd streamlit-launcher

# Install dalam development mode
pip install -e .

# Atau install dengan requirements
pip install -r requirements.txt
5. Installasi dengan Options Tambahan
# Install dengan extra features
pip install streamlit-launcher[all]

# Install specific version
pip install streamlit-launcher==1.0.0

# Upgrade ke versi terbaru
pip install --upgrade streamlit-launcher
Verifikasi Installasi:
# Cek versi
streamlit-launcher --version

# Cek help
streamlit-launcher --help

# Test import
python -c "import streamlit_launcher; print('Installation successful!')"
Troubleshooting Installasi:
# Jika ada permission error
pip install --user streamlit-launcher

# Jika ada conflict dependencies
pip install --upgrade --force-reinstall streamlit-launcher

# Clear pip cache
pip cache purge

# Install dengan no-cache
pip install --no-cache-dir streamlit-launcher
💻 Usage
Cara Menjalankan Dasar:
# Jalankan launcher (mode default)
streamlit_launcher

# Atau dengan python module
python -m streamlit_launcher

# Dengan specific port
streamlit_launcher --port 8501

# Dengan host tertentu
streamlit_launcher --host 0.0.0.0
Advanced Usage:
# Jalankan dengan debug mode
streamlit_launcher --debug true

# Specify browser automatically open
streamlit_launcher --browser true

# Dengan konfigurasi custom
streamlit_launcher --config .streamlit/config.toml

# Menjalankan specific app
streamlit_launcher --app my_app.py
Command Line Options Lengkap:
streamlit_launcher --help

# Output:
Usage: streamlit_launcher [OPTIONS]

Options:
  --port INTEGER           Port number to run the app (default: 8501)
  --host TEXT              Host address to bind to (default: localhost)
  --browser BOOLEAN        Auto-open browser (default: true)
  --debug BOOLEAN          Enable debug mode (default: false)
  --log-level TEXT         Log level (debug, info, warning, error)
  --config FILE            Path to config file
  --app FILE               Specific app file to launch
  --theme TEXT             Color theme (light, dark)
  --version                Show version information
  --help                   Show this message and exit
🖼️ Screenshot & Demo
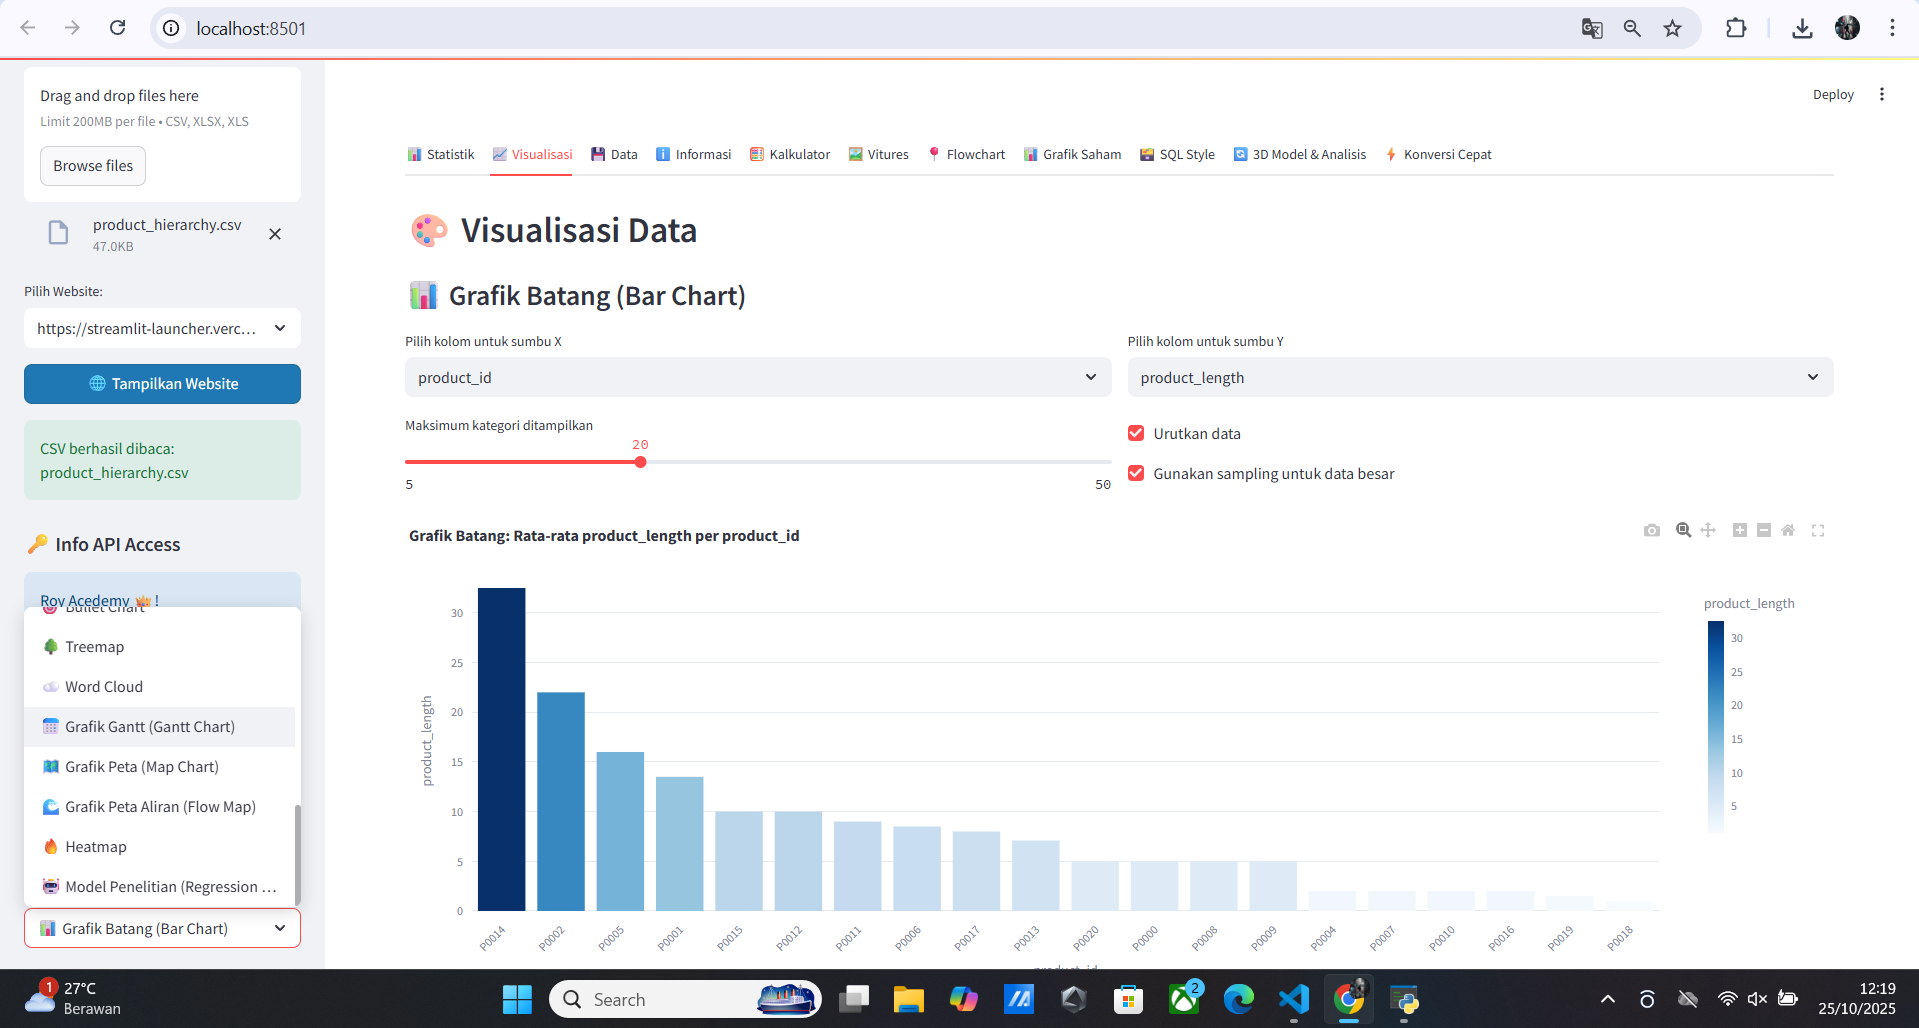
Tampilan GUI Streamlit Launcher yang user-friendly dengan dark mode
Fitur GUI:
- ✅ File Browser - Navigasi file yang intuitif
- ✅ Project Management - Kelola multiple Streamlit apps
- ✅ Real-time Logs - Melihat logs secara real-time
- ✅ Port Management - Manage multiple ports dengan mudah
- ✅ Theme Selection - Light/Dark mode
- ✅ Quick Actions - Shortcut untuk common tasks
🔧 Advanced Configuration
Environment Variables:
# Set di shell atau .env file
export STREAMLIT_SERVER_PORT=8501
export STREAMLIT_SERVER_ADDRESS=0.0.0.0
export STREAMLIT_BROWSER_GATHER_USAGE_STATS=false
export STREAMLIT_THEME_BASE="dark"
export STREAMLIT_LOG_LEVEL="info"
File Konfigurasi (.streamlit/config.toml):
[server]
port = 8501
address = "0.0.0.0"
enableCORS = false
enableXsrfProtection = true
maxUploadSize = 200

[browser]
serverAddress = "localhost"
gatherUsageStats = false
serverPort = 8501

[theme]
base = "dark"
primaryColor = "#ff4b4b"
backgroundColor = "#0e1117"
secondaryBackgroundColor = "#262730"
textColor = "#fafafa"
font = "sans serif"

[logger]
level = "info"

[client]
showErrorDetails = true
Konfigurasi untuk Production:
[server]
headless = true
enableCORS = false
maxUploadSize = 500

[runner]
magicEnabled = false
📊 Contoh Aplikasi Data Science Lengkap
Contoh 1: Comprehensive EDA Dashboard
# app_eda.py
import streamlit as st
import pandas as pd
import numpy as np
import plotly.express as px
import plotly.graph_objects as go
from scipy import stats
import seaborn as sns
import matplotlib.pyplot as plt

# Page configuration
st.set_page_config(
    page_title="EDA Dashboard",
    page_icon="📊",
    layout="wide",
    initial_sidebar_state="expanded"
)

# Custom CSS
st.markdown("""
<style>
    .main-header {
        font-size: 2.5rem;
        color: #1f77b4;
        text-align: center;
        margin-bottom: 2rem;
    }
    .metric-card {
        background-color: #f0f2f6;
        padding: 1rem;
        border-radius: 10px;
        margin: 0.5rem 0;
    }
</style>
""", unsafe_allow_html=True)

@st.cache_data
def load_data(uploaded_file):
    """Load data dengan caching untuk performance"""
    try:
        if uploaded_file.name.endswith('.csv'):
            return pd.read_csv(uploaded_file)
        elif uploaded_file.name.endswith('.xlsx'):
            return pd.read_excel(uploaded_file)
        else:
            st.error("Format file tidak didukung")
            return None
    except Exception as e:
        st.error(f"Error loading file: {e}")
        return None

def show_data_overview(df):
    """Menampilkan overview data"""
    st.header("📈 Data Overview")

    col1, col2, col3, col4 = st.columns(4)

    with col1:
        st.metric("Total Rows", df.shape[0])
    with col2:
        st.metric("Total Columns", df.shape[1])
    with col3:
        st.metric("Missing Values", df.isnull().sum().sum())
    with col4:
        st.metric("Memory Usage", f"{df.memory_usage(deep=True).sum() / 1024**2:.2f} MB")

    # Data preview
    st.subheader("Data Preview")
    st.dataframe(df, use_container_width=True)

    # Data types
    st.subheader("Data Types")
    dtype_df = pd.DataFrame(df.dtypes, columns=['Data Type'])
    st.dataframe(dtype_df)

def show_missing_analysis(df):
    """Analisis missing values"""
    st.header("🔍 Missing Values Analysis")

    missing_data = df.isnull().sum()
    missing_percent = (missing_data / len(df)) * 100

    missing_df = pd.DataFrame({
        'Column': missing_data.index,
        'Missing Count': missing_data.values,
        'Missing Percentage': missing_percent.values
    }).sort_values('Missing Count', ascending=False)

    # Filter hanya yang ada missing values
    missing_df = missing_df[missing_df['Missing Count'] > 0]

    if len(missing_df) > 0:
        st.dataframe(missing_df, use_container_width=True)

        # Visualisasi missing values
        fig = px.bar(missing_df, x='Column', y='Missing Percentage',
                     title='Missing Values Percentage by Column')
        st.plotly_chart(fig, use_container_width=True)
    else:
        st.success("🎉 Tidak ada missing values dalam dataset!")

def show_statistical_analysis(df):
    """Analisis statistik"""
    st.header("📊 Statistical Analysis")

    # Pilih kolom numerik
    numeric_cols = df.select_dtypes(include=[np.number]).columns.tolist()

    if numeric_cols:
        selected_col = st.selectbox("Pilih kolom untuk analisis:", numeric_cols)

        if selected_col:
            col_data = df[selected_col].dropna()

            col1, col2 = st.columns(2)

            with col1:
                st.subheader("Descriptive Statistics")
                stats_df = pd.DataFrame({
                    'Statistic': ['Count', 'Mean', 'Std Dev', 'Min', '25%', '50%', '75%', 'Max', 'Skewness', 'Kurtosis'],
                    'Value': [
                        len(col_data),
                        col_data.mean(),
                        col_data.std(),
                        col_data.min(),
                        col_data.quantile(0.25),
                        col_data.median(),
                        col_data.quantile(0.75),
                        col_data.max(),
                        col_data.skew(),
                        col_data.kurtosis()
                    ]
                })
                st.dataframe(stats_df, use_container_width=True)

            with col2:
                st.subheader("Distribution")
                fig = px.histogram(col_data, x=selected_col,
                                 title=f'Distribution of {selected_col}',
                                 marginal="box")
                st.plotly_chart(fig, use_container_width=True)

def show_correlation_analysis(df):
    """Analisis korelasi"""
    st.header("🔗 Correlation Analysis")

    numeric_df = df.select_dtypes(include=[np.number])

    if len(numeric_df.columns) > 1:
        # Heatmap korelasi
        corr_matrix = numeric_df.corr()

        fig = px.imshow(corr_matrix,
                       title="Correlation Heatmap",
                       color_continuous_scale="RdBu",
                       aspect="auto")
        st.plotly_chart(fig, use_container_width=True)

        # Nilai korelasi detail
        st.subheader("Detailed Correlation Values")
        st.dataframe(corr_matrix.style.background_gradient(cmap='RdBu'),
                    use_container_width=True)

def main():
    st.markdown('<div class="main-header">📊 Exploratory Data Analysis Dashboard</div>',
                unsafe_allow_html=True)

    # File upload
    uploaded_file = st.sidebar.file_uploader(
        "Upload dataset Anda",
        type=['csv', 'xlsx'],
        help="Support CSV dan Excel files"
    )

    if uploaded_file is not None:
        df = load_data(uploaded_file)

        if df is not None:
            # Sidebar controls
            st.sidebar.header("Analysis Options")
            show_overview = st.sidebar.checkbox("Data Overview", True)
            show_missing = st.sidebar.checkbox("Missing Analysis", True)
            show_stats = st.sidebar.checkbox("Statistical Analysis", True)
            show_corr = st.sidebar.checkbox("Correlation Analysis", True)

            # Main analysis sections
            if show_overview:
                show_data_overview(df)

            if show_missing:
                show_missing_analysis(df)

            if show_stats:
                show_statistical_analysis(df)

            if show_corr:
                show_correlation_analysis(df)

            # Download processed data
            st.sidebar.header("Export Data")
            if st.sidebar.button("Download Processed Data as CSV"):
                csv = df.to_csv(index=False)
                st.sidebar.download_button(
                    label="Download CSV",
                    data=csv,
                    file_name="processed_data.csv",
                    mime="text/csv"
                )
    else:
        st.info("👆 Please upload your dataset to begin analysis")
        st.markdown("""
        ### Supported Features:
        - **Data Overview**: Basic statistics and data preview
        - **Missing Analysis**: Identify and visualize missing values
        - **Statistical Analysis**: Detailed descriptive statistics
        - **Correlation Analysis**: Heatmaps and correlation values
        - **Data Export**: Download processed data
        """)

if __name__ == "__main__":
    main()
Contoh 2: Advanced Machine Learning Dashboard
# app_ml.py
import streamlit as st
import pandas as pd
import numpy as np
from sklearn.model_selection import train_test_split, cross_val_score
from sklearn.ensemble import RandomForestClassifier, RandomForestRegressor
from sklearn.linear_model import LogisticRegression, LinearRegression
from sklearn.svm import SVC, SVR
from sklearn.metrics import (accuracy_score, classification_report,
                           confusion_matrix, mean_squared_error, r2_score)
import plotly.express as px
import plotly.figure_factory as ff
import joblib
import io

# Page config
st.set_page_config(
    page_title="ML Model Trainer",
    page_icon="🤖",
    layout="wide"
)

@st.cache_data
def load_data(uploaded_file):
    """Load dataset dengan caching"""
    if uploaded_file.name.endswith('.csv'):
        return pd.read_csv(uploaded_file)
    elif uploaded_file.name.endswith('.xlsx'):
        return pd.read_excel(uploaded_file)
    return None

def evaluate_model(model, X_test, y_test, problem_type):
    """Evaluate model performance"""
    y_pred = model.predict(X_test)

    if problem_type == "classification":
        accuracy = accuracy_score(y_test, y_pred)
        report = classification_report(y_test, y_pred, output_dict=True)
        cm = confusion_matrix(y_test, y_pred)
        return accuracy, report, cm, y_pred
    else:
        mse = mean_squared_error(y_test, y_pred)
        r2 = r2_score(y_test, y_pred)
        return mse, r2, y_pred

def main():
    st.title("🤖 Machine Learning Model Trainer")
    st.markdown("Train and evaluate multiple ML models with ease")

    # File upload
    uploaded_file = st.sidebar.file_uploader(
        "Upload Dataset",
        type=['csv', 'xlsx'],
        help="Dataset harus mengandung features dan target variable"
    )

    if uploaded_file is not None:
        df = load_data(uploaded_file)

        if df is not None:
            st.success(f"✅ Dataset loaded successfully: {df.shape[0]} rows, {df.shape[1]} columns")

            # Problem type selection
            problem_type = st.sidebar.radio(
                "Select Problem Type:",
                ["Classification", "Regression"]
            )

            # Feature and target selection
            st.sidebar.header("Model Configuration")
            target_col = st.sidebar.selectbox(
                "Select Target Variable:",
                df.columns
            )

            feature_cols = st.sidebar.multiselect(
                "Select Features:",
                [col for col in df.columns if col != target_col],
                default=[col for col in df.columns if col != target_col]
            )

            # Model selection based on problem type
            if problem_type == "Classification":
                models = {
                    "Random Forest": RandomForestClassifier(),
                    "Logistic Regression": LogisticRegression(),
                    "Support Vector Machine": SVC()
                }
            else:
                models = {
                    "Random Forest": RandomForestRegressor(),
                    "Linear Regression": LinearRegression(),
                    "Support Vector Regression": SVR()
                }

            selected_models = st.sidebar.multiselect(
                "Select Models to Train:",
                list(models.keys()),
                default=list(models.keys())[0]
            )

            # Training parameters
            st.sidebar.header("Training Parameters")
            test_size = st.sidebar.slider("Test Size Ratio:", 0.1, 0.5, 0.2, 0.05)
            random_state = st.sidebar.number_input("Random State:", 42)
            cv_folds = st.sidebar.slider("Cross-Validation Folds:", 3, 10, 5)

            if st.sidebar.button("🚀 Train Models"):
                if not feature_cols:
                    st.error("Please select at least one feature!")
                    return

                # Prepare data
                X = df[feature_cols]
                y = df[target_col]

                # Handle categorical variables
                X = pd.get_dummies(X)

                # Split data
                X_train, X_test, y_train, y_test = train_test_split(
                    X, y, test_size=test_size, random_state=random_state
                )

                # Train and evaluate models
                results = {}

                for model_name in selected_models:
                    with st.spinner(f"Training {model_name}..."):
                        model = models[model_name]

                        # Train model
                        model.fit(X_train, y_train)

                        # Evaluate model
                        if problem_type == "Classification":
                            accuracy, report, cm, y_pred = evaluate_model(
                                model, X_test, y_test, "classification"
                            )

                            # Cross-validation
                            cv_scores = cross_val_score(model, X, y, cv=cv_folds)

                            results[model_name] = {
                                'type': 'classification',
                                'accuracy': accuracy,
                                'report': report,
                                'cm': cm,
                                'cv_scores': cv_scores,
                                'model': model
                            }
                        else:
                            mse, r2, y_pred = evaluate_model(
                                model, X_test, y_test, "regression"
                            )

                            cv_scores = cross_val_score(model, X, y, cv=cv_folds,
                                                      scoring='r2')

                            results[model_name] = {
                                'type': 'regression',
                                'mse': mse,
                                'r2': r2,
                                'cv_scores': cv_scores,
                                'model': model,
                                'predictions': y_pred
                            }

                # Display results
                st.header("📊 Model Results")

                # Metrics comparison
                if problem_type == "Classification":
                    metrics_df = pd.DataFrame({
                        'Model': list(results.keys()),
                        'Accuracy': [results[model]['accuracy'] for model in results],
                        'CV Mean Score': [results[model]['cv_scores'].mean() for model in results],
                        'CV Std': [results[model]['cv_scores'].std() for model in results]
                    })
                else:
                    metrics_df = pd.DataFrame({
                        'Model': list(results.keys()),
                        'R² Score': [results[model]['r2'] for model in results],
                        'MSE': [results[model]['mse'] for model in results],
                        'CV Mean Score': [results[model]['cv_scores'].mean() for model in results],
                        'CV Std': [results[model]['cv_scores'].std() for model in results]
                    })

                st.subheader("Model Comparison")
                st.dataframe(metrics_df.style.highlight_max(axis=0),
                           use_container_width=True)

                # Detailed results for each model
                for model_name, result in results.items():
                    with st.expander(f"Detailed Results - {model_name}"):
                        col1, col2 = st.columns(2)

                        with col1:
                            st.metric("Accuracy" if problem_type == "classification" else "R² Score",
                                    f"{result['accuracy' if problem_type == 'classification' else 'r2']:.3f}")
                            st.metric("CV Mean Score", f"{result['cv_scores'].mean():.3f}")

                        with col2:
                            st.metric("CV Std", f"{result['cv_scores'].std():.3f}")
                            if problem_type == "regression":
                                st.metric("MSE", f"{result['mse']:.3f}")

                        # Visualizations
                        if problem_type == "classification":
                            # Confusion matrix
                            fig_cm = px.imshow(result['cm'],
                                             title=f"Confusion Matrix - {model_name}",
                                             labels=dict(x="Predicted", y="Actual"),
                                             color_continuous_scale="Blues")
                            st.plotly_chart(fig_cm, use_container_width=True)
                        else:
                            # Regression plot
                            fig_reg = px.scatter(x=y_test, y=result['predictions'],
                                              title=f"Actual vs Predicted - {model_name}",
                                              labels={'x': 'Actual', 'y': 'Predicted'})
                            fig_reg.add_shape(type='line', line=dict(dash='dash'),
                                            x0=y_test.min(), y0=y_test.min(),
                                            x1=y_test.max(), y1=y_test.max())
                            st.plotly_chart(fig_reg, use_container_width=True)

                # Model saving
                st.header("💾 Model Export")
                best_model_name = metrics_df.iloc[metrics_df['Accuracy' if problem_type == 'classification' else 'R² Score'].idxmax()]['Model']
                best_model = results[best_model_name]['model']

                # Save model
                model_buffer = io.BytesIO()
                joblib.dump(best_model, model_buffer)
                model_buffer.seek(0)

                st.download_button(
                    label=f"Download Best Model ({best_model_name})",
                    data=model_buffer,
                    file_name=f"best_model_{best_model_name}.pkl",
                    mime="application/octet-stream"
                )

    else:
        st.info("👆 Please upload your dataset to begin model training")
        st.markdown("""
        ### Supported Features:
        - **Classification & Regression**: Multiple algorithm support
        - **Model Comparison**: Side-by-side performance comparison
        - **Cross-Validation**: Robust model evaluation
        - **Visual Analytics**: Confusion matrices, regression plots
        - **Model Export**: Download trained models
        - **Hyperparameter Tuning**: Basic parameter configuration
        """)

if __name__ == "__main__":
    main()
🏗️ Project Structure Best Practices
my_streamlit_project/
├── apps/                          # Streamlit applications
│   ├── app_eda.py                # EDA dashboard
│   ├── app_ml.py                 # ML model trainer
│   ├── app_dashboard.py          # Main dashboard
│   └── app_monitoring.py         # Real-time monitoring
├── data/                         # Data directory
│   ├── raw/                      # Raw data files
│   ├── processed/                # Processed data
│   └── external/                 # External datasets
├── models/                       # Trained models
│   ├── production/               # Production models
│   └── experimental/             # Experimental models
├── utils/                        # Utility functions
│   ├── data_loader.py           # Data loading utilities
│   ├── visualization.py         # Plotting functions
│   └── helpers.py               # Helper functions
├── tests/                        # Test files
│   ├── test_data_loader.py
│   └── test_visualization.py
├── .streamlit/                   # Streamlit configuration
│   ├── config.toml
│   └── credentials.toml
├── requirements.txt              # Python dependencies
├── environment.yml              # Conda environment
├── Dockerfile                   # Container configuration
├── .env.example                 # Environment variables template
├── .gitignore                   # Git ignore rules
└── README.md                    # Project documentation
📋 Dependencies & Requirements
Core Dependencies:
streamlit>=1.28.0
pandas>=1.5.0
numpy>=1.21.0
plotly>=5.13.0
scikit-learn>=1.2.0
scipy>=1.9.0
matplotlib>=3.5.0
seaborn>=0.12.0
joblib>=1.2.0
click>=8.0.0
Optional Dependencies:
# Data processing
openpyxl>=3.0.0        # Excel support
pyarrow>=10.0.0        # Parquet support
sqlalchemy>=2.0.0      # Database support

# Advanced visualizations
altair>=5.0.0
bokeh>=3.0.0
folium>=0.14.0

# Machine learning
xgboost>=1.7.0
lightgbm>=3.3.0
catboost>=1.0.0

# Utilities
python-dotenv>=1.0.0   # Environment variables
tqdm>=4.65.0          # Progress bars
Development Dependencies:
pytest>=7.0.0
black>=23.0.0
flake8>=6.0.0
mypy>=1.0.0
pre-commit>=3.0.0
pytest-cov>=4.0.0
🐛 Troubleshooting & Debugging
Common Issues dan Solutions:
- Port Already in Use:
# Cari process yang menggunakan port
lsof -i :8501

# Kill process
kill -9 $(lsof -t -i:8501)

# Atau gunakan port lain
streamlit_launcher --port 8502
- Module Import Errors:
# Check Python path
python -c "import sys; print(sys.path)"

# Reinstall package
pip uninstall streamlit-launcher
pip install --no-cache-dir streamlit-launcher
- Permission Issues:
# Gunakan virtual environment
python -m venv myenv
source myenv/bin/activate

# Atau install untuk user
pip install --user streamlit-launcher
- Performance Issues:
# Enable caching
@st.cache_data
def load_data():
    return pd.read_csv('large_file.csv')

# Use lighter data types
df = df.astype({col: 'category' for col in categorical_columns})
Debug Mode:
# Enable detailed logging
streamlit-launcher --log-level debug

# Atau set environment variable
export STREAMLIT_LOG_LEVEL=debug
export STREAMLIT_DEBUG=true

# Debug specific component
import streamlit as st
st.write(st.session_state)  # Print session state
🚀 Deployment & Production
Local Deployment:
# Run with production settings
streamlit-launcher --port 8501 --host 0.0.0.0 --log-level error
Docker Deployment:
FROM python:3.9-slim

WORKDIR /app

COPY requirements.txt .
RUN pip install --no-cache-dir -r requirements.txt

COPY . .

EXPOSE 8501

CMD ["streamlit-launcher", "--server.port=8501", "--server.address=0.0.0.0"]
Cloud Deployment:
# streamlit.yaml untuk Kubernetes
apiVersion: apps/v1
kind: Deployment
metadata:
  name: streamlit-app
spec:
  replicas: 3
  selector:
    matchLabels:
      app: streamlit
  template:
    metadata:
      labels:
        app: streamlit
    spec:
      containers:
      - name: streamlit
        image: your-registry/streamlit-app:latest
        ports:
        - containerPort: 8501
        env:
        - name: STREAMLIT_SERVER_PORT
          value: "8501"
🤝 Contributing
Kami menyambut kontribusi dari komunitas! Berikut cara berkontribusi:
Setup Development Environment:
# Fork dan clone repository
git clone https://github.com/DwiDevelopes/streamlit-launcher.git
cd streamlit-launcher

# Setup development environment
python -m venv venv
source venv/bin/activate  # Windows: venv\Scripts\activate

# Install development dependencies
pip install -e ".[dev]"

# Setup pre-commit hooks
pre-commit install
Development Workflow:
- Buat branch baru:
git checkout -b feature/amazing-feature
- Lakukan perubahan dan test:
# Run tests
pytest

# Check code style
black .
flake8
mypy .

# Test the package
python -m streamlit_launcher --help
- Commit changes:
git add .
git commit -m "feat: add amazing feature"
git push origin feature/amazing-feature
- Buat Pull Request
Testing:
# Run all tests
pytest

# Run with coverage
pytest --cov=streamlit_launcher tests/

# Run specific test file
pytest tests/test_launcher.py -v

# Run with different Python versions
tox
📄 License
Distributed under the MIT License. See LICENSE for more information.
🔗 Links & Resources
- Official Documentation: https://streamlit-launcher-docs.readthedocs.io/
- PyPI Package: https://pypi.org/project/streamlit-launcher/
- GitHub Repository: https://github.com/royhtml/streamlit-launcher
- Issue Tracker: https://github.com/royhtml/streamlit-launcher/issues
- Streamlit Documentation: https://docs.streamlit.io/
- Community Forum: https://discuss.streamlit.io/
📞 Support & Community
Getting Help:
- Documentation: Check the comprehensive docs first
- GitHub Issues: Search existing issues or create new one
- Community Forum: Ask questions on Streamlit forum
- Stack Overflow: Use tag
[streamlit]
Reporting Bugs:
# Include system information
python -c "import streamlit_launcher; print(streamlit_launcher.__version__)"
python --version

# Describe the issue clearly
# Include error messages and screenshots
# Provide steps to reproduce
Feature Requests:
Kami welcome feature requests! Silakan:
- Check existing issues terlebih dahulu
- Jelaskan use case secara detail
- Sertakan contoh kode jika memungkinkan
- Vote pada features yang sudah ada
⭐ Jangan lupa memberikan bintang di GitHub jika tool ini membantu!
Streamlit Launcher dikembangkan dengan ❤️ oleh Dwi Bakti N Dev
Release history Release notifications | RSS feed


Download files
Download the file for your platform. If you're not sure which to choose, learn more about installing packages.
Source Distribution
Built Distribution
Filter files by name, interpreter, ABI, and platform.
If you're not sure about the file name format, learn more about wheel file names.
Copy a direct link to the current filters
File details
Details for the file streamlit_launcher-3.8.5.tar.gz.
File metadata
- Download URL: streamlit_launcher-3.8.5.tar.gz
- Upload date:
- Size: 791.5 kB
- Tags: Source
- Uploaded using Trusted Publishing? No
- Uploaded via: twine/6.1.0 CPython/3.12.4
File hashes
| Algorithm | Hash digest | |
|---|---|---|
| SHA256 |
ad69cad95b19f26c7b5ae7574755c4ed23005cc933064ff3a9364161f4000454
|
|
| MD5 |
b95a9a95e276b4f61f46a793c9ee6b64
|
|
| BLAKE2b-256 |
86101826a3e08bc130725955d5e7d0d018761bc011009a668defae3e54fa6088
|
File details
Details for the file streamlit_launcher-3.8.5-py3-none-any.whl.
File metadata
- Download URL: streamlit_launcher-3.8.5-py3-none-any.whl
- Upload date:
- Size: 767.1 kB
- Tags: Python 3
- Uploaded using Trusted Publishing? No
- Uploaded via: twine/6.1.0 CPython/3.12.4
File hashes
| Algorithm | Hash digest | |
|---|---|---|
| SHA256 |
ff88079aa72574a26b12e23ae1b7f43a421a21d0873f28a015a7c015e815bd8b
|
|
| MD5 |
df7c16a838e0714fc6a520d294617175
|
|
| BLAKE2b-256 |
e41498b18bb858229c100115ade0d2f3ee914d174444bb15872b72470454b405
|


