Wrapper for TradingView lightweight-charts using ntf fork

Project description
streamlit-lightweight-charts-ntf
This streamlit component wraps lightweight-charts using the ntf fork.
This fork augments the lightweight-charts with an effective and aligned multipane experience.
The ntf fork is frozen on an old version (v3.8.0), there are no further developments, and no further updates - it is an AS IT IS scenario. Although it seems very stable and very useful for financial and trading Data Science. It has an extra option pane that:
- Aligns panes - by width
- synchronises panes mouse moves
- synchronises the hair-cross cursor between charts
Documentation
A nice example from DeKay on how to use:
How to install:
python -m pip install streamlit-lightweight-charts-ntf
How to use:
from streamlit_lightweight_charts_ntf import renderLightweightCharts

renderLightweightCharts(charts: <List of Dicts> , key: <str>)
API
-
charts:
<List of Dicts> -
key:
<str>when creating multiple charts in one page
The extra option: pane
In the example below you will notice the option pane that is used to group charts
It return values from an onClick() event
<List of Dicts>-
time(x axis)
-
prices(y axis)
-
-
title(title set in options)
-
-
-
type(e.g. Candlestick)
-
-
-
values(depending on chart type)
-
import streamlit as st
from streamlit_lightweight_charts_ntf import renderLightweightCharts
import json
import numpy as np
import yfinance as yf
import pandas as pd
import pandas_ta as ta
COLOR_BULL = 'rgba(38,166,154,0.9)' # #26a69a
COLOR_BEAR = 'rgba(239,83,80,0.9)' # #ef5350
def dataToJSON(df, column, slice=0, color=None):
data = df[['time', column, 'color']].copy()
data = data.rename(columns={column: "value"})
if(color == None):
data.drop('color', axis=1)
elif(color != 'default'):
data['color'] = color
if(slice > 0):
data = data.iloc[slice:,:]
return json.loads(data.to_json(orient = "records"))
# Request historic pricing data via finance.yahoo.com API
df = yf.Ticker('AAPL').history(period='9mo')[['Open', 'High', 'Low', 'Close', 'Volume']]
# Some data wrangling to match required format
df = df.reset_index()
df.columns = ['time','open','high','low','close','volume'] # rename columns
df['time'] = df['time'].dt.strftime('%Y-%m-%d') # Date to string
# indicators
df.ta.macd(close='close', fast=6, slow=12, signal=5, append=True) # calculate macd
df.ta.ema(close='close', length=14, offset=None, append=True) # EMA fast
df.ta.sma(close='close', length=60, offset=None, append=True) # SMA slow
df.ta.rsi(close='close', length=14, offset=None, append=True) # RSI - momentum oscillator
df['VOL_BID'] = -df['volume'].sample(frac=1).values # shuffle and negate volume values
# export to JSON format
df['color'] = np.where( df['open'] > df['close'], COLOR_BEAR, COLOR_BULL) # bull or bear
candles = json.loads(df.to_json(orient = "records"))
sma_slow = dataToJSON(df,"SMA_60", 60, 'blue')
ema_fast = dataToJSON(df, "EMA_14", 14, 'orange')
vol_ASK = dataToJSON(df,'volume', 0, COLOR_BULL)
vol_BID = dataToJSON(df,'VOL_BID', 0, COLOR_BEAR)
rsi = dataToJSON(df,'RSI_14', 14, 'purple')
macd_fast = dataToJSON(df, "MACDh_6_12_5", 0, 'orange')
macd_slow = dataToJSON(df, "MACDs_6_12_5", 0, 'blue')
df['color'] = np.where( df['MACD_6_12_5'] > 0, COLOR_BULL, COLOR_BEAR) # MACD histogram color
macd_hist = dataToJSON(df, "MACD_6_12_5")
chartMultipaneOptions = [
{
"width": 600,
"height": 600,
"layout": {
"background": {
"type": "solid",
"color": 'white'
},
"textColor": "black"
},
"grid": {
"vertLines": {
"color": "rgba(197, 203, 206, 0.5)"
},
"horzLines": {
"color": "rgba(197, 203, 206, 0.5)"
}
},
"priceScale": {
"borderColor": "rgba(197, 203, 206, 0.8)"
},
"timeScale": {
"borderColor": "rgba(197, 203, 206, 0.8)",
"barSpacing": 10,
"minBarSpacing": 8
}
}
]
seriesMultipaneChart = [
{
"type": 'Candlestick',
"title": 'Main chart',
"data": candles,
"options": {
"upColor": COLOR_BULL,
"downColor": COLOR_BEAR,
"borderVisible": False,
"wickUpColor": COLOR_BULL,
"wickDownColor": COLOR_BEAR,
"pane": 0
}
},
{
"type": 'Line',
"title": 'SMA slow',
"data": sma_slow,
"options": {
"color": 'blue',
"lineWidth": 2,
"pane": 0
}
},
{
"type": 'Line',
"title": 'EMA fast',
"data": ema_fast,
"options": {
"color": 'green',
"lineWidth": 2,
"pane": 0
}
},
{
"type": 'Histogram',
"title": 'volume ASK',
"data": vol_ASK,
"options": {
"priceFormat": {
"type": 'volume',
},
"pane": 1
}
},
{
"type": 'Histogram',
"title": 'volume BID',
"data": vol_BID,
"options": {
"priceFormat": {
"type": 'volume',
},
"pane": 1
}
},
{
"type": 'Line',
"title": 'RSI',
"data": rsi,
"options": {
"lineWidth": 2,
"pane": 2
}
},
{
"type": 'Line',
"title": 'MACD fast',
"data": macd_fast,
"options": {
"lineWidth": 2,
"pane": 3
}
},
{
"type": 'Line',
"title": 'MACD slow',
"data": macd_slow,
"options": {
"lineWidth": 2,
"pane": 3
}
},
{
"type": 'Histogram',
"title": 'MACD histogram',
"data": macd_hist,
"options": {
"lineWidth": 1,
"pane": 3
}
}
]
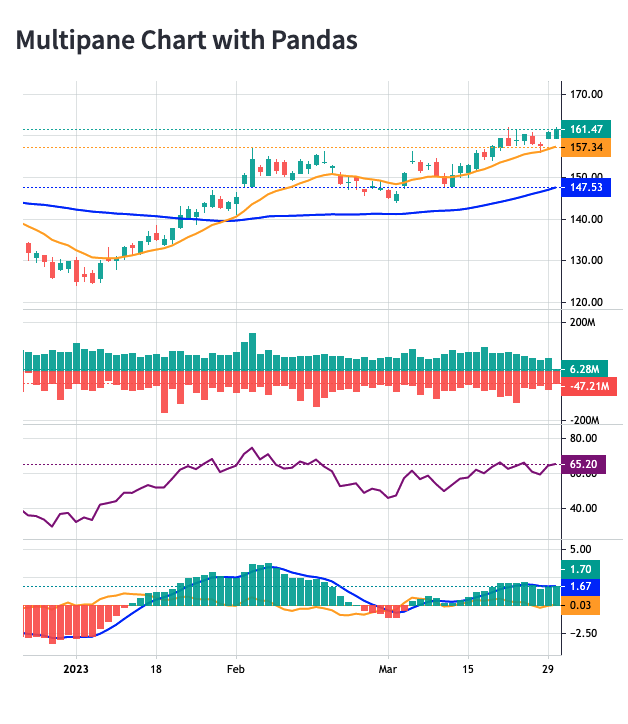
st.subheader("Multipane Chart with Pandas")
click_events = renderLightweightCharts([
{
"chart": chartMultipaneOptions[0],
"series": seriesMultipaneChart
}
], 'multipane')
print('onClick event', click_events)
Release history Release notifications | RSS feed


Download files
Download the file for your platform. If you're not sure which to choose, learn more about installing packages.
Source Distribution
Built Distribution
Filter files by name, interpreter, ABI, and platform.
If you're not sure about the file name format, learn more about wheel file names.
Copy a direct link to the current filters
File details
Details for the file streamlit-lightweight-charts-ntf-0.8.12.tar.gz.
File metadata
- Download URL: streamlit-lightweight-charts-ntf-0.8.12.tar.gz
- Upload date:
- Size: 644.3 kB
- Tags: Source
- Uploaded using Trusted Publishing? No
- Uploaded via: twine/4.0.2 CPython/3.9.5
File hashes
| Algorithm | Hash digest | |
|---|---|---|
| SHA256 |
92330c183889e77836a50c6732e1d0c98472392b77ca4c410870e90736089cf5
|
|
| MD5 |
cc0dd367f7d43a99b074b9b3d1861f61
|
|
| BLAKE2b-256 |
d9029671e05b68e23b2317210ef3e2329d55e19a24b9bf702b998b7aee734ac0
|
File details
Details for the file streamlit_lightweight_charts_ntf-0.8.12-py3-none-any.whl.
File metadata
- Download URL: streamlit_lightweight_charts_ntf-0.8.12-py3-none-any.whl
- Upload date:
- Size: 1.3 MB
- Tags: Python 3
- Uploaded using Trusted Publishing? No
- Uploaded via: twine/4.0.2 CPython/3.9.5
File hashes
| Algorithm | Hash digest | |
|---|---|---|
| SHA256 |
e22b98ef0ac92eaa4b6e47b01de3942aa8a3e50aa7e2a1ef30d424fcdaf179d0
|
|
| MD5 |
bb22c7cae52405be6332e8ebca9f708c
|
|
| BLAKE2b-256 |
c6c05a70ff98c7ddf5df2b112e86630a8cbcd6df5a1fe78c6206eeca34224597
|


