
Streamlit Lightweight Charts v5
A Streamlit component that integrates TradingView's Lightweight Charts v5 library, providing interactive financial charts with multi-pane support for technical analysis.
Overview
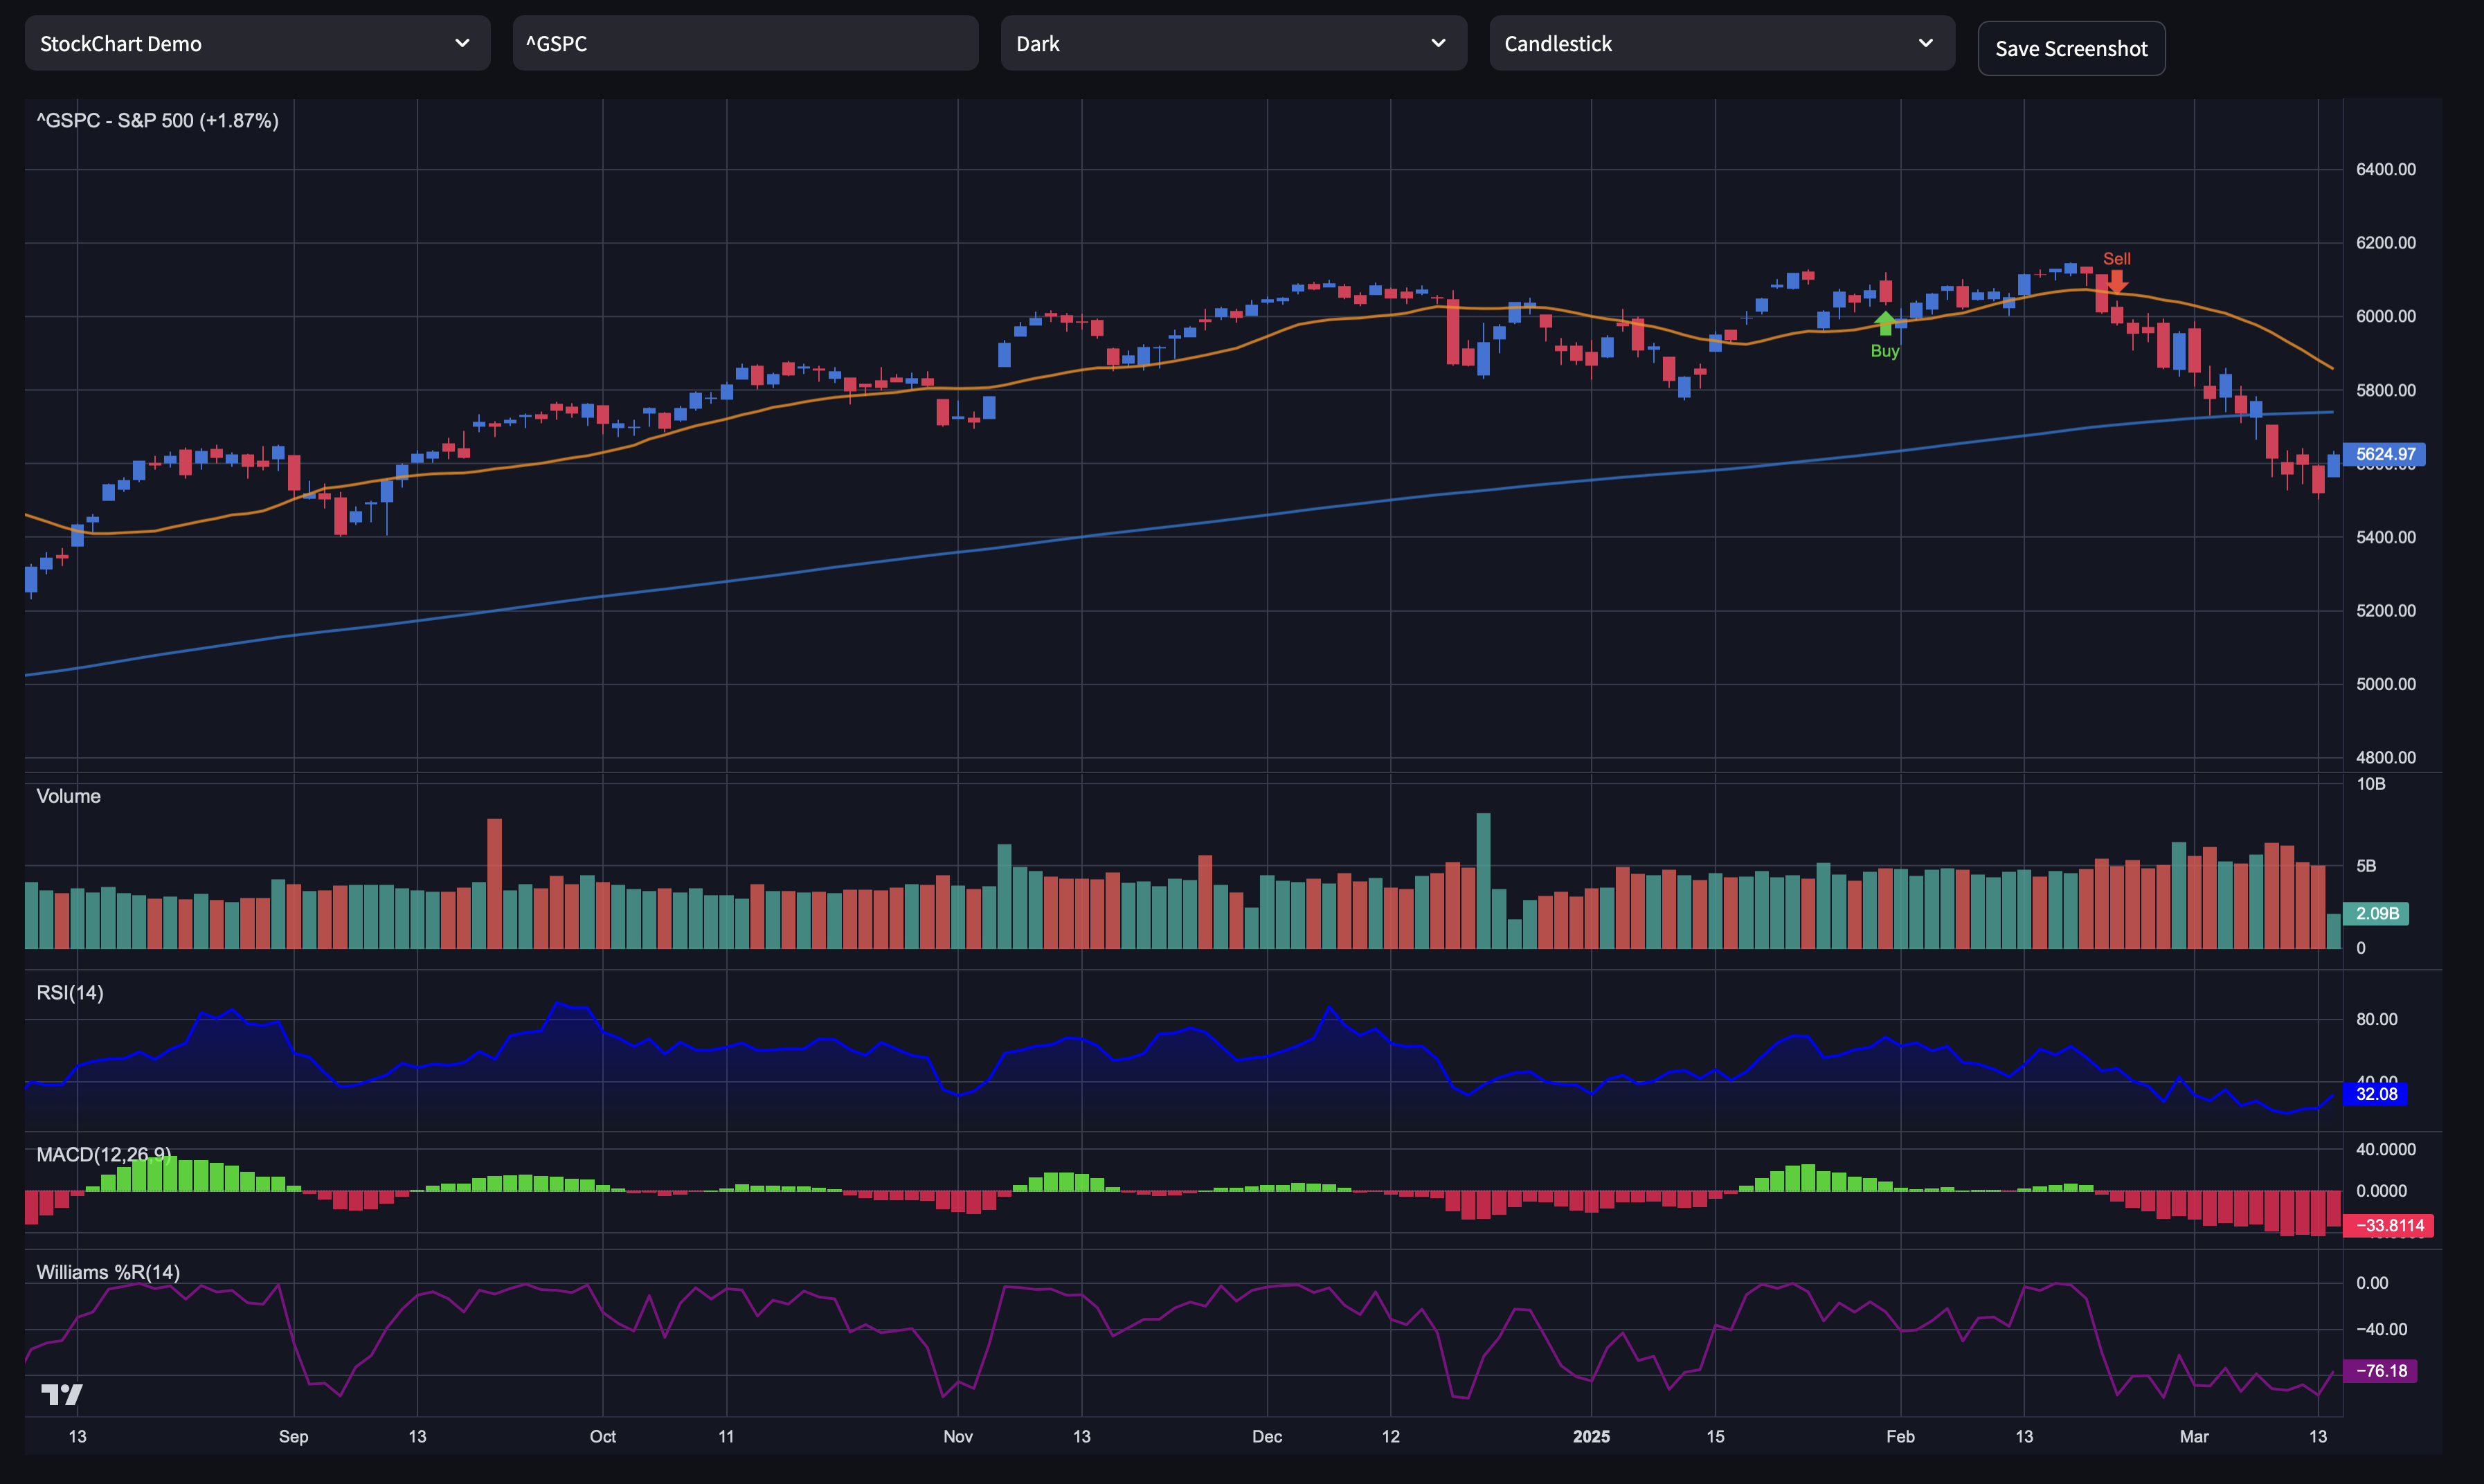
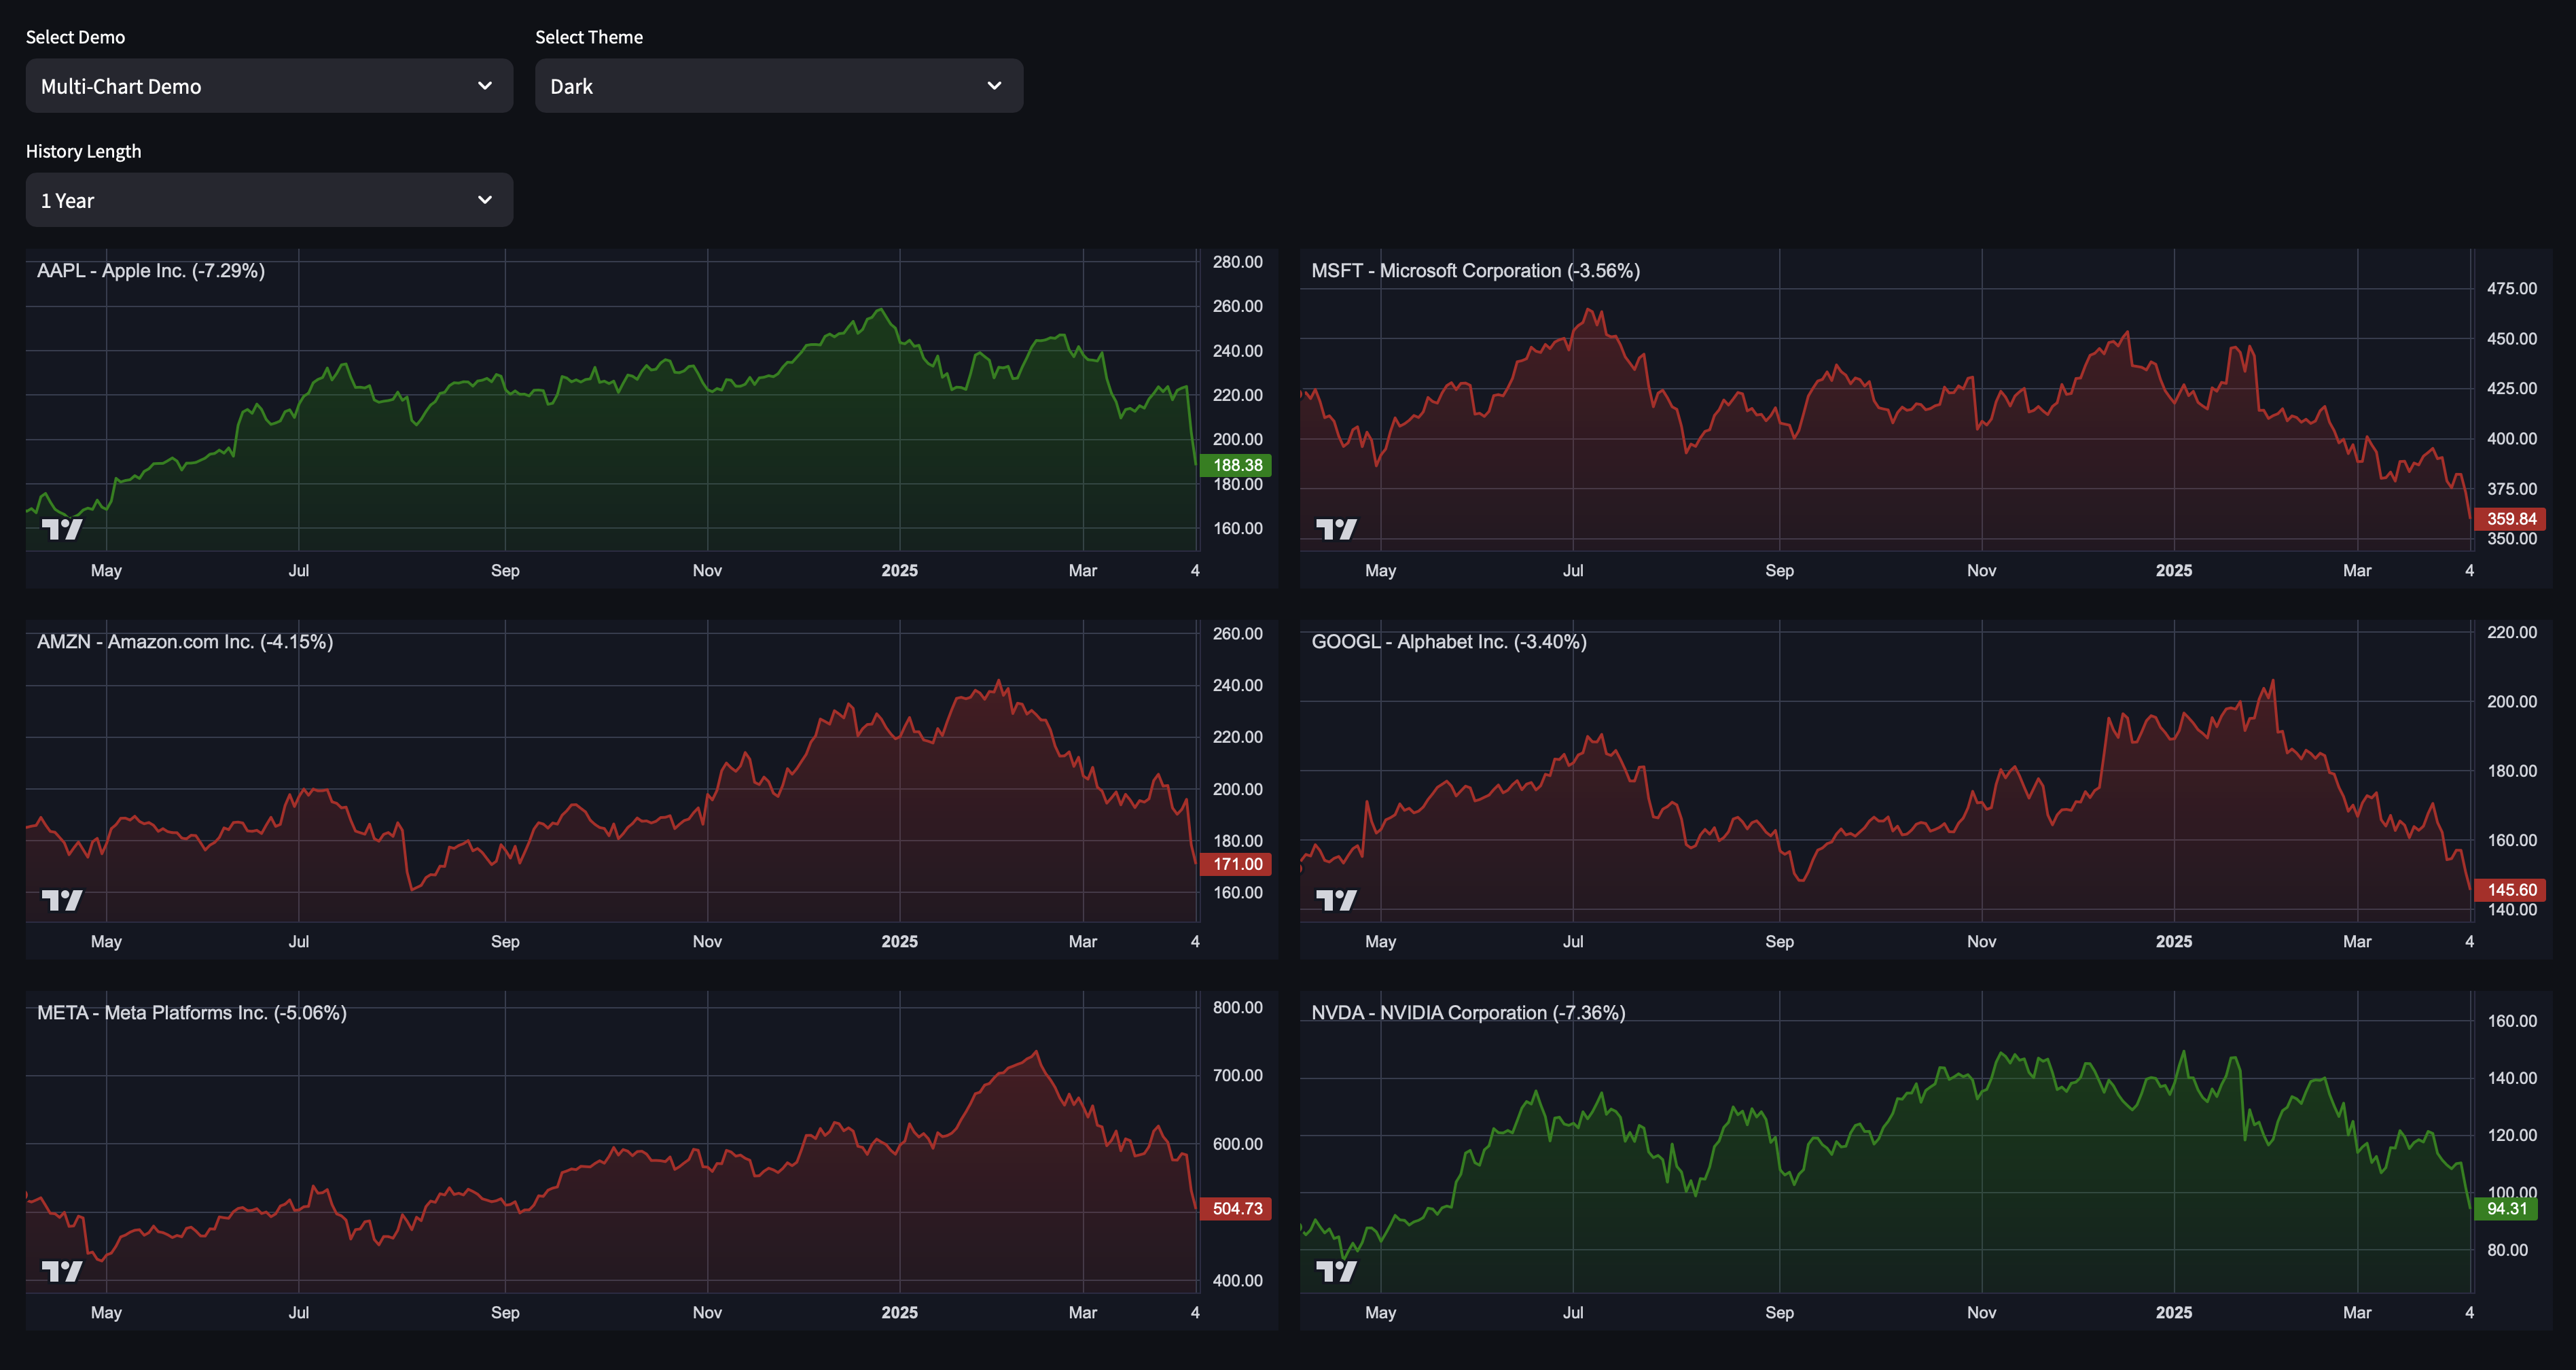
Streamlit Lightweight Charts v5 is built around version 5 of the TradingView Lightweight Charts library, which introduces powerful multi-pane capabilities perfect for technical analysis. This component allows you to create great looking financial charts with multiple indicators stacked vertically, similar to popular trading platforms.
Key features:
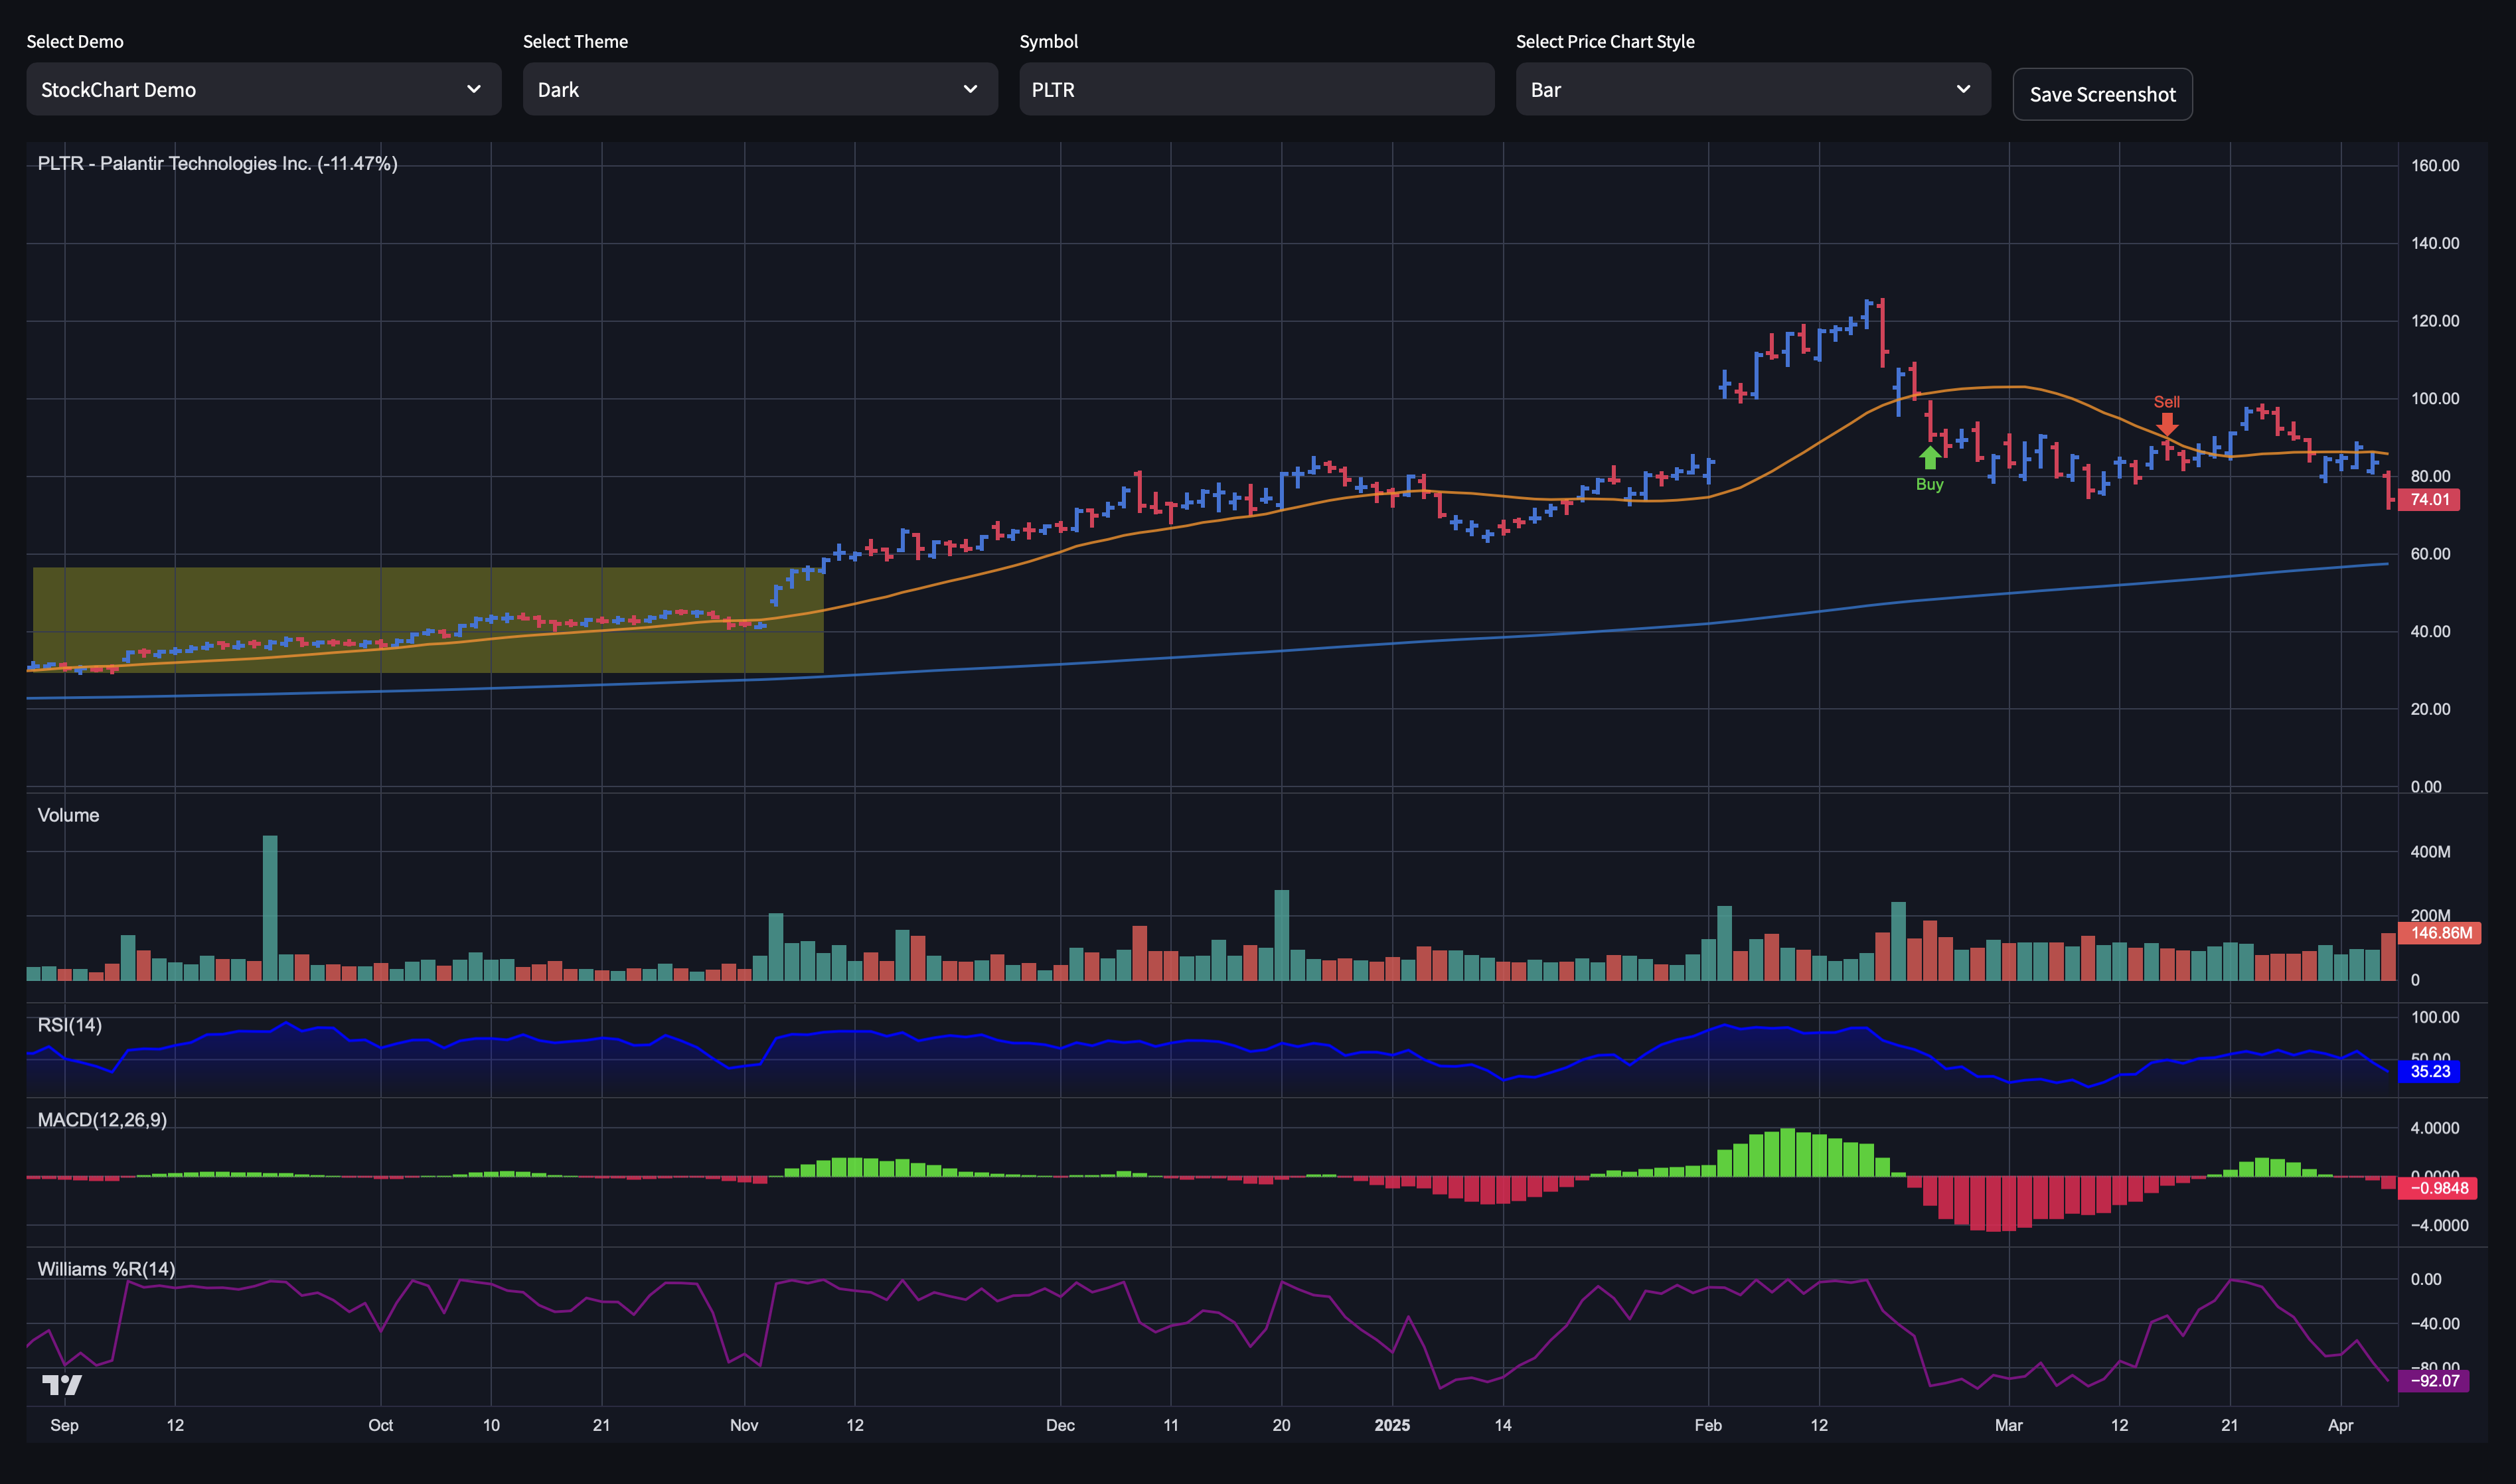
- Multi-pane chart layouts for price and indicators
- Customizable themes and styles
- Add your own favourite standalone technical indicators (RSI, MACD, Williams %R etc.)
- Use overlay indicators (Moving Averages, AVWAP, Pivot Points...)
- Support for drawing Rectangles for e.g. Support / Resistance areas from code
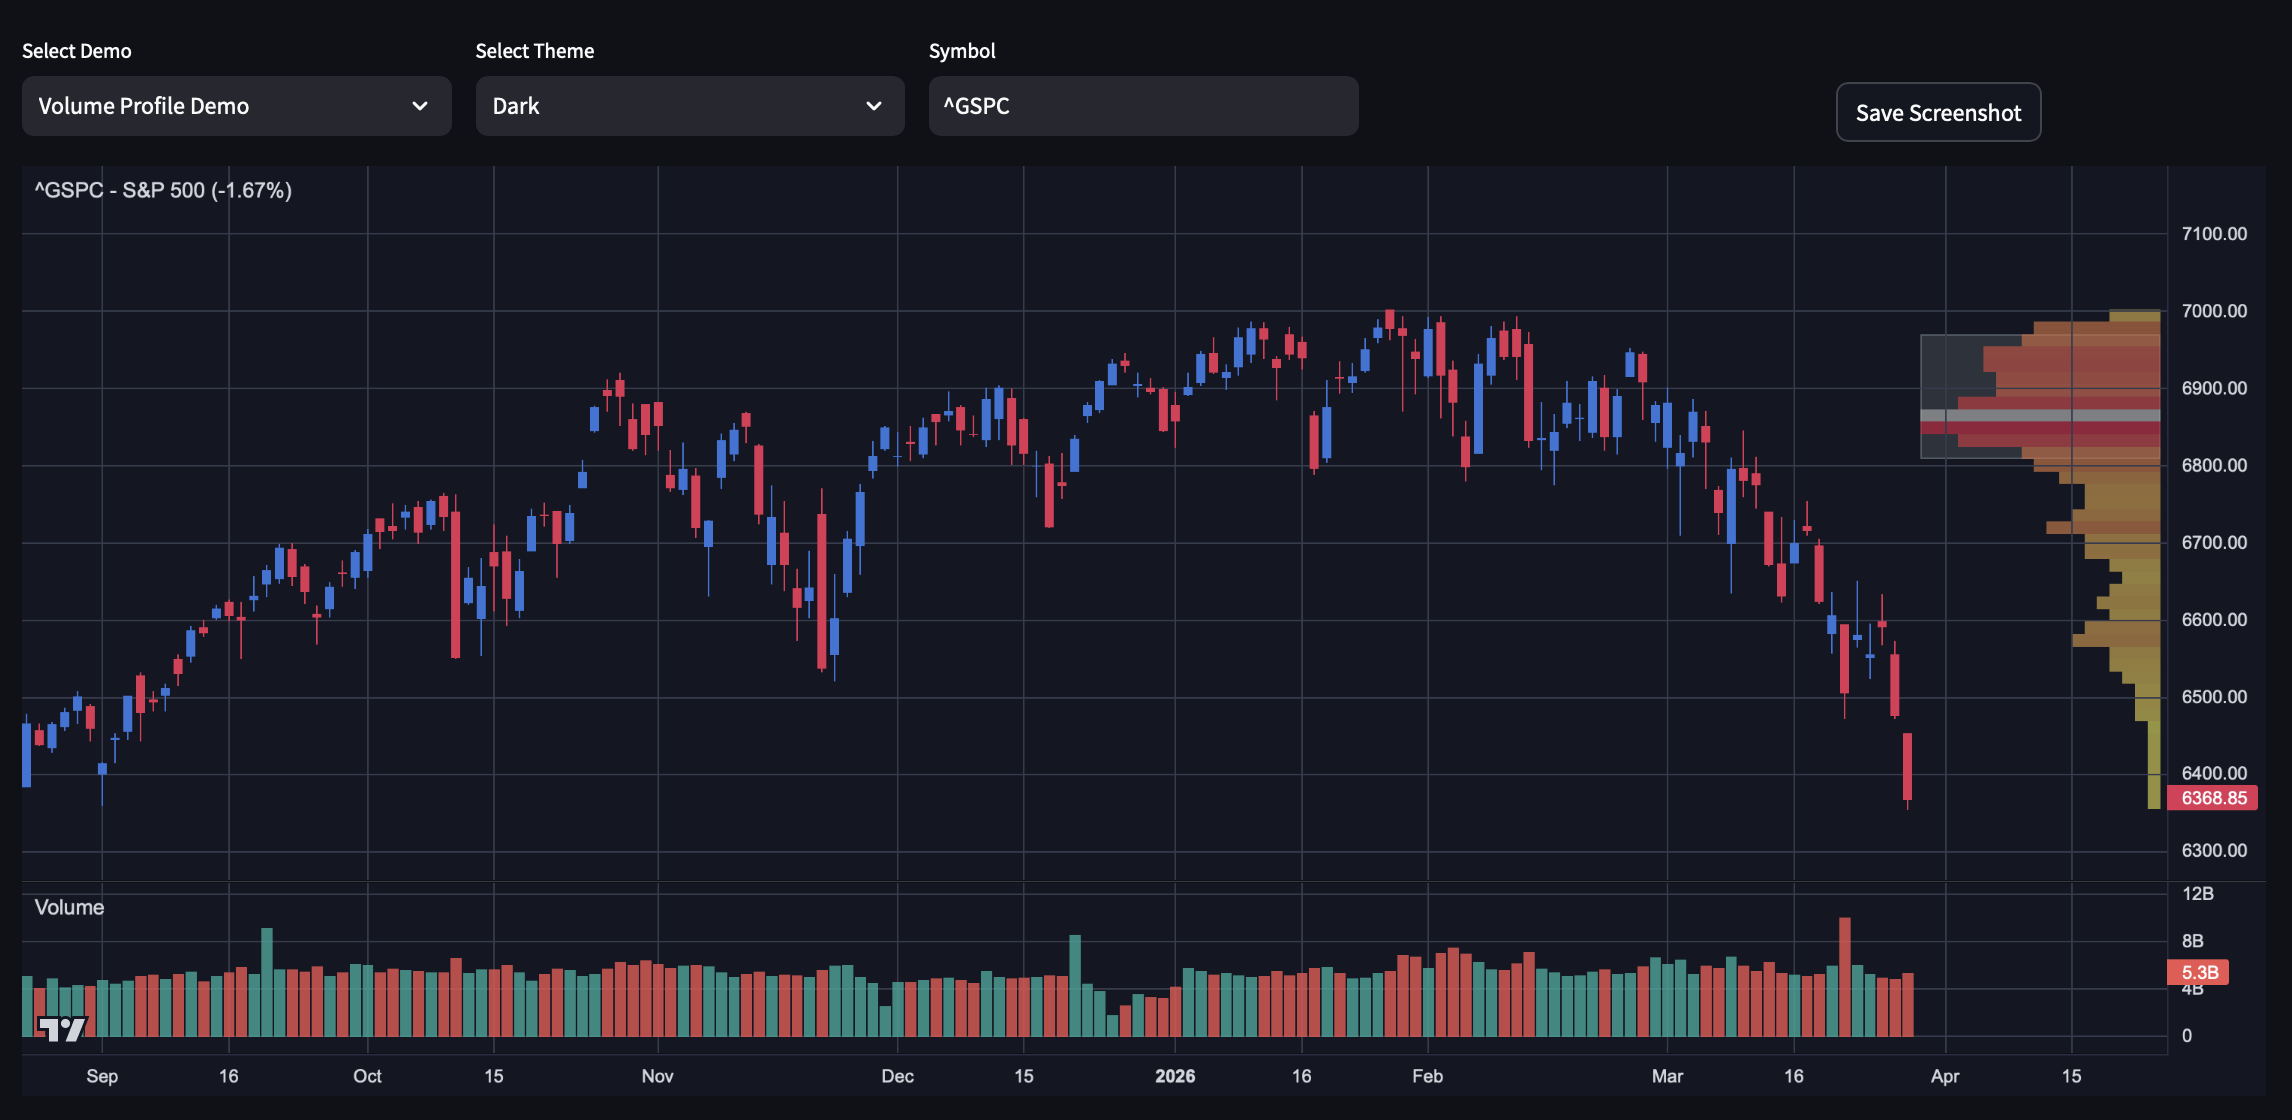
- Volume Profile overlay with pivot-based horizontal volume distribution
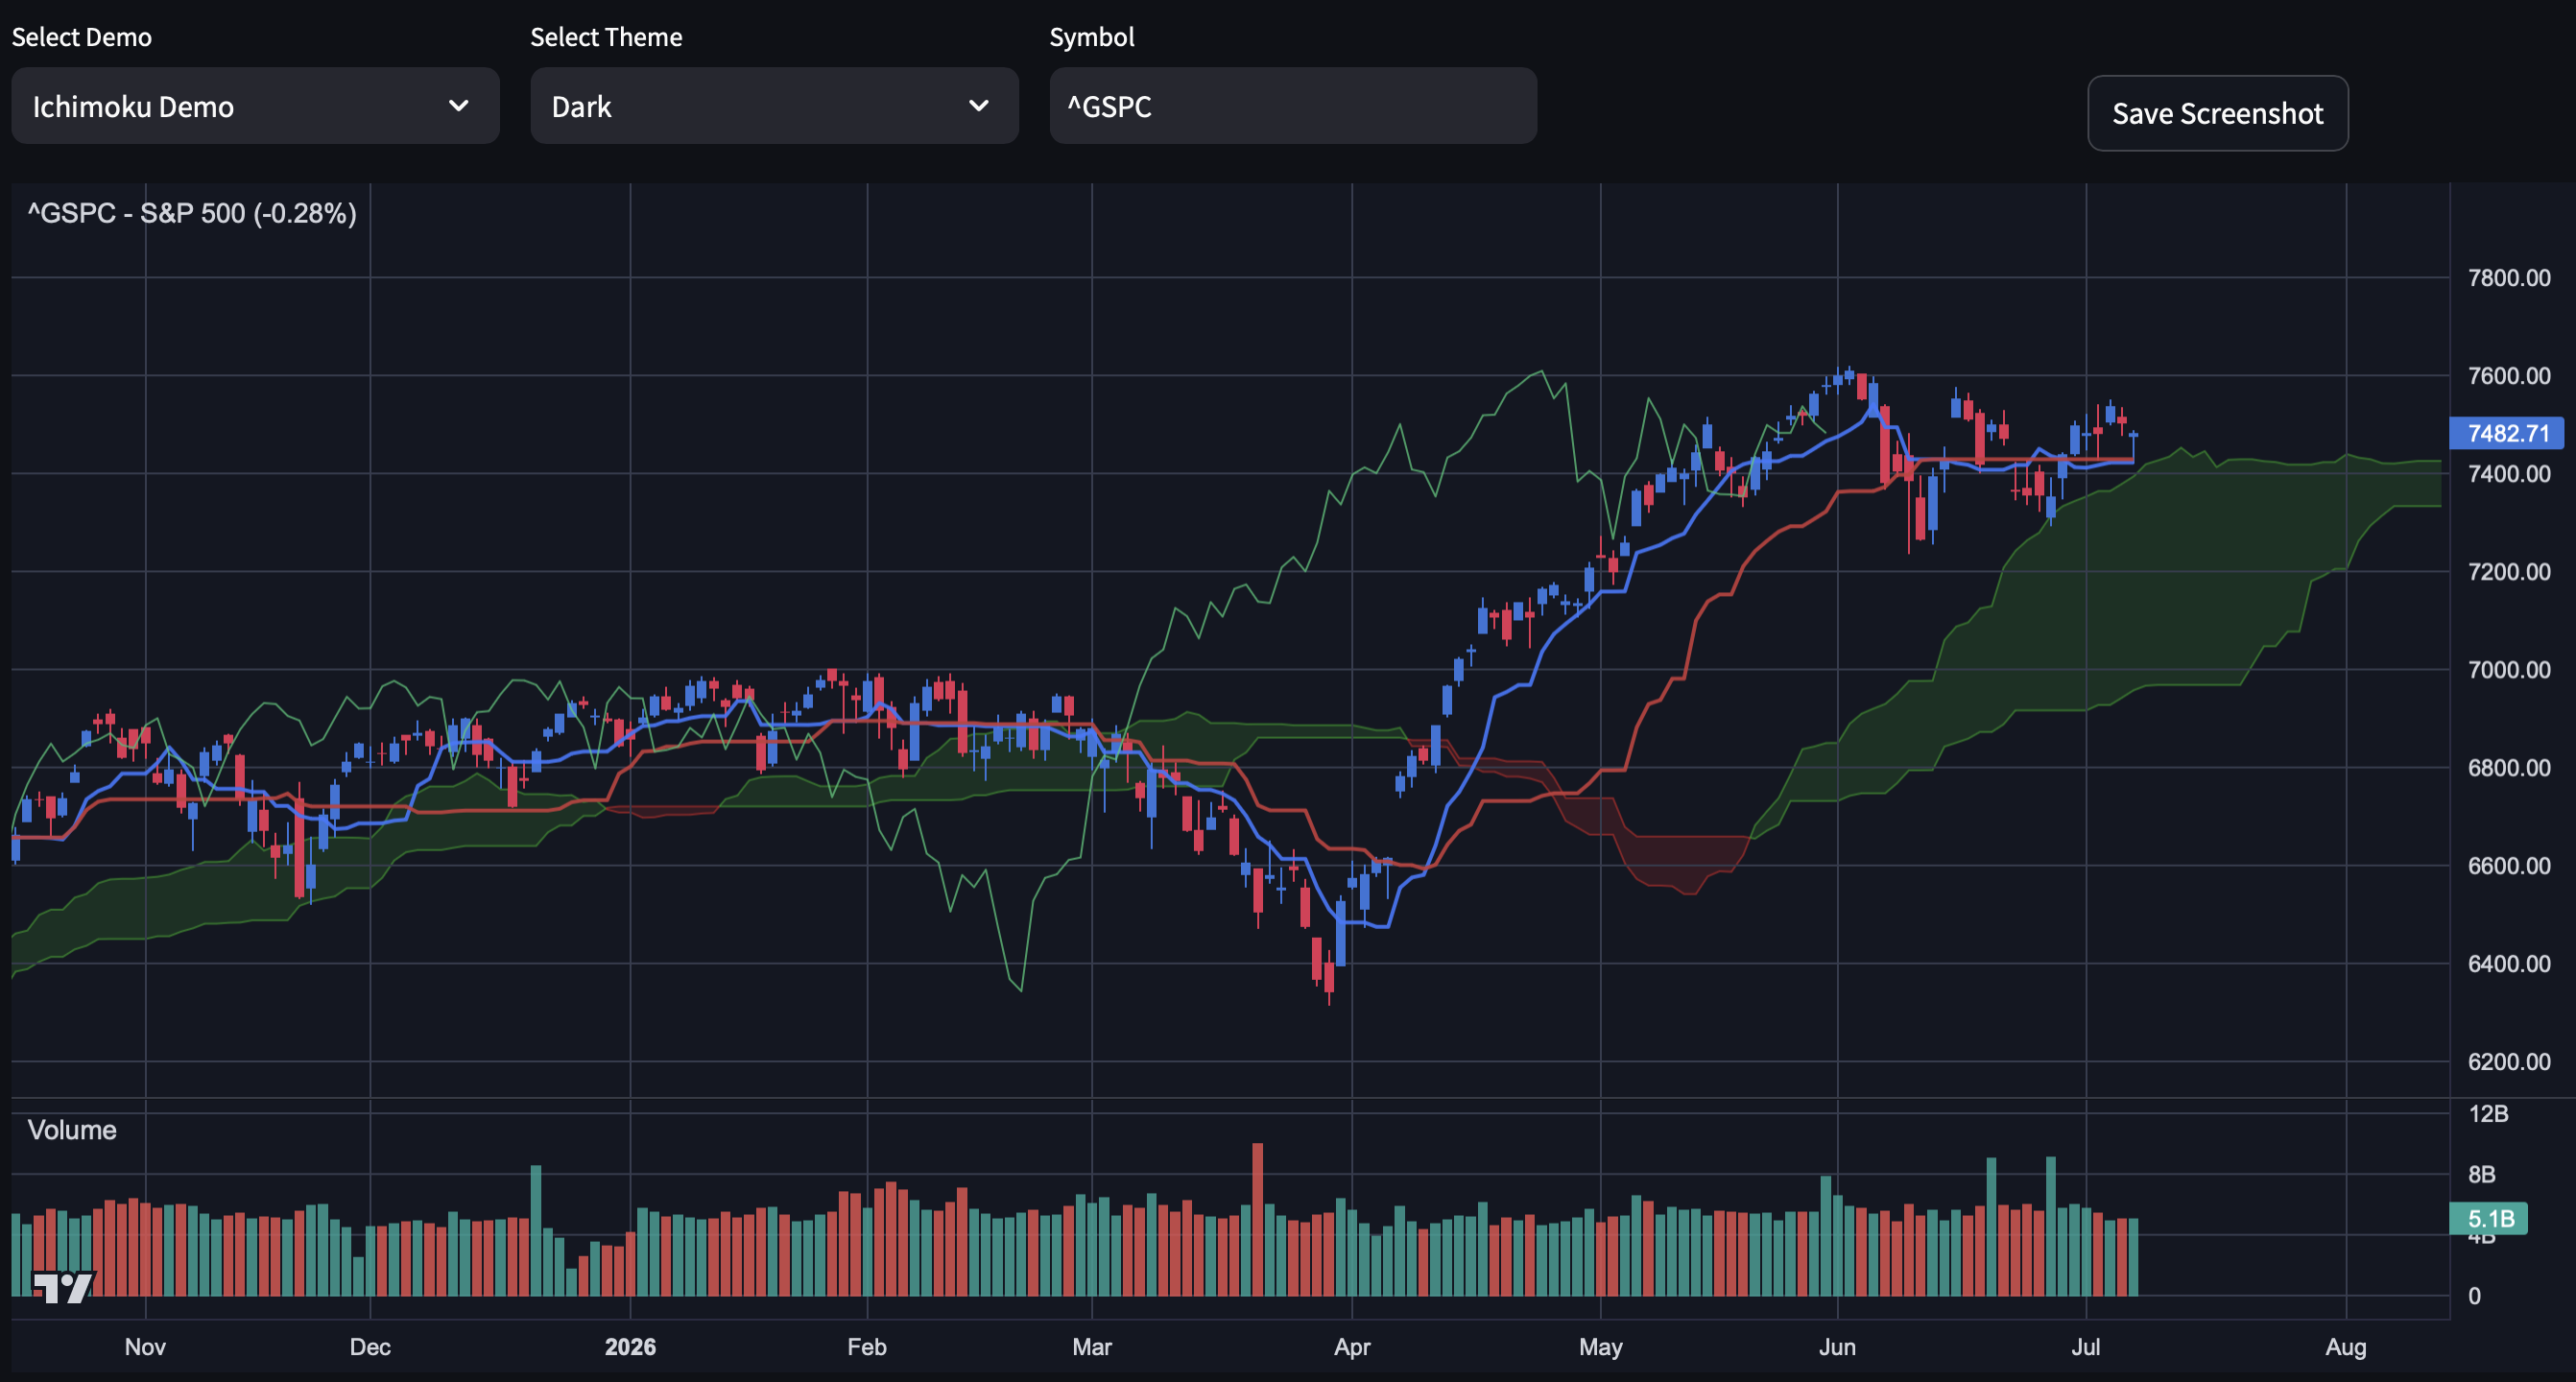
- Ichimoku Cloud overlay with regime-colored kumo fill between the Senkou spans
- Yield curve charts
- Supports Screenshots
Installation
python3 -m venv venv
source venv/bin/activate
pip install streamlit-lightweight-charts-v5
pip install yfinance>=1.0  # Required: v1.0+ to avoid rate limiting
Note: yfinance 1.0 or higher is required to avoid running into Yahoo Finance API rate limiting issues when running the demos.
Quick Start
import streamlit as st
from lightweight_charts_v5 import lightweight_charts_v5_component
import yfinance as yf

# Load stock data
ticker = "AAPL"
data = yf.download(ticker, period="100d", interval="1d", auto_adjust=False)

# Convert data to Lightweight Charts format, ensuring values are proper floats
chart_data = [
    {"time": str(date.date()), "value": float(row["Close"])}
    for date, row in data.iterrows()
]

# Streamlit app
st.title(f"{ticker} Stock Price Line Chart")

# Render the chart
lightweight_charts_v5_component(
    name=f"{ticker} Chart",
    charts=[{
        "chart": {"layout": {"background": {"color": "#FFFFFF"}}},
        "series": [{
            "type": "Line",
            "data": chart_data,
            "options": {"color": "#2962FF"}
        }],
        "height": 400
    }],
    height=400
)
Demos
The repository includes a demo/ directory with two example scripts that showcase how to use the component.
minimal_demo.py: A minimal example using Yahoo Finance stock datachart_demo.py: A slightly more advanced example with multiple indicators. Includes StockChart, Volume Profile, Ichimoku, Yield Curve, and Multi-Chart demos via a dropdown selectorvolume_profile_demo.py: Volume profile overlay with configurable pivot detection, price bins, and value areaichimoku_demo.py: Ichimoku Cloud overlay with the kumo filled between the forward-displaced Senkou spans, colored green/red by regimechart_themes.py: Theme customization examples for the chart_demo module.indicators.py: Example indicators for the chart_demo module.yield_curve.py: Yield curve example chart for the chart_demo module.
You can find the demo files in the GitHub repository.
Running the Demo Applications
To test the two demo scripts, run them using Streamlit:
streamlit run demo/minimal_demo.py          # Minimal example
streamlit run demo/chart_demo.py            # Full demo with indicators
streamlit run demo/volume_profile_demo.py   # Volume profile overlay demo
streamlit run demo/ichimoku_demo.py         # Ichimoku Cloud overlay demo
License
This project is licensed under the MIT License.
1 maintainer

Metadata
1 maintainer
Release files for streamlit-lightweight-charts-v5 0.2.0
For a detailed explanation of source distributions (sdists) and built distributions (wheels), please see the package formats documentation.
Source distribution (sdist)
| File | Size | Uploaded | |
|---|---|---|---|
| streamlit_lightweight_charts_v5-0.2.0.tar.gz | 232.7 kB | Details |
Built distribution (wheel)
| File | Interpreter | ABI | Platform | Reset |
|---|---|---|---|---|
| streamlit_lightweight_charts_v5-0.2.0-py3-none-any.whl | Python 3 | none | any | Details |
Total release size: 413.5 kB
Release files / streamlit_lightweight_charts_v5-0.2.0.tar.gz
| Download URL | streamlit_lightweight_charts_v5-0.2.0.tar.gz |
|---|---|
| Size | 232.7 kB |
| Tags | Source |
|
SHA-256 checksum How to use checksums |
85448ef45420383c26bd20a33535d1d24798e5efff63fef035192d537f350d13
|
|
BLAKE2b-256 checksum How to use checksums |
7001e73a530e166dd03148159cecb7088dda99037633998057a530ba13ceded6
|
| Upload date | |
|
Uploaded using Trusted Publishing? What is trusted publishing? |
Yes |
| Uploaded via |
twine/6.1.0 CPython/3.13.12
|
Provenance
Provenance describes where a file came from. On PyPI, provenance is shared via attestations, which provide a verifiable record of the build or publishing details. View details, limitations and caveats.


PyPI Publish Attestation
PyPI verified that this artifact, at this checksum, originated from the publisher listed below.
Signed by GitHub Actions, verified by PyPI on Jul 9, 2026.
Transparency logRelease files / streamlit_lightweight_charts_v5-0.2.0-py3-none-any.whl
| Download URL | streamlit_lightweight_charts_v5-0.2.0-py3-none-any.whl |
|---|---|
| Size | 180.8 kB |
| Tags | Python 3 |
|
SHA-256 checksum How to use checksums |
17ee736d00bdeb6d5fe672cd9edc62ee03840b7ed0189837ec4b0914b2589d6a
|
|
BLAKE2b-256 checksum How to use checksums |
1263384d473e448b2966b410b0ff16d49c3e7400f3d1f422807d2d6914abbb78
|
| Upload date | |
|
Uploaded using Trusted Publishing? What is trusted publishing? |
Yes |
| Uploaded via |
twine/6.1.0 CPython/3.13.12
|
Provenance
Provenance describes where a file came from. On PyPI, provenance is shared via attestations, which provide a verifiable record of the build or publishing details. View details, limitations and caveats.
PyPI Publish Attestation
PyPI verified that this artifact, at this checksum, originated from the publisher listed below.
Signed by GitHub Actions, verified by PyPI on Jul 9, 2026.
Transparency log













