
streamlit-node-editor
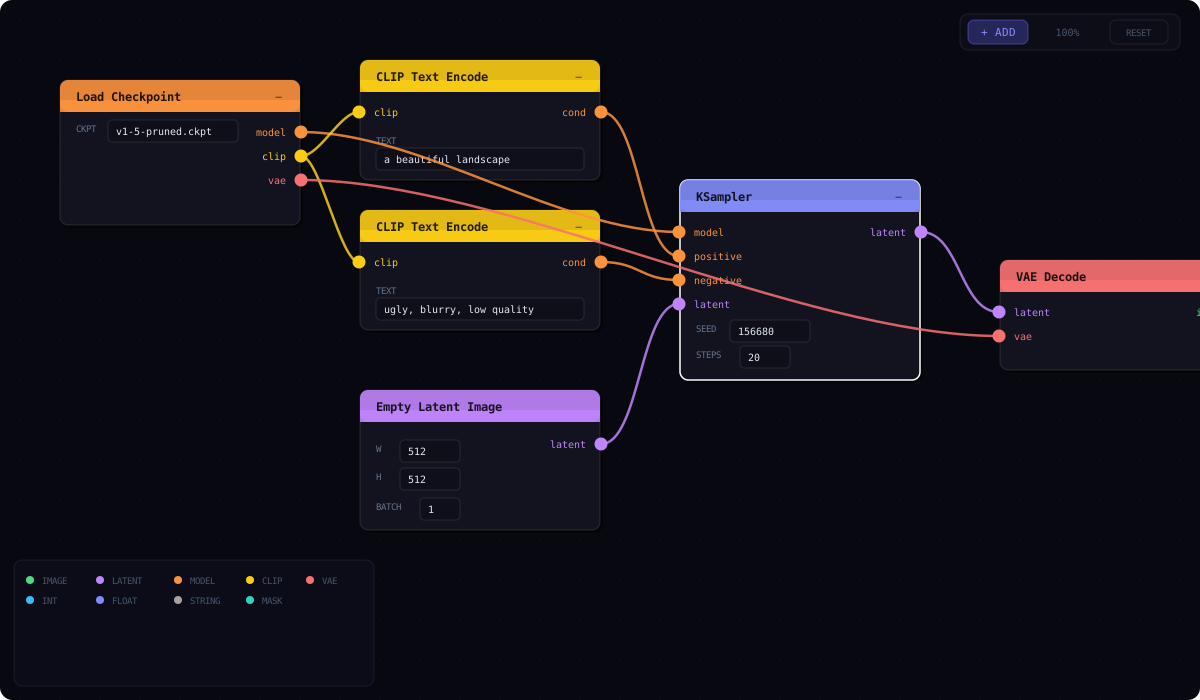
A ComfyUI / Unreal Blueprints-style node graph editor for Streamlit



streamlit-node-editor is a fully interactive node graph editor that runs inside any Streamlit application. Define typed node types in Python, let users build graphs by dragging ports and connecting wires, and get the full graph state back as structured JSON — all with zero runtime dependencies beyond Streamlit (no React Flow, no external graph library).
Features
Node Graph
- Typed ports — color-coded input/output ports with data type labels; only compatible types can connect
- Drag-to-wire — click an output port, drag, and drop on a compatible input to create a connection
- Type validation — incompatible connections are silently rejected, preventing invalid graphs
- Animated wires — smooth bezier curves with flowing-dot animation connect ports visually
Node Interaction
- Inline parameters — select dropdowns, number inputs, text inputs, and textareas rendered inside each node body
- Drag to move — reposition nodes freely on the canvas
- Collapse nodes — minimize nodes to save canvas space while preserving connections
- Delete / Backspace — removes the selected node and all its connections
- Click wire to delete — remove connections without any menu
Canvas
- Pan + scroll-to-zoom — navigate large graphs with proper SVG coordinate transforms
- Animated dot-grid background — subtle grid for spatial reference
- Configurable height — set canvas height in pixels via the
heightparameter
Node Palette
- Searchable palette — filterable list of all registered node types grouped by category
- Right-click or toolbar — open the palette from the canvas context menu or the toolbar button
- Category grouping — nodes organized by their
categoryfield
Dark Theme
- Consistent dark UI with color-coded node headers
- Glass-morphism panels with subtle borders
- Designed to match Streamlit's dark mode
Installation
pip install streamlit-node-editor
Quick Start — Data Pipeline Builder
import streamlit as st
from streamlit_node_editor import st_node_editor

NODE_DEFS = {
    "CSV Source": {
        "category": "Sources",
        "headerColor": "#4ade80",
        "inputs": [],
        "outputs": [{"name": "dataframe", "type": "DATAFRAME"}],
        "params": [
            {"key": "path", "label": "File path", "type": "string", "default": "data.csv"},
            {"key": "sep",  "label": "Separator", "type": "string", "default": ","},
        ],
    },
    "Filter Rows": {
        "category": "Transform",
        "headerColor": "#38bdf8",
        "inputs":  [{"name": "df_in",  "type": "DATAFRAME"}],
        "outputs": [{"name": "df_out", "type": "DATAFRAME"}],
        "params": [
            {"key": "query", "label": "Query expr", "type": "string", "default": "value > 0"},
        ],
    },
    "Group By": {
        "category": "Transform",
        "headerColor": "#818cf8",
        "inputs":  [{"name": "df_in",  "type": "DATAFRAME"}],
        "outputs": [{"name": "df_out", "type": "DATAFRAME"}],
        "params": [
            {"key": "column", "label": "Column",    "type": "string"},
            {"key": "agg",    "label": "Aggregate", "type": "select",
             "options": ["sum", "mean", "count", "min", "max"]},
        ],
    },
    "Bar Chart": {
        "category": "Outputs",
        "headerColor": "#fb923c",
        "inputs":  [{"name": "dataframe", "type": "DATAFRAME"}],
        "outputs": [],
        "params": [
            {"key": "x", "label": "X column", "type": "string"},
            {"key": "y", "label": "Y column", "type": "string"},
        ],
    },
}

graph = st_node_editor(NODE_DEFS, height=600, key="pipeline")

if graph:
    st.subheader("Graph state")
    st.json(graph)
API Reference
st_node_editor
st_node_editor(
    node_defs: dict[str, dict],
    initial_nodes: list[dict] | None = None,
    initial_connections: list[dict] | None = None,
    height: int = 700,
    key: str | None = None,
) -> dict | None
Parameters
| Parameter | Type | Default | Description |
|---|---|---|---|
node_defs |
dict[str, dict] |
required | Node type registry. Keys are node type names, values are definition dicts. See schema below. |
initial_nodes |
list[dict] or None |
[] |
Pre-placed nodes on the canvas. |
initial_connections |
list[dict] or None |
[] |
Pre-existing wire connections. |
height |
int |
700 |
Canvas height in pixels. |
key |
str or None |
None |
An optional key that uniquely identifies this component. Required when placing multiple editors on one page. |
Return Value
Returns a dict with the full graph state after any interaction, or None before any interaction.
{
    "nodes": [
        {
            "id":     str,                # unique node ID
            "type":   str,                # node type name (key from node_defs)
            "x":      float,              # canvas X position
            "y":      float,              # canvas Y position
            "params": {key: value, ...},  # current parameter values
        },
        ...
    ],
    "connections": [
        {
            "id":       str,   # unique connection ID
            "fromNode": str,   # source node ID
            "fromPort": int,   # output port index (0-based)
            "toNode":   str,   # target node ID
            "toPort":   int,   # input port index (0-based)
        },
        ...
    ]
}
Data Structures
Node Definition
"Node Type Name": {
    "category":    str,          # palette grouping (e.g. "Sources", "Transform")
    "headerColor": str,          # hex color for the node's title bar
    "inputs": [
        {"name": str, "type": str}   # typed input ports
    ],
    "outputs": [
        {"name": str, "type": str}   # typed output ports
    ],
    "params": [
        {
            "key":     str,          # parameter key (returned in node params)
            "label":   str,          # display label inside the node
            "type":    str,          # "int" | "float" | "string" | "select" | "textarea"
            "default": any,          # optional default value
            "options": list[str],    # required when type == "select"
        }
    ],
}
Built-in Port Types
| Type | Color | Typical Use |
|---|---|---|
IMAGE |
green | Pixel data |
LATENT |
purple | Latent tensors |
MODEL |
orange | Neural network weights |
CLIP |
yellow | Text encoders |
VAE |
red | Variational autoencoders |
INT |
blue | Integer values |
FLOAT |
indigo | Float values |
STRING |
stone | Text data |
MASK |
teal | Binary masks |
ANY |
gray | Accepts any type |
Define your own types freely in node_defs — any unrecognized type string uses the ANY gray color.
Usage Examples
Pre-placing Nodes and Connections
graph = st_node_editor(
    NODE_DEFS,
    initial_nodes=[
        {"id": "n1", "type": "CSV Source",  "x": 50,  "y": 100,
         "params": {"path": "sales.csv", "sep": ","}},
        {"id": "n2", "type": "Filter Rows", "x": 350, "y": 100,
         "params": {"query": "revenue > 1000"}},
        {"id": "n3", "type": "Bar Chart",   "x": 650, "y": 100,
         "params": {"x": "month", "y": "revenue"}},
    ],
    initial_connections=[
        {"id": "w1", "fromNode": "n1", "fromPort": 0, "toNode": "n2", "toPort": 0},
        {"id": "w2", "fromNode": "n2", "fromPort": 0, "toNode": "n3", "toPort": 0},
    ],
    height=600,
    key="pipeline",
)
Executing a Pipeline from the Graph
graph = st_node_editor(NODE_DEFS, key="pipeline")

if graph and st.button("Run Pipeline"):
    nodes_by_id = {n["id"]: n for n in graph["nodes"]}

    for node in graph["nodes"]:
        node_type = node["type"]
        params = node["params"]

        if node_type == "CSV Source":
            st.info(f"Loading {params.get('path', 'data.csv')}")
        elif node_type == "Filter Rows":
            st.info(f"Filtering: {params.get('query', '')}")
        elif node_type == "Bar Chart":
            st.info(f"Charting {params.get('x')} vs {params.get('y')}")

    st.success(f"Executed {len(graph['nodes'])} nodes with {len(graph['connections'])} connections")
Image Processing Workflow
IMAGE_NODES = {
    "Load Image": {
        "category": "Input",
        "headerColor": "#4ade80",
        "inputs": [],
        "outputs": [{"name": "image", "type": "IMAGE"}],
        "params": [
            {"key": "path", "label": "Image path", "type": "string", "default": "photo.jpg"},
        ],
    },
    "Resize": {
        "category": "Transform",
        "headerColor": "#38bdf8",
        "inputs":  [{"name": "image", "type": "IMAGE"}],
        "outputs": [{"name": "image", "type": "IMAGE"}],
        "params": [
            {"key": "width",  "label": "Width",  "type": "int", "default": 512},
            {"key": "height", "label": "Height", "type": "int", "default": 512},
        ],
    },
    "Blur": {
        "category": "Effects",
        "headerColor": "#a78bfa",
        "inputs":  [{"name": "image", "type": "IMAGE"}],
        "outputs": [{"name": "image", "type": "IMAGE"}],
        "params": [
            {"key": "radius", "label": "Radius", "type": "float", "default": 2.0},
        ],
    },
    "Save Image": {
        "category": "Output",
        "headerColor": "#fb923c",
        "inputs":  [{"name": "image", "type": "IMAGE"}],
        "outputs": [],
        "params": [
            {"key": "path",   "label": "Output path", "type": "string", "default": "output.png"},
            {"key": "format", "label": "Format",      "type": "select",
             "options": ["PNG", "JPEG", "WEBP"]},
        ],
    },
}

graph = st_node_editor(IMAGE_NODES, height=500, key="image_pipeline")
Architecture
The component is built with React 18 communicating with Streamlit via the bidirectional component API (streamlit-component-lib). All rendering uses inline SVG for wires and standard HTML/CSS for nodes.
┌──────────────────────────────────────────────────────────┐
│  Python (Streamlit)                                      │
│  st_node_editor(node_defs, initial_nodes, …, key)        │
│       ↓ args                   ↑ componentValue          │
├──────────────────────────────────────────────────────────┤
│  React Frontend (iframe)                                 │
│  ┌────────────────────────────────────────────────────┐  │
│  │  Toolbar: Add Node · Delete · Zoom · Fit           │  │
│  ├─────────┬──────────────────────────────────────────┤  │
│  │ Palette │  Canvas (pan + zoom)                     │  │
│  │         │  ┌──────────┐     ┌──────────┐           │  │
│  │ Sources │  │ CSV Source│────→│Filter    │           │  │
│  │ ├─CSV   │  │ path: .. │     │ query: ..│           │  │
│  │ ├─API   │  └──────────┘     └────┬─────┘           │  │
│  │         │                        │                 │  │
│  │ Transf. │               ┌────────▼──────┐          │  │
│  │ ├─Filter│               │  Bar Chart    │          │  │
│  │ ├─Group │               │  x: ..  y: .. │          │  │
│  │         │               └───────────────┘          │  │
│  │ Outputs │                                          │  │
│  │ ├─Chart │  · · · · · · · · (dot grid) · · · · ·   │  │
│  └─────────┴──────────────────────────────────────────┘  │
└──────────────────────────────────────────────────────────┘
- Wire engine — SVG bezier curves with animated flowing dots; hit-test for click-to-delete
- Port system — typed ports with color mapping; connection validation runs on drop
- Node renderer — HTML div with color-coded header, inline param editors, and port circles
- Pan / zoom — CSS transform on the canvas container with scroll-wheel zoom
- State sync — every node move, add, delete, or connection change calls
Streamlit.setComponentValue()with the full graph
Browser Compatibility
| Browser | Status |
|---|---|
| Chrome / Edge 90+ | ✅ Full support |
| Firefox 90+ | ✅ Full support |
| Safari 15+ | ✅ Full support |
| Mobile browsers | ⚠️ Touch drag may vary |
Requirements
- Python 3.8+
- Streamlit ≥ 1.28.0
License
MIT — see LICENSE for details.
Links
1 maintainer

Metadata
1 maintainer
Release files for streamlit-node-editor 0.3.2
For a detailed explanation of source distributions (sdists) and built distributions (wheels), please see the package formats documentation.
Source distribution (sdist)
| File | Size | Uploaded | |
|---|---|---|---|
| streamlit_node_editor-0.3.2.tar.gz | 421.7 kB | Details |
Built distribution (wheel)
| File | Interpreter | ABI | Platform | Reset |
|---|---|---|---|---|
| streamlit_node_editor-0.3.2-py3-none-any.whl | Python 3 | none | any | Details |
Total release size: 842.6 kB
Release files / streamlit_node_editor-0.3.2.tar.gz
| Download URL | streamlit_node_editor-0.3.2.tar.gz |
|---|---|
| Size | 421.7 kB |
| Tags | Source |
|
SHA-256 checksum How to use checksums |
943e82018ce255869b48972406c08039b55a93c90e23c972cb78cd3ed3882cf5
|
|
BLAKE2b-256 checksum How to use checksums |
fe38155362790e0b48115b2356c6e3e9281335d516ac5be4686b88804304c8d6
|
| Upload date | |
|
Uploaded using Trusted Publishing? What is trusted publishing? |
No |
| Uploaded via |
twine/6.2.0 CPython/3.11.9
|
Release files / streamlit_node_editor-0.3.2-py3-none-any.whl
| Download URL | streamlit_node_editor-0.3.2-py3-none-any.whl |
|---|---|
| Size | 420.9 kB |
| Tags | Python 3 |
|
SHA-256 checksum How to use checksums |
57422669511cd4c595df85de0343935fae407de6ceb1519b582f227f5cd144ad
|
|
BLAKE2b-256 checksum How to use checksums |
7836f24e763330487995f9762eba9908b7c59c6210d2815cd4c99f1317369d00
|
| Upload date | |
|
Uploaded using Trusted Publishing? What is trusted publishing? |
No |
| Uploaded via |
twine/6.2.0 CPython/3.11.9
|














