
subplots_from_axsize
This package provides a single function, subplots_from_axsize(), which is based on matplotlib's subplots() and adjust_subplots() functions, but:
figsizeis replaced byaxsizeleft,bottom,right,topuse inches instead of fractionswspace,hspaceuse inches instead of fractionsaxsize,wspace,hspacecan take lists as arguments (see example #2 below)
rationale
Specifying sizes directly makes it easier to achieve consistent ax sizes across figures. Suppose you're plotting various time series data and you would like consistent inches / week on your x axis. Or you carefully crafted your figures but suddenly you need a little extra space for you labels. Or you would want to move the axes a little bit apart and not rescale everything else in the whole world simultaneously.
getting started
The package is available on PyPi.
example #1
import matplotlib.pyplot as plt
from subplots_from_axsize import subplots_from_axsize

fig, ax = subplots_from_axsize(
    axsize=(4, 3),
    left=0.9, bottom=0.5, top=0.3, right=0.2,
)

ax.set_xlabel('x label')
ax.set_ylabel('y label\nbut much\nmuch longer')
ax.set_title('important!')
fig.patch.set_facecolor('#ffbbff')
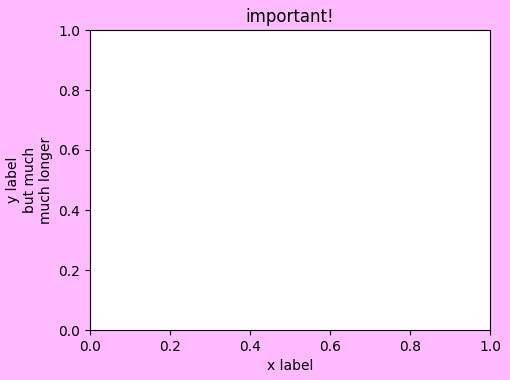
Since the default dpi in matplotlib is 100, the axis is exactly 400 by 300 pixels. The left margin, for example, is 0.9 × 100 = 90 pixels. Changing the margins does not change the axis size (you have my promise).
example #2
Additionally, subplots_from_axsize makes it easy to create multiple axes.
import matplotlib.pyplot as plt
from subplots_from_axsize import subplots_from_axsize

fig, axs = subplots_from_axsize(
    axsize=([1, 3], 1),
    hspace=[0.5, 1.0],
    left=0.4, bottom=0.3,
)
fig.patch.set_facecolor('#ffbbff')
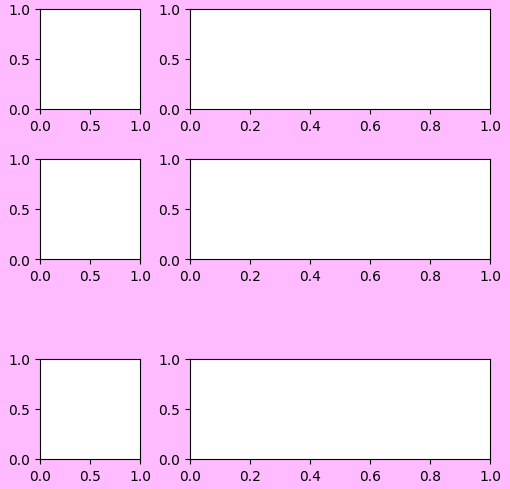
The number of columns (or rows) is inferred automatically based on three arguments: nrows (if given), length of axsize[0] (if it is a list), length of wspace + 1 (if it is a list). If none of the conditions is met, the default is 1. If they disagree you get an error (xor create an Issue).
1 maintainer

Metadata
1 maintainer
Release files for subplots-from-axsize 0.1.9
For a detailed explanation of source distributions (sdists) and built distributions (wheels), please see the package formats documentation.
Source distribution (sdist)
| File | Size | Uploaded | |
|---|---|---|---|
| subplots_from_axsize-0.1.9.tar.gz | 4.8 kB | Details |
Built distribution (wheel)
| File | Interpreter | ABI | Platform | Reset |
|---|---|---|---|---|
| subplots_from_axsize-0.1.9-py3-none-any.whl | Python 3 | none | any | Details |
Total release size: 10.4 kB
Release files / subplots_from_axsize-0.1.9.tar.gz
| Download URL | subplots_from_axsize-0.1.9.tar.gz |
|---|---|
| Size | 4.8 kB |
| Tags | Source |
|
SHA-256 checksum How to use checksums |
e2e1cd94fba7c604957bd50e11cde5313e0cb7493d2108fe96b095a15ac535d8
|
|
BLAKE2b-256 checksum How to use checksums |
fb8d43c4622ead1ea8370bfcf9cc54546aa25df7ca595e18bf3d204dc7705503
|
| Upload date | |
|
Uploaded using Trusted Publishing? What is trusted publishing? |
No |
| Uploaded via |
poetry/1.5.1 CPython/3.11.5 Linux/6.5.7-arch1-1
|
Release files / subplots_from_axsize-0.1.9-py3-none-any.whl
| Download URL | subplots_from_axsize-0.1.9-py3-none-any.whl |
|---|---|
| Size | 5.5 kB |
| Tags | Python 3 |
|
SHA-256 checksum How to use checksums |
e6771d0b13ddfe0404a1c281e986bce2c0eb1a0e3b672c9ac277fac6bae8765c
|
|
BLAKE2b-256 checksum How to use checksums |
01cb0fb8167e34bae4c2e5b0b819e7f0f4b5a37de31179bc0a88c75d738b09a4
|
| Upload date | |
|
Uploaded using Trusted Publishing? What is trusted publishing? |
No |
| Uploaded via |
poetry/1.5.1 CPython/3.11.5 Linux/6.5.7-arch1-1
|














