
survival_analysis_tools
Kaplan–Meier plotting and Cox HR helpers for survival analysis workflows.
Install
pip install survival_analysis_tools
Usage
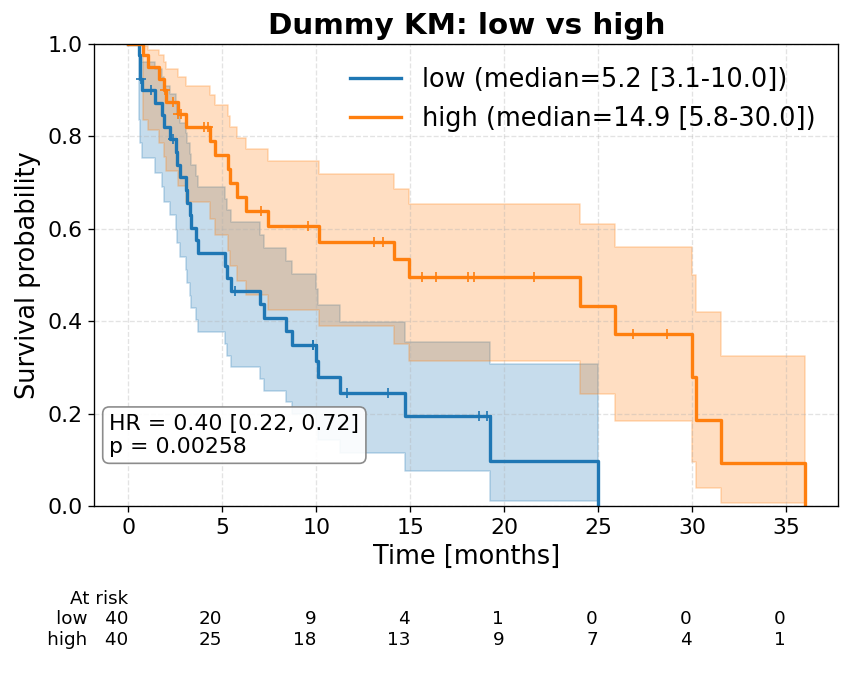
Example from tests/test_plot_km.ipynb:
import numpy as np
import pandas as pd

from survival_analysis_tools import plot_km

# Dummy survival data: two groups with different survival patterns
rng = np.random.default_rng(42)
n_per_group = 40

control = pd.DataFrame({
    "survival": rng.exponential(scale=8, size=n_per_group).clip(0.5, 36),
    "event": rng.binomial(1, 0.7, size=n_per_group),
    "treatment": "control",
})
treated = pd.DataFrame({
    "survival": rng.exponential(scale=14, size=n_per_group).clip(0.5, 36),
    "event": rng.binomial(1, 0.55, size=n_per_group),
    "treatment": "treated",
})

df = pd.concat([control, treated], ignore_index=True)
df.head()
    survival  event treatment
0  19.233669      1   control
1  18.689517      0   control
2  19.078088      0   control
3   2.238354      1   control
4   0.691499      0   control
summary, hr, pval = plot_km(
    df,
    time_col="survival",
    event_col="event",
    group_col="treatment",
    group_order=["control", "treated"],
    title="Dummy KM: control vs treated",
    font_scale = 1.1,

    # default parameters:
    xlabel='Time [months]',
    ylabel="Survival probability",
    plot_height=5,
    xlim=False,
    flip_legend_order=False,

    show_censors=True,
    show_ci=True,
    show_at_risk=True,
    show_stats=True,

    weights_col=None,
    cluster_col=None
)
Parameters
plot_km plots Kaplan–Meier curves grouped by group_col. If group_col is None, it plots KM for all data.
Returns a DataFrame with columns: group_name, n, median, median_ci_low, median_ci_high (plus HR and p-value).
| Parameter | Type | Description |
|---|---|---|
df |
pd.DataFrame |
Dataframe containing the survival data. |
time_col |
str |
Column for durations (float). |
event_col |
str |
Column for event indicators (bool). |
group_col |
str or None |
Column for group assignment (str) (if None, all data is treated as one group). |
group_order |
list, optional |
List controlling the plotting order for groups. |
show_censors |
bool |
Show censors (default True). |
show_ci |
bool |
Show confidence intervals. |
show_at_risk |
bool |
Add at-risk counts table. |
show_stats |
bool |
Whether to show HR/p-value on plot. |
xlabel, ylabel, title |
str |
Plot labels. |
font_scale |
float |
Font scaling. |
plot_height |
float |
Figure height. |
xlim |
float or False |
X-axis upper bound. |
flip_legend_order |
bool |
If True, reverse the legend order. |
weights_col |
str or None |
Optional column of weights (float) to use in fitting KM curves, Cox model, and logrank test. |
Development
pip install -e ".[dev]"
python -m pytest
python -m build
Publishing
See PUBLISHING.md for TestPyPI and production PyPI upload steps with twine.
1 maintainer

Metadata
1 maintainer
Release files for survival-analysis-tools 0.1.7
For a detailed explanation of source distributions (sdists) and built distributions (wheels), please see the package formats documentation.
Source distribution (sdist)
| File | Size | Uploaded | Provenance | Actions |
|---|---|---|---|---|
| survival_analysis_tools-0.1.7.tar.gz | 7.9 kB | Without provenance | Details for survival_analysis_tools-0.1.7.tar.gz |
Built distribution (wheel)
| File | Interpreter | ABI | Platform | Actions Reset |
|---|---|---|---|---|
| survival_analysis_tools-0.1.7-py3-none-any.whl | Python 3 | none | any | Details for survival_analysis_tools-0.1.7-py3-none-any.whl |
Total release size: 15.9 kB
Release files / survival_analysis_tools-0.1.7.tar.gz
| Download URL | survival_analysis_tools-0.1.7.tar.gz |
|---|---|
| Size | 7.9 kB |
| Tags | Source |
|
SHA-256 checksum How to use checksums |
c65f126e174d405cd0a1e430b0421573d7a301c6e0a2c838fd5e4e33722e5034
|
|
BLAKE2b-256 checksum How to use checksums |
e49d7580eb5453f336ebba075046bf72e73d26fda8c689f8ba8a05e812e01721
|
| Upload date | |
|
Uploaded using Trusted Publishing? What is trusted publishing? |
No |
| Uploaded via |
twine/6.2.0 CPython/3.11.9
|
Release files / survival_analysis_tools-0.1.7-py3-none-any.whl
| Download URL | survival_analysis_tools-0.1.7-py3-none-any.whl |
|---|---|
| Size | 7.9 kB |
| Tags | Python 3 |
|
SHA-256 checksum How to use checksums |
d975a5043c9eaeeb9d1fdbe16714496094214beefeeaf966bf0aa9b1f3e605f6
|
|
BLAKE2b-256 checksum How to use checksums |
6adb9b4ca0cb48939a0dc2cc2600b5287667e903e201fbbb0107d917f756b544
|
| Upload date | |
|
Uploaded using Trusted Publishing? What is trusted publishing? |
No |
| Uploaded via |
twine/6.2.0 CPython/3.11.9
|
Security for survival-analysis-tools 0.1.7
Provenance
Provenance describes where a file came from. On PyPI, provenance is shared via attestations, which provide a verifiable record of the build or publishing details. View details, limitations and caveats.
No provenance found
None of the files in this release were uploaded with provenance metadata.
A note on package security
PyPI is a repository for distributing packages, not a service for auditing them. While third-party security researchers and our staff do their best to detect and remove malicious packages, PyPI cannot guarantee the quality, security or suitability of any given package.
To learn more about protecting yourself from malicious actors, visit our package security documentation.













