svgdigitizer is a Python library and command line tool to recover the measured data underlying plots in scientific publications.


Project description

svgdigitizer


Extract (x,y) data points from SVG files
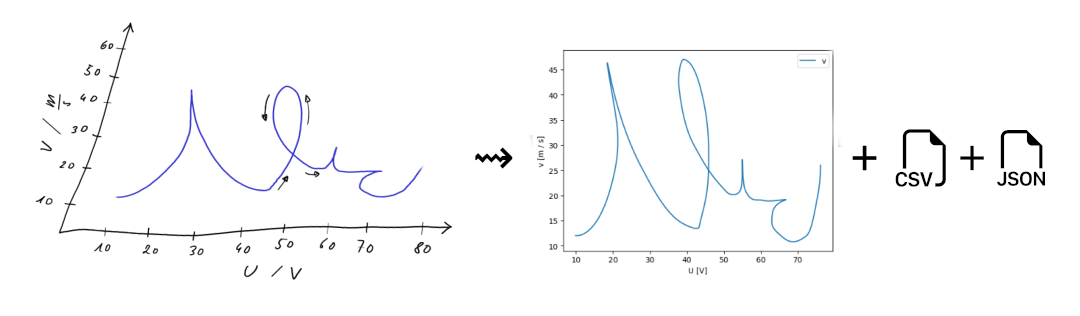
The svgdigitizer allows recovering data from a curve in a figure, plotted in a 2D coordinate system, which is usually found in scientific publications.
The data is accessible either with a command line interface or the API from a specifically prepared scaled vector graphics (SVG) file. The data can be stored as a frictionless datapackage (CSV and JSON) which can be used with unitpackage to access the plots metadata or create a database of such datapackages.
Features
The svgdigitizer has additional features compared to other plot digitizers, such as:
- supports multiple y (x) values per x (y) value
- usage of splines allows for very precise retracing of distinct features
- splines can be digitized with specific sampling intervals
- supports plots with distorted/skewed axis
- extracts units from axis labels
- reconstruct time series with a given scan rate
- supports scale bars
- supports scaling factors
- extracts metadata associated with the plot in the SVG
- saves data as frictionless datapackage (CSV + JSON) allowing for FAIR data usage
- inclusion of metadata in the datapackage
- Python API to interact with the retraced data
Refer to our documentation for more details.
Installation
This package is available on PyPI and can be installed with pip:
pip install svgdigitizer
The package is also available on conda-forge and can be installed with conda
conda install -c conda-forge svgdigitizer
or mamba
mamba install -c conda-forge svgdigitizer
Please consult our documentation for more detailed installation instructions.
Command Line Interface
The CLI allows creating SVG files from PDFs and allows digitizing the processed SVG files. Certain plot types have specific commands to recover different kinds of metadata. Refer to the CLI documentation for more information.
$ svgdigitizer
Usage: svgdigitizer [OPTIONS] COMMAND [ARGS]...

  The svgdigitizer suite.

Options:
  --help  Show this message and exit.

Commands:
  cv        Digitize a cylic voltammogram and create a frictionless datapackage.
  digitize  Digitize a 2D plot.
  figure    Digitize a figure with units on the axis and create a frictionless datapackage.
  paginate  Render PDF pages as individual SVG files with linked PNG images.
  plot      Display a plot of the data traced in an SVG.

$ svgdigitizer figure doc/files/others/looping_scan_rate.svg --sampling-interval 0.01
API
You can also use the svgdigitizer package directly from Python, to access properties of the SVG or additional properties associated with the figure.
>>> from svgdigitizer.svg import SVG
>>> from svgdigitizer.svgplot import SVGPlot
>>> from svgdigitizer.svgfigure import SVGFigure


>>> figure = SVGFigure(SVGPlot(SVG(open('doc/files/others/looping.svg', 'rb')), sampling_interval=0.01))
Examples:
figure.df provides a dataframe of the digitized curve.
figure.plot() shows a plot of the digitized curve.
figure.metadadata provides a dict with metadata of the original plot, such as original units of the axis.
The svgdigitizer can be enhanced with submodules, which are designed to digitize specific plot types, such as the submodule electrochemistry.cv.
This submodule allows digitizing cyclic voltammograms commonly found in the field of electrochemistry.
>>> from svgdigitizer.svg import SVG
>>> from svgdigitizer.svgplot import SVGPlot
>>> from svgdigitizer.electrochemistry.cv import CV

>>> cv_svg = 'doc/files/mustermann_2021_svgdigitizer_1/mustermann_2021_svgdigitizer_1_f2a_blue.svg'
>>> cv = CV(SVGPlot(SVG(open(cv_svg, 'rb')), sampling_interval=0.01))
The resulting cv object has the same properties as the figure object above.
Release history Release notifications | RSS feed


Download files
Download the file for your platform. If you're not sure which to choose, learn more about installing packages.
Source Distribution
Built Distribution
Filter files by name, interpreter, ABI, and platform.
If you're not sure about the file name format, learn more about wheel file names.
Copy a direct link to the current filters
File details
Details for the file svgdigitizer-0.14.4.tar.gz.
File metadata
- Download URL: svgdigitizer-0.14.4.tar.gz
- Upload date:
- Size: 114.6 kB
- Tags: Source
- Uploaded using Trusted Publishing? No
- Uploaded via: twine/6.2.0 CPython/3.13.9
File hashes
| Algorithm | Hash digest | |
|---|---|---|
| SHA256 |
46a230957b9f9b2fbdd4484d12c0eaedbfc350c26df8a23986b9adefad34a962
|
|
| MD5 |
ddb2ee5d61825c771bc96d080afc64d4
|
|
| BLAKE2b-256 |
028b7a54e425226d2e7fc1fb28d7c5a1fae9b9b970663edb5b8ceda65b06580f
|
File details
Details for the file svgdigitizer-0.14.4-py3-none-any.whl.
File metadata
- Download URL: svgdigitizer-0.14.4-py3-none-any.whl
- Upload date:
- Size: 116.6 kB
- Tags: Python 3
- Uploaded using Trusted Publishing? No
- Uploaded via: twine/6.2.0 CPython/3.13.9
File hashes
| Algorithm | Hash digest | |
|---|---|---|
| SHA256 |
69be881fb084ce2ea3bd12fcbd63338385e04edd3c3ae3f73816f81d64cf07f2
|
|
| MD5 |
f6d799f5e4bd7730278e172fc353a78d
|
|
| BLAKE2b-256 |
2aebf617fe344f9e437d794ef4b14b35e8798d71013422760047aa7b0949ba9d
|


