
Publication-ready plotting library for ML papers

Project description
📄📊 Swizz




Swizz is a Python library for generating publication-ready visualizations, LaTeX tables, and subfigure layouts with minimal code and consistent style. Check out the live docs for examples and usage.
Built for AI/ML researchers, it's designed to make NeurIPS/ICLR/CVPR-style figures effortless — no more LaTeX hacks and style mismatches. Focus on your results, not your rendering.
If you use Swizz in your research, please consider citing it using:
@software{quaedvlieg2025swizz,
  author = {Quaedvlieg, Lars and Miele, Andrea},
  license = {MIT},
  month = apr,
  title = {{Swizz: Publication-ready plots and LaTeX tables for ML papers}},
  url = {https://github.com/lars-quaedvlieg/swizz},
  version = {0.1.0},
  year = {2025}
}
🚀 Features
- 🧾 Auto-generated LaTeX tables from your data
- 📊 One-liner plotting functions
- 🧩 Easy layout builders for stacked, grid, and subfigure formats
- 📚 Expanding Jupyter Book documentation with live examples
- 🎬 Manim animations for dynamic visualizations and function evolutions
- 📈 Weights & Biases integration for experiment tracking and analysis
📦 Installation
Via PyPi:
pip install swizz
By cloning the repository:
git clone git@github.com:lars-quaedvlieg/swizz.git swizz
cd swizz
pip install .
📁 Project Structure
| Module | Description |
|---|---|
swizz.table |
Table generators |
swizz.plot |
Plotting utilities built on Seaborn & Matplotlib |
swizz.layout |
Layout builders for stacked / side-by-side images |
swizz.manim |
Dynamic visualizations and animations |
swizz.logging |
Experiment tracking with Weights & Biases |
🧪 Examples
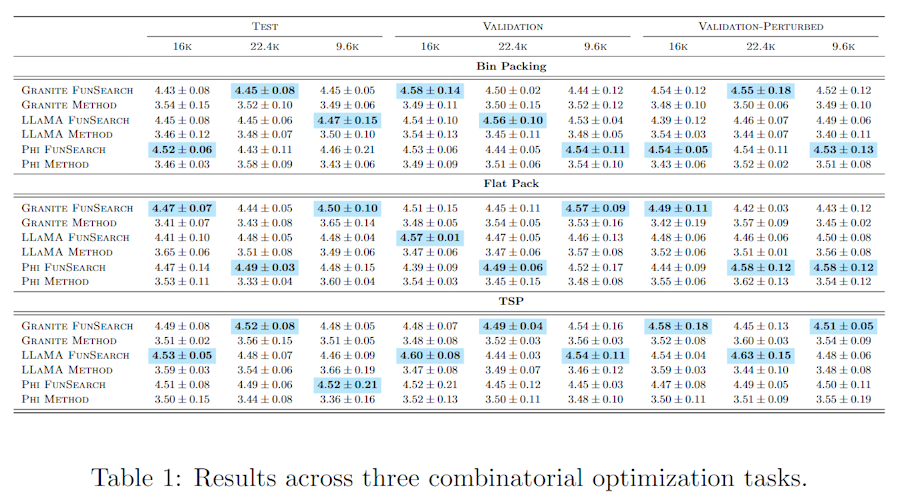
Multi-level table example:
from swizz.table import table

complex_df = ...

latex_string = table(
    "grouped_multicol_latex",
    df=complex_df,
    row_index="Model",
    col_index=["Split", "Budget"],
    groupby="Task",
    value_column="score",
    highlight="min",
    stderr=True,
    caption="Combinatorial optimization results",
    label="tab:combo_results"
)
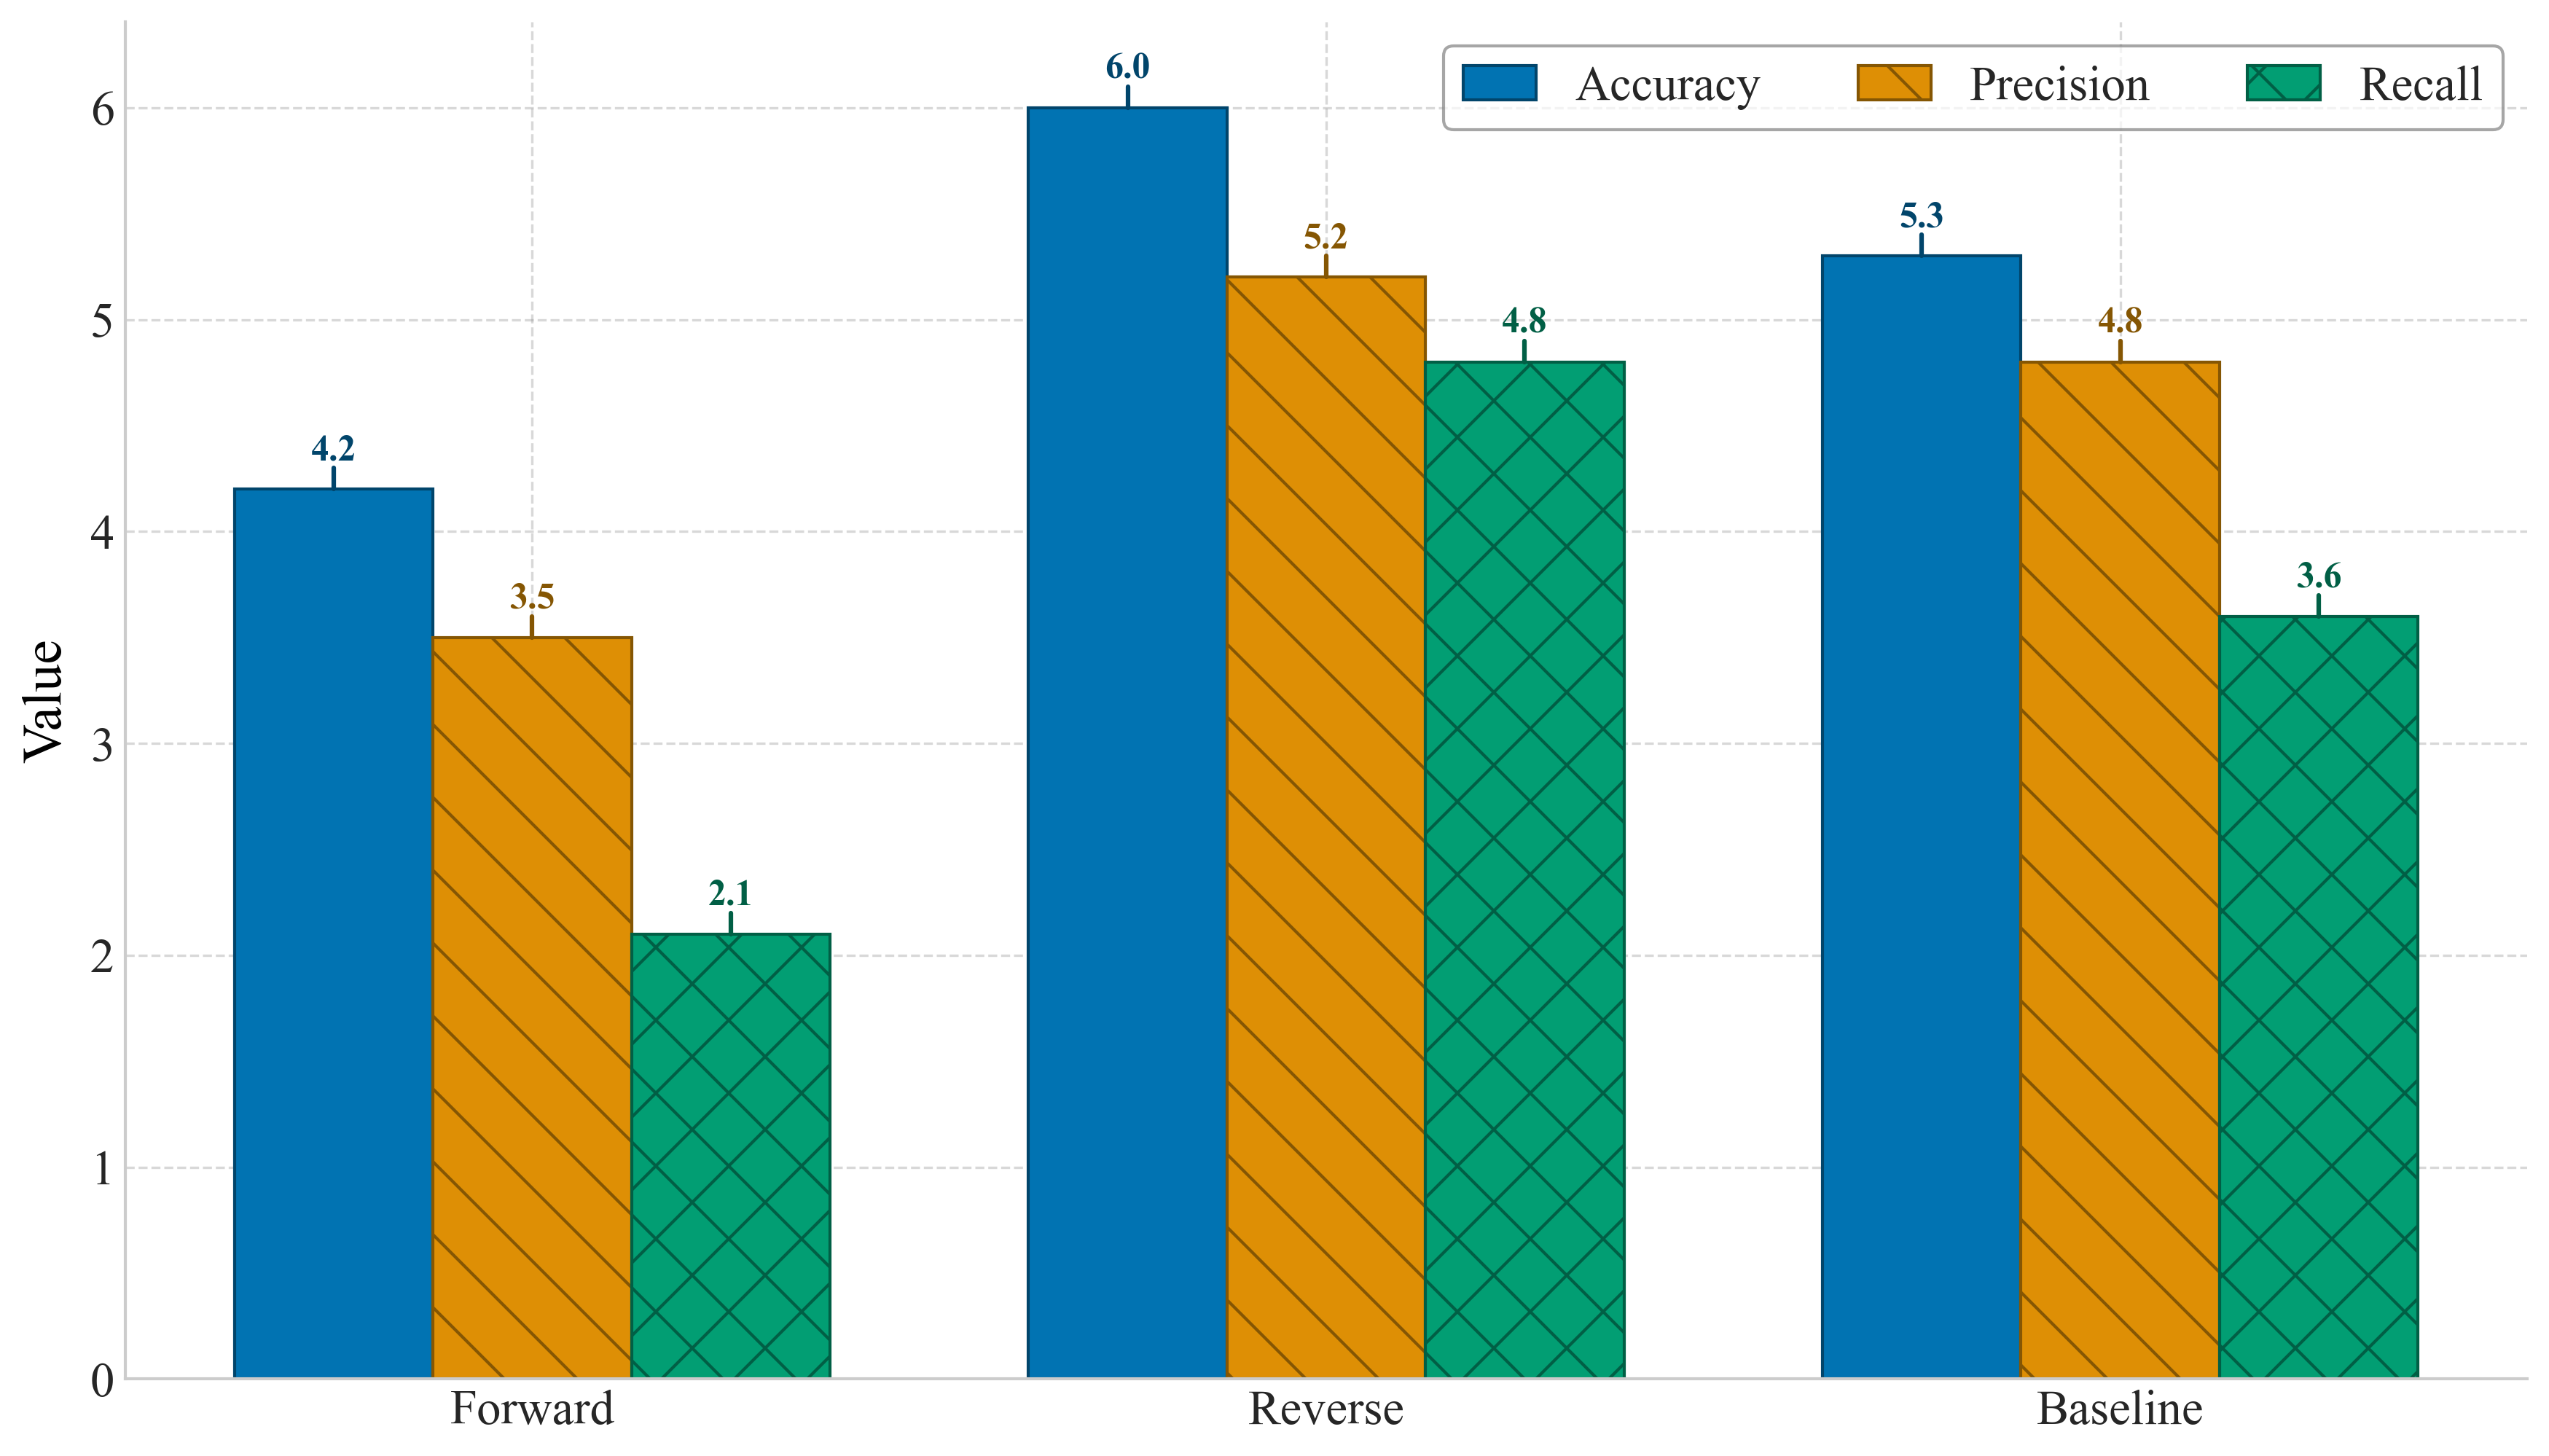
Simple bar chart example:
from matplotlib import pyplot as plt
from swizz import plot

data_dict = ...

# Style map for each metric (hatch patterns for filling)
style_map = {
    "Accuracy": '',
    "Precision": '\\',
    "Recall": 'x'  # Cross hatch pattern for Recall
}

plot("general_bar_plot", data_dict, style_map=style_map, save="bar")
plt.show()
Weights & Biases integration example:
from swizz.logging.wandb_analyzer import WandbAnalyzer, RunGroup

# Initialize the analyzer
analyzer = WandbAnalyzer("your-username/your-project", verbose=True)

# Define run groups (either by prefix or run IDs)
run_groups = [
    RunGroup(name="experiment1", prefix="your-prefix-1"),
    RunGroup(name="experiment2", prefix="your-prefix-2"),
]

# Get analyzed metrics
results_df = analyzer.compute_grouped_metrics(
    run_groups,
    x_key="round_num",
    y_key="your_metric"
)

# Plot the results
fig_scores, ax = plot(
    "multiple_std_lines_df",
    figsize=(8,5),
    data_df=results_df,
    label_key="group_name",
    x_key="round_num",
    y_key="your_metric_mean",
    yerr_key="your_metric_std",
    xlabel="Sampling Budget",
    ylabel="Average Score",
    legend_title="Experiments",
    legend_ncol=2,
    legend_loc="lower right"
)
plt.show()
Manim animation example:
from swizz import render_manim
import numpy as np
import pandas as pd

# Create sample data
methods = ['Method A', 'Method B', 'Method C']
iterations = range(30)
scores = []

for method in methods:
    for iteration in iterations:
        # Generate evolving scores for each method
        if method == 'Method A':
            mean = 50 + iteration * 1
            std = 10 + iteration * 3
        elif method == 'Method B':
            mean = 40 + iteration * 2
            std = 15 + iteration * 0.5
        else:  # Method C
            mean = 45 + iteration * 3
            std = 12

        scores.extend([(method, iteration, score)
                      for score in np.random.normal(mean, std, 300)])

scores_df = pd.DataFrame(scores, columns=['method', 'iteration', 'score'])

# Render the animation
render_manim(
    "histograms_evolution",
    render_config={
        "quality": "high_quality",
        "format": "mp4",
        "save_pngs": True,
    },
    scores_df=scores_df,
    method_column="method",
    iteration_column="iteration",
    score_column="score",
    x_min=0,
    x_max=100,
    x_step=10,
    num_bins=60,
    x_length=10,
    y_length=5,
    time_between_iterations=0.5,
    color_dict={
        "Method A": "#1f77b4",
        "Method B": "#ff7f0e",
        "Method C": "#2ca02c",
    },
)

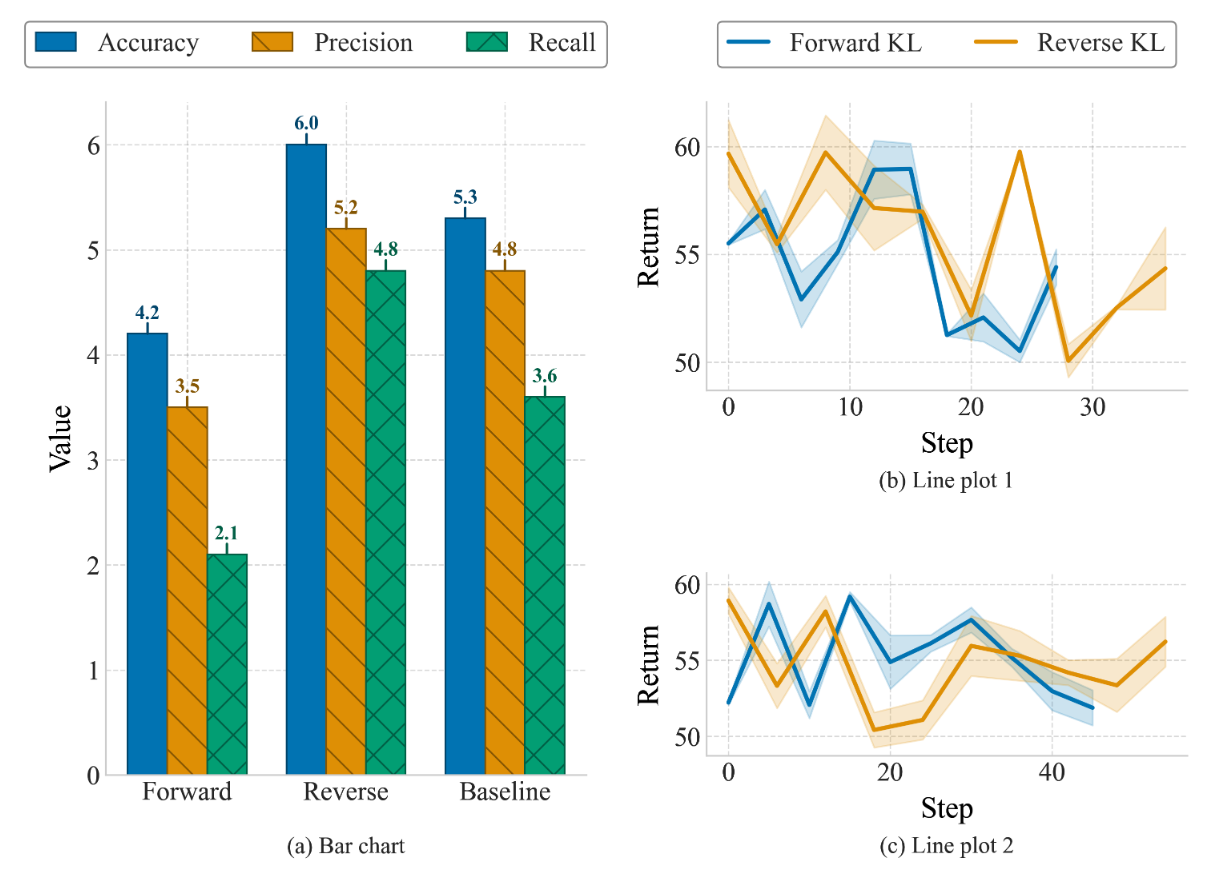
Complex nested layouts:
from swizz.layouts.blocks import Row, Col, LegendBlock, Label
from swizz.layouts import render_layout
from matplotlib import pyplot as plt

plot1, plot2, plot3 = ...

nested_layout = Col([
    Row([
        LegendBlock(labels=["Accuracy", "Precision", "Recall"], ncol=3, fixed_width=0.35),
        LegendBlock(labels=["Forward KL", "Reverse KL"], ncol=2)
    ], fixed_height=0.08, spacing=0.15),
    Row([
        Col([
            plot3,
            Label("(a) Bar chart", align="center", fixed_height=0.05),
        ]),
        Col([
            plot1,
            Label("(b) Line plot 1", align="center", fixed_height=0.05),
            plot2,
            Label("(c) Line plot 2", align="center", fixed_height=0.05)
        ], spacing=0.07)
    ], spacing=0.1),
], spacing=0.02)

fig = render_layout(nested_layout, figsize=(10, 8))
plt.show()
🛠️ Roadmap
- Add more plot types (confusion, UMAP, attention, histograms, etc.)
- Add Manim integrations for dynamic plot videos and function evolutions
- Add more tables
- W&B / MLflow integration
🤝 Contributing
Contributions are very welcome! See CONTRIBUTING.md for setup and module structure.


Download files
Download the file for your platform. If you're not sure which to choose, learn more about installing packages.
Source Distribution
Built Distribution
Filter files by name, interpreter, ABI, and platform.
If you're not sure about the file name format, learn more about wheel file names.
Copy a direct link to the current filters
File details
Details for the file swizz-0.1.3.1.tar.gz.
File metadata
- Download URL: swizz-0.1.3.1.tar.gz
- Upload date:
- Size: 41.3 kB
- Tags: Source
- Uploaded using Trusted Publishing? No
- Uploaded via: twine/6.0.1 CPython/3.10.12
File hashes
| Algorithm | Hash digest | |
|---|---|---|
| SHA256 |
09bdeb58a3dacc988885b320cc3b86c1f787677e31a78630bac6af3917bc63d8
|
|
| MD5 |
e6dc825f36b0f76d76650892800803b6
|
|
| BLAKE2b-256 |
89517bf8eedb6eba043c785e40640e2fb3a5acb1f983eb6393fd5a9914f35fe9
|
File details
Details for the file swizz-0.1.3.1-py3-none-any.whl.
File metadata
- Download URL: swizz-0.1.3.1-py3-none-any.whl
- Upload date:
- Size: 52.7 kB
- Tags: Python 3
- Uploaded using Trusted Publishing? No
- Uploaded via: twine/6.0.1 CPython/3.10.12
File hashes
| Algorithm | Hash digest | |
|---|---|---|
| SHA256 |
3e2f5a01e19e687f0a941f847e5f73f7db671b921efeeaaab022edd959e3fc9f
|
|
| MD5 |
fd7837844537f6709f99c98de799695c
|
|
| BLAKE2b-256 |
77d37ea83c9676804c1004b01025d4f49f52189b8ecdceb85b03681eeeac6997
|






