Tools for reading, writing, visualizing, and versioning EPA SWMM5 models.

Project description

SWMMIO is a set of python tools aiming to provide a means for version control and visualizing results from the EPA Stormwater Management Model (SWMM). Command line tools are also provided for running models individually and in parallel via Python’s multiprocessing module. These tools are being developed specifically for the application of flood risk management, though most functionality is applicable to SWMM modeling in general.
Prerequisites
SWMMIO functions primarily by interfacing with .inp and .rpt (input and report) files produced by SWMM. Functions within the run_models module rely on a SWMM5 engine which can be downloaded here.
Dependencies
Installation:
Before installation, it’s recommended to first activate a virtualenv to not crowd your system’s package library. If you don’t use any of the dependencies listed above, this step is less important. SWMMIO can be installed via pip in your command line:
pip install swmmioBasic Usage
The swmmio.Model() class provides the basic endpoint for interfacing with SWMM models. To get started, save a SWMM5 model (.inp) in a directory with its report file (.rpt). A few examples:
import swmmio

#instantiate a swmmio model object
mymodel = swmmio.Model('/path/to/directory with swmm files')

#Pandas dataframe with most useful data related to model nodes, conduits, and subcatchments
nodes = mymodel.nodes()
conduits = mymodel.conduits()
subs = mymodel.subcatchments()

#enjoy all the Pandas functions
nodes.head()
Name |
InvertElev |
MaxDepth |
SurchargeDepth |
PondedArea |
Type |
AvgDepth |
MaxNodeDepth |
MaxHGL |
MaxDay_depth |
MaxHr_depth |
HoursFlooded |
MaxQ |
MaxDay_flood |
MaxHr_flood |
TotalFloodVol |
MaximumPondDepth |
X |
Y |
coords |
S42A_10.N_4 |
13.506673 |
6.326977 |
5.0 |
110.0 |
JUNCTION |
0.69 |
6.33 |
19.83 |
0 |
12:01 |
0.01 |
0.20 |
0.0 |
11:52 |
0.000 |
6.33 |
2689107.0 |
227816.000 |
[(2689107.0, 227816.0)] |
D70_ShunkStreet_Trunk_43 |
8.508413 |
2.493647 |
5.0 |
744.0 |
JUNCTION |
0.04 |
0.23 |
8.74 |
0 |
12:14 |
NaN |
NaN |
NaN |
NaN |
NaN |
NaN |
2691329.5 |
223675.813 |
[(2691329.5, 223675.813)] |
TD61_1_2_90 |
5.150000 |
15.398008 |
0.0 |
0.0 |
JUNCTION |
0.68 |
15.40 |
20.55 |
0 |
11:55 |
0.01 |
19.17 |
0.0 |
11:56 |
0.000 |
15.40 |
2698463.5 |
230905.720 |
[(2698463.5, 230905.72)] |
D66_36.D.7.C.1_19 |
19.320000 |
3.335760 |
5.0 |
6028.0 |
JUNCTION |
0.57 |
3.38 |
22.70 |
0 |
12:00 |
0.49 |
6.45 |
0.0 |
11:51 |
0.008 |
3.38 |
2691999.0 |
230309.563 |
[(2691999.0, 230309.563)] |
#write to a csv
nodes.to_csv('/path/mynodes.csv')

#calculate average and weighted average impervious
avg_imperviousness = subs.PercImperv.mean()
weighted_avg_imp = (subs.Area * subs.PercImperv).sum() / len(subs)
Generating Graphics
Create an image (.png) visualization of the model. By default, pipe stress and node flood duration is visualized if your model includes output data (a .rpt file should accompany the .inp).
from swmmio.graphics import swmm_graphics as sg
sg.draw_model(mymodel)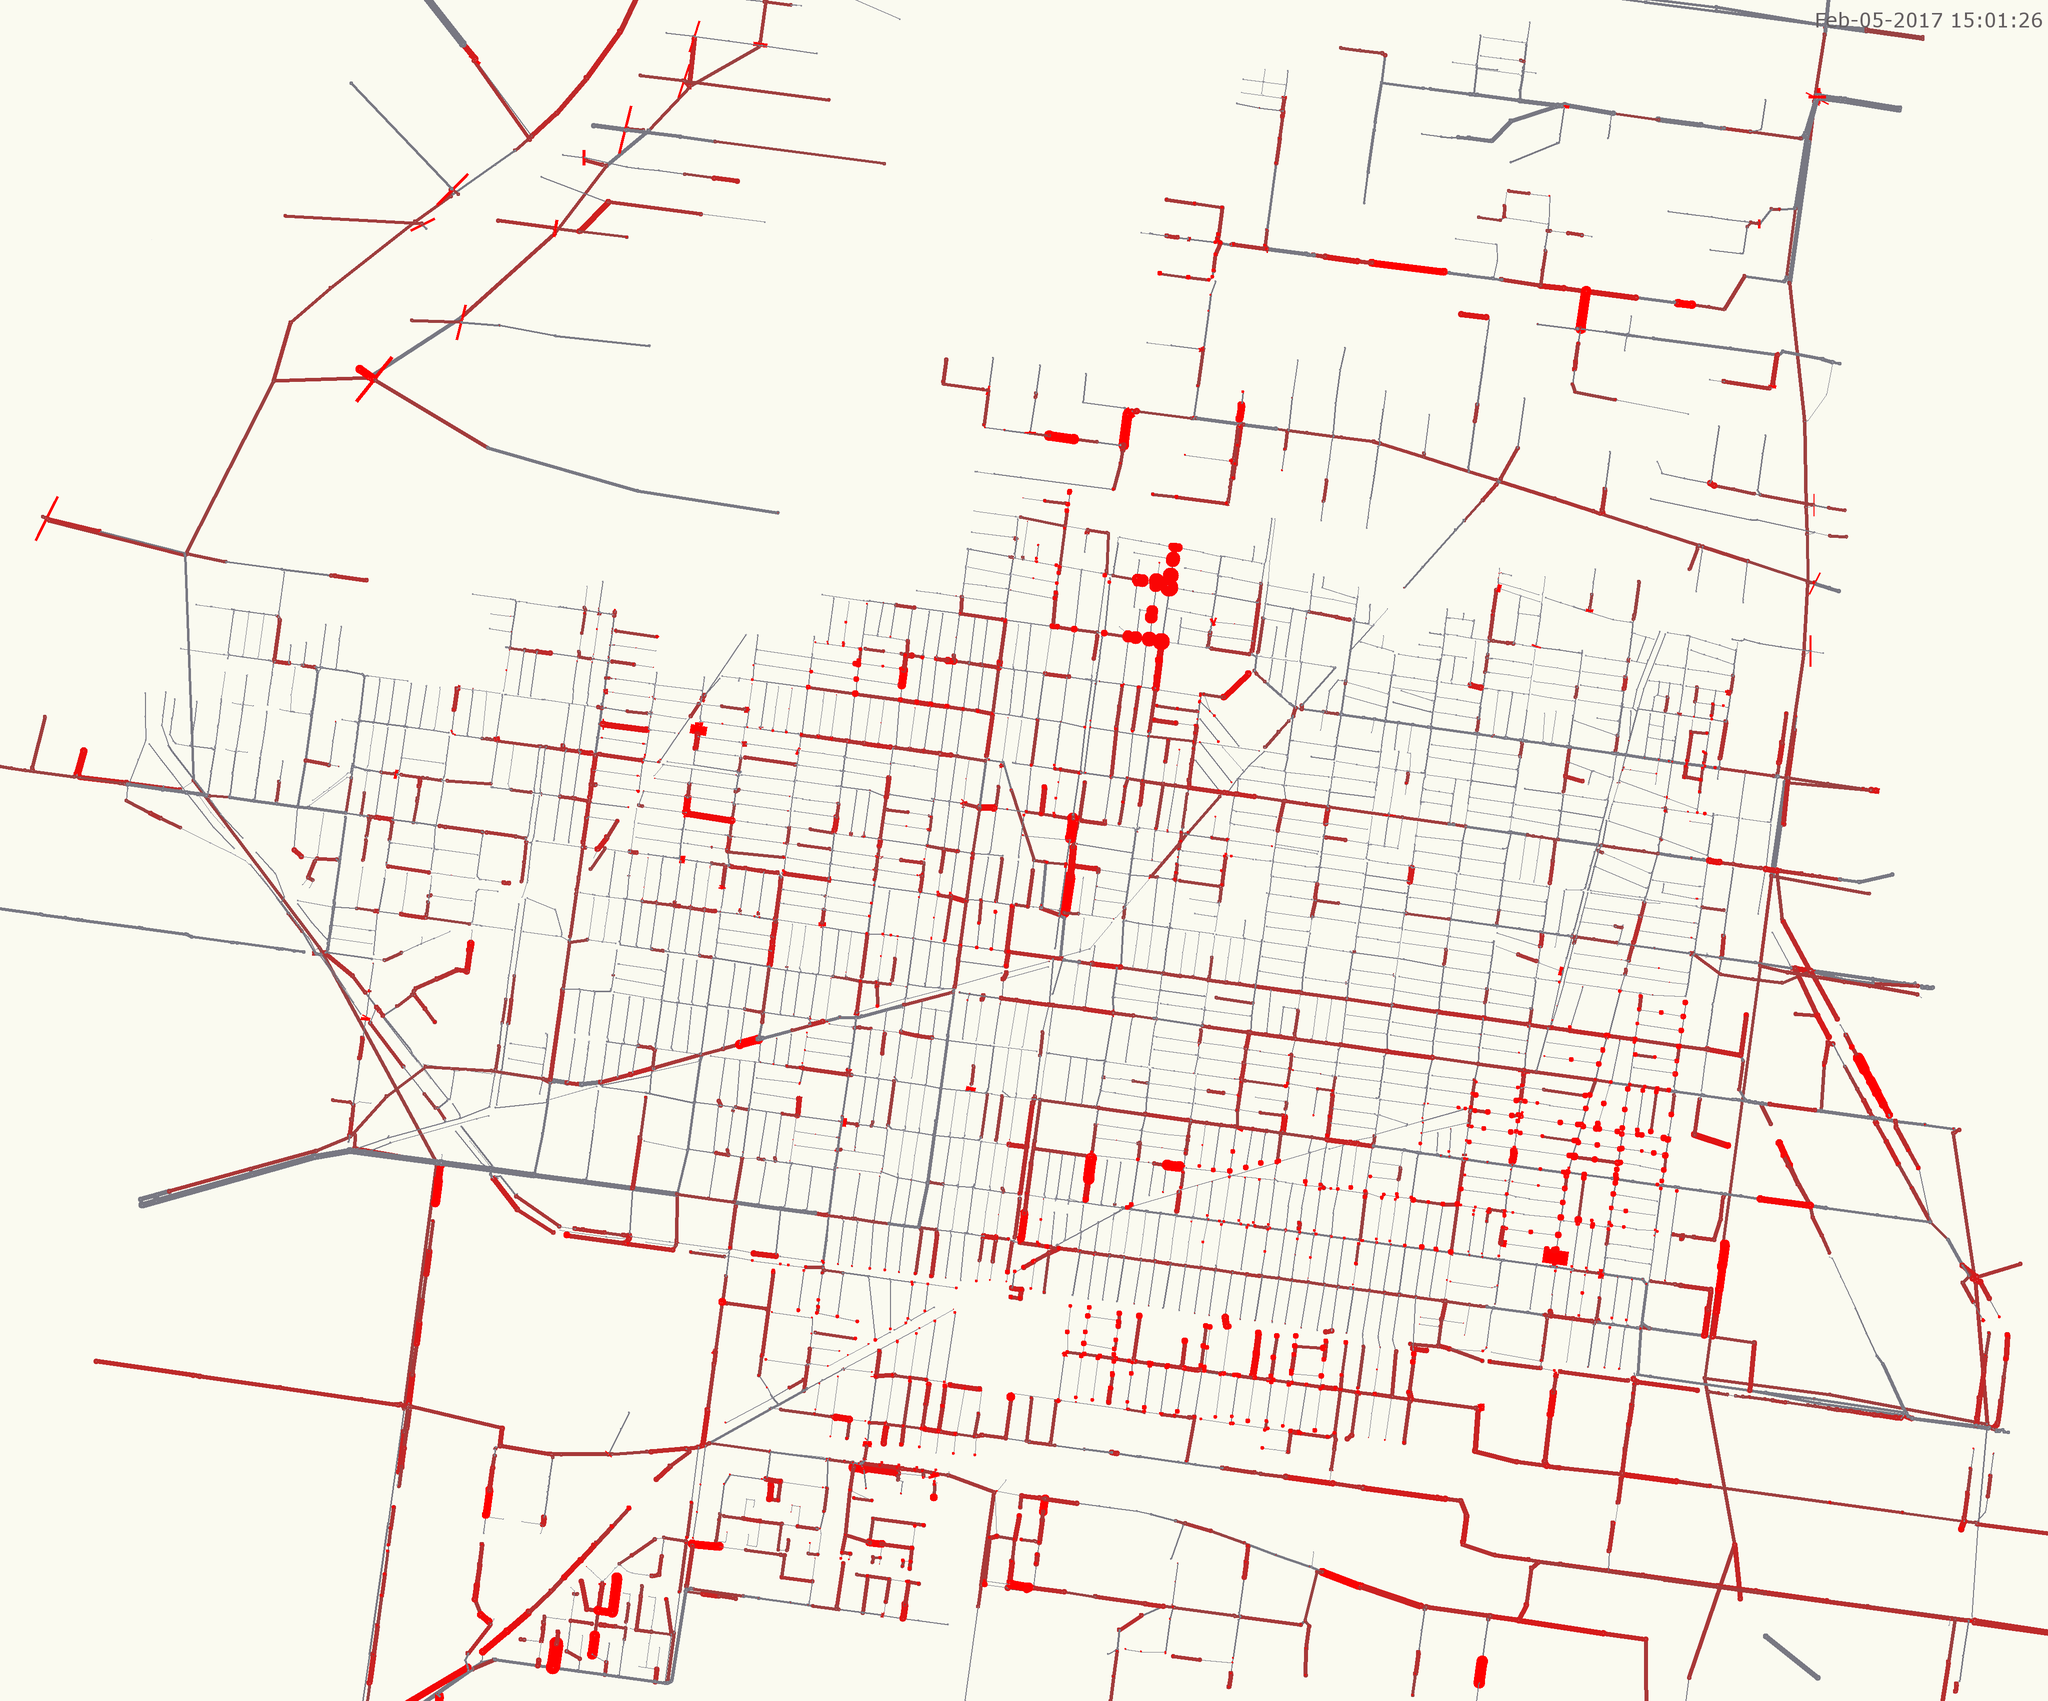
Default Draw Output
Use pandas to calculate some interesting stats, and generate a image to highlight what’s interesting or important for your project:
#isolate nodes that have flooded for more than 30 minutes
flooded_series = nodes.loc[nodes.HoursFlooded>0.5, 'TotalFloodVol']
flood_vol = sum(flooded_series) #total flood volume (million gallons)
flooded_count = len(flooded_series) #count of flooded nodes

#highlight these nodes in a graphic
nodes['draw_color'] = '#787882' #grey, default node color
nodes.loc[nodes.HoursFlooded>0.5, 'draw_color'] = '#751167' #purple, flooded nodes

#set the radius of flooded nodes as a function of HoursFlooded
nodes.loc[nodes.HoursFlooded>1, 'draw_size'] = nodes.loc[nodes.HoursFlooded>1, 'HoursFlooded'] * 12

#make the conduits grey, sized as function of their geometry
conds['draw_color'] = '#787882'
conds['draw_size'] = conds.Geom1

#add an informative annotation, and draw:
annotation = 'Flooded Volume: {}MG\nFlooded Nodes:{}'.format(round(flood_vol), flooded_count)
sg.draw_model(mymodel, annotation=annotation, file_path='flooded_anno_example.png')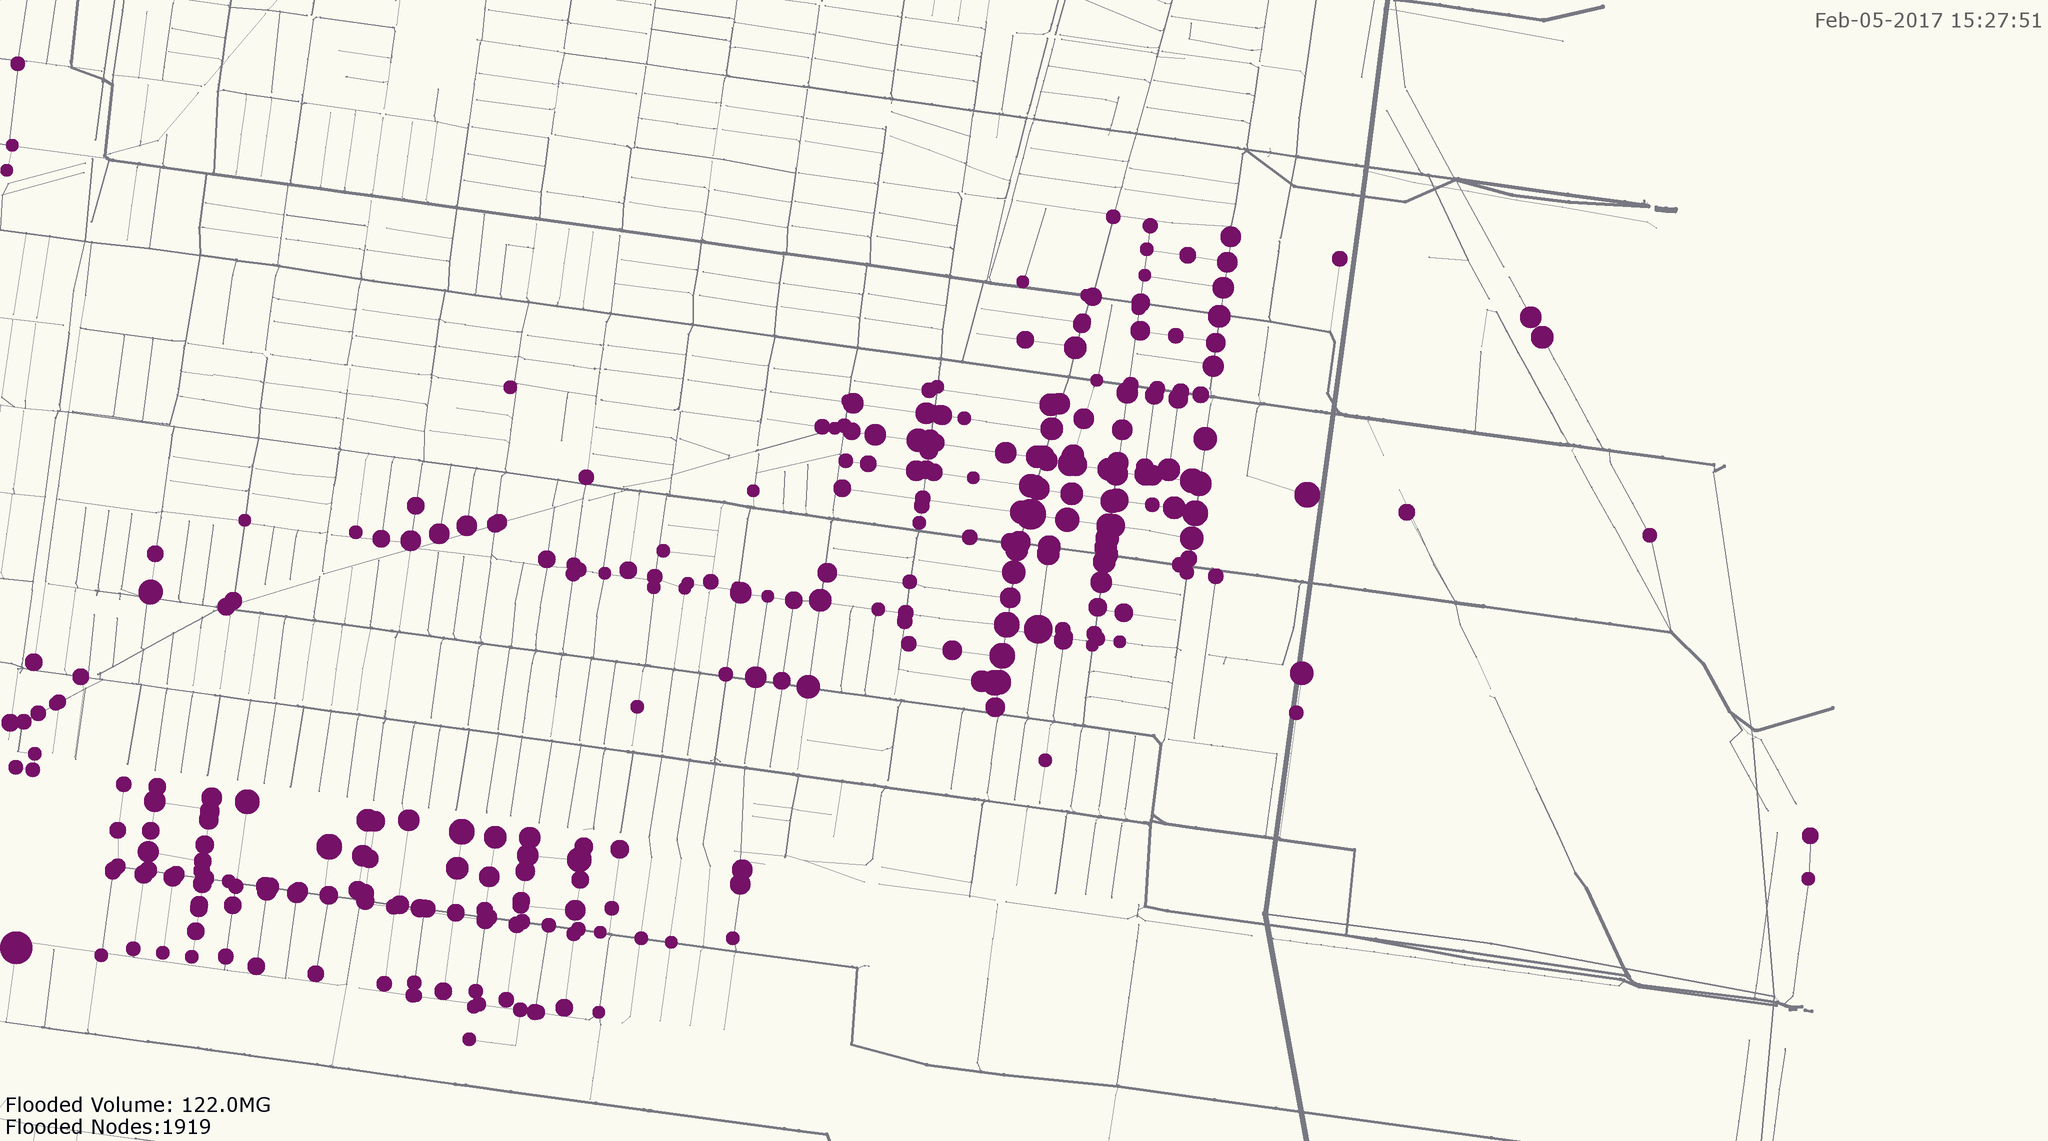
Flooded highlight
Building Variations of Models
Starting with a base SWMM model, other models can be created by inserting altered data into a new inp file. Useful for sensitivity analysis or varying boundary conditions, models can be created using a fairly simple loop, leveraging the modify_model package.
For example, climate change impacts can be investigated by creating a set of models with varying outfall Fixed Stage elevations:
import os, shutil
import swmmio
from swmmio.utils.modify_model import replace_inp_section
from swmmio.utils.dataframes import create_dataframeINP

#initialize a baseline model object
baseline = swmmio.Model(r'path\to\baseline.inp')
rise = 0.0 #set the starting sea level rise condition

#create models up to 5ft of sea level rise.
while rise <= 5:

    #create a dataframe of the model's outfalls
    outfalls = create_dataframeINP(baseline.inp.path, '[OUTFALLS]')

    #create the Pandas logic to access the StageOrTimeseries column of  FIXED outfalls
    slice_condition = outfalls.OutfallType == 'FIXED', 'StageOrTimeseries'

    #add the current rise to the outfalls' stage elevation
    outfalls.loc[slice_condition] = pd.to_numeric(outfalls.loc[slice_condition]) + rise

    #copy the base model into a new directory
    newdir = os.path.join(baseline.inp.dir, str(rise))
    os.mkdir(newdir)
    newfilepath = os.path.join(newdir, baseline.inp.name + "_" + str(rise) + '_SLR.inp')
    shutil.copyfile(baseline.inp.path, newfilepath)

    #Overwrite the OUTFALLS section of the new model with the adjusted data
    replace_inp_section(newfilepath, '[OUTFALLS]', outfalls)

    #increase sea level rise for the next loop
    rise += 0.25
Access Model Network
The swmmio.Model class returns a Networkx MultiDiGraph representation of the model via that network parameter:
#access the model as a Networkx MutliDiGraph
G = model.network

#iterate through links
for u, v, key, data in model.network.edges(data=True, keys=True):

        print (key, data['Geom1'])
# do stuff with the networkRelease history Release notifications | RSS feed


Download files
Download the file for your platform. If you're not sure which to choose, learn more about installing packages.
Source Distribution
File details
Details for the file swmmio-0.3.3.tar.gz.
File metadata
- Download URL: swmmio-0.3.3.tar.gz
- Upload date:
- Size: 624.9 kB
- Tags: Source
- Uploaded using Trusted Publishing? No
- Uploaded via: twine/1.12.1 pkginfo/1.4.2 requests/2.18.4 setuptools/39.2.0 requests-toolbelt/0.8.0 tqdm/4.23.4 CPython/3.6.3
File hashes
| Algorithm | Hash digest | |
|---|---|---|
| SHA256 |
da57a330a19218f91dbad2a2a04a8c65163ccc5b60ad389b921b86765e1a0d34
|
|
| MD5 |
3ccb42c897245c64ac035d7e21d76726
|
|
| BLAKE2b-256 |
b2a3b72ed3afff49a374cd6c06d33d3df0439bb1ae5002382ed8d05b48722fc8
|


