
sys-stats
An open-source Python tool to provide system stats over a web interface.


Project Website: https://amithkoujalgi.github.io/sys-stats/
Table of Contents
Introduction
This Python package allows you to monitor various system statistics through a simple web interface. Whether you’re a developer, a sysadmin, or just curious about how your system is performing, this package makes it easy to access and visualize system metrics.
Why System Stats Web Interface?
One would definitely question – “why develop another monitoring tool?” Well, there are quite a few tools that I have tried but they either needed some effort to setup or lacked one or more features.
While there are numerous monitoring tools available for different purposes, I needed a solution that was very simple. A tool that’s easy to install, involves almost no effort to set up, and offers a simple and clean web UI for visualizing essential system metrics.
PS: I’d appreciate if someone can point me to some good tools that suit the above stated goal! I’d be happy to take a look at it.
The development of that thought, resulted in a tool that is:
Easy To Install: Install the package using pip and get started with just a few commands.
Has a Web Interface: Access system statistics through a simple, clean and user-friendly web interface.
Has Real-Time Monitoring: Monitor CPU usage, memory usage, disk space, and more in real time.
Has Cross-Platform support: Compatible with various operating systems, including macOS, and Linux.
For whom is this tool intended?
While this tool could be used by anybody who is interested in simple system monitoring, it is best suited for developers or system admins or someone who wants to monitor a headless (remote server/non-windowed mode server) computer which over a web interface.
Where can I run this?
It can practically run on any system, and due to its lightweight nature, it can operate on computers with low resource specifications.
Some of the use-cases:
you can set it up on Docker containers which need to be monitored remotely.
if you have multiple on-prem servers in a private network that need monitoring at individual host level, you can host this tool on each server and access it over web interface.
you can run it on a Raspberry Pi (potentially?). Although I’ve not tested the tool on a Raspberry platform 😅
The possibilities are endless and the tool will evolve over time to get better.
Features
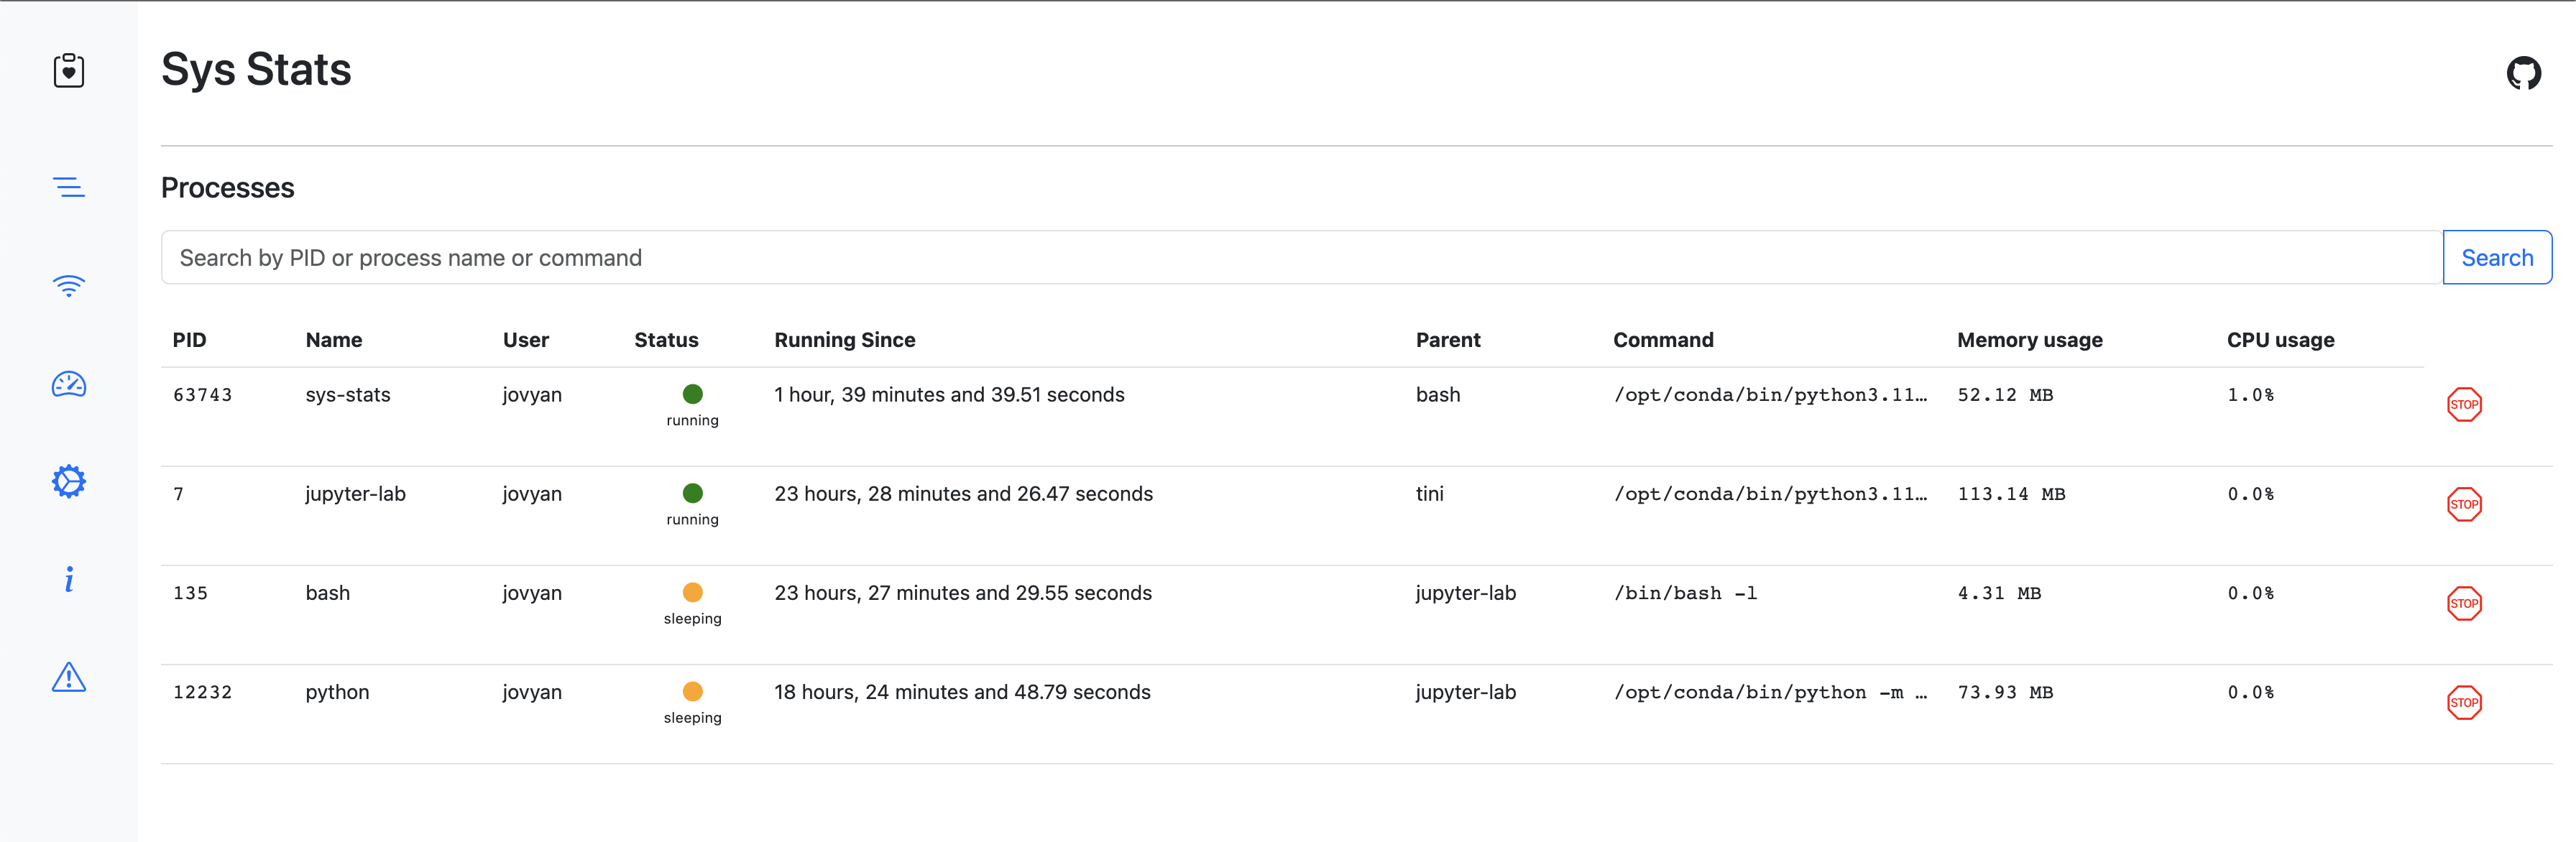
List running processes
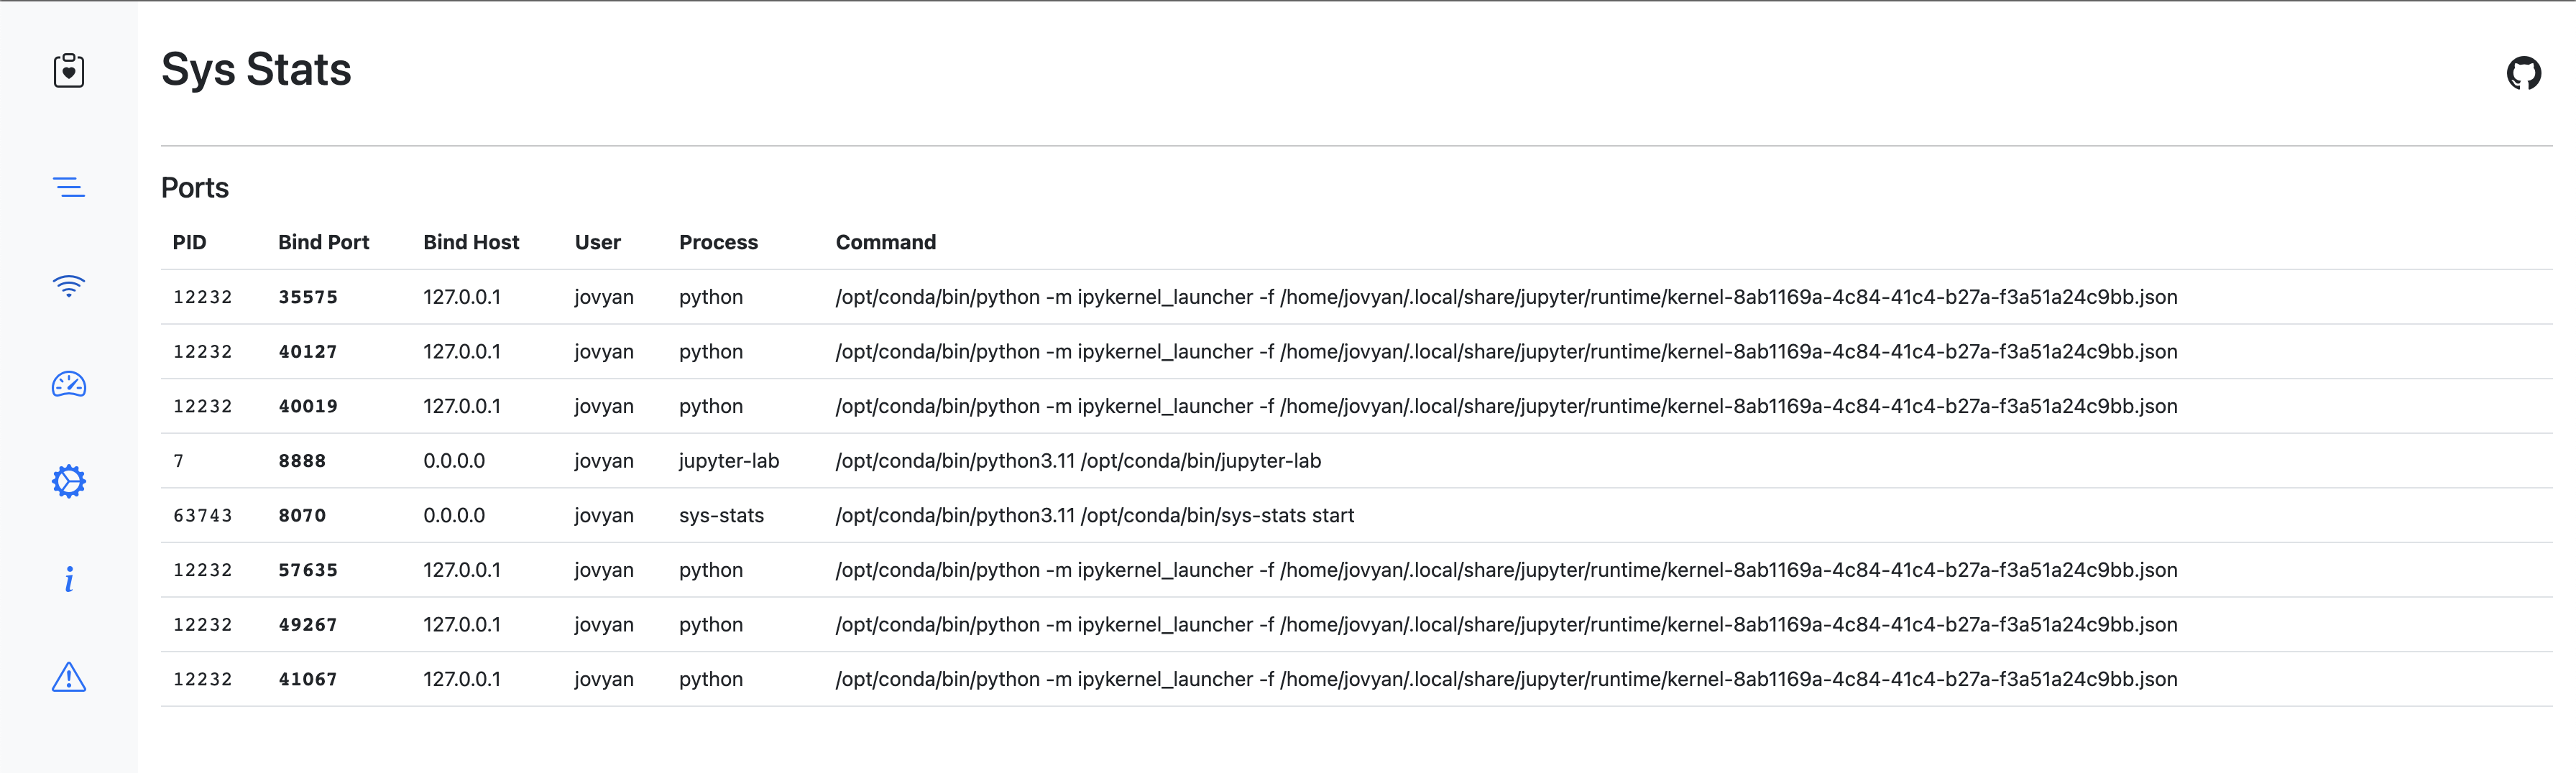
List processes listening on inet ports
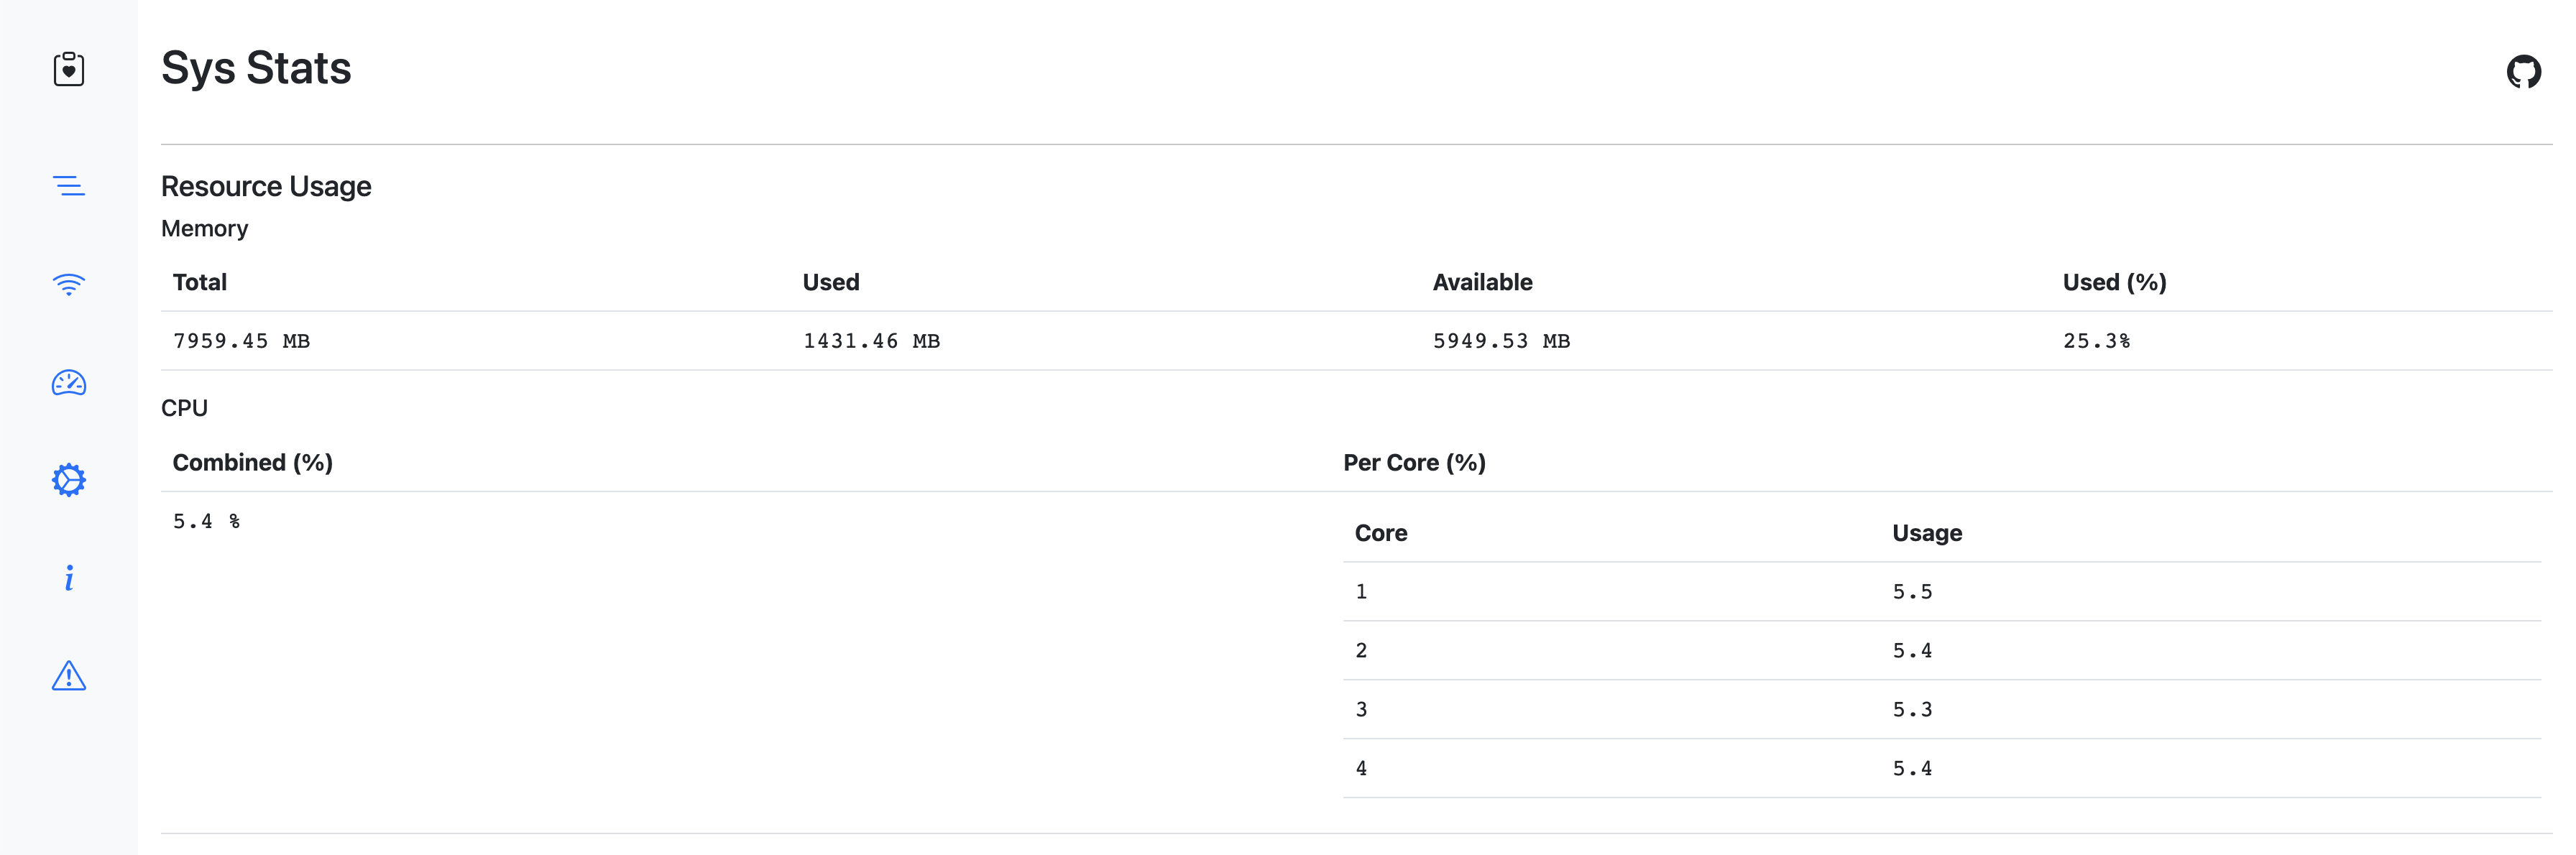
Show hardware metrics - CPU/Memory usage, etc
Installation
To install the package, use the following pip command:
pip install sys-statsNote:
On MacOS, it might fail to install if you do not have xcode set up. Please set up xcode using the command xcode-select --install and continue with the installation. Meanwhile, I shall find a way to by-pass this step.
PyPI project: https://pypi.org/project/sys-stats/
Then run,
sys-stats startThe process starts up with the following logs:
INFO:root:Starting web server on 0.0.0.0:8070
INFO:root:Web UI at: http://0.0.0.0:8070
(8606) wsgi starting up on http://0.0.0.0:8070
Now, access the web interface at http://localhost:8070
To specify a different port, run:
sysstats start --port 8055Check the installed version of sys-stats:
sys-stats versionScreenshots
Listing processes
List of processes listening on inet ports
Resource utilisation
Development
Requirements
macOS or Ubuntu or any other *nix distros
Python 3.8+
Building from source
Run:
bash build.shThis creates a wheel distribution under dist directory.
Areas of improvement
Cache the data in memory to record resource utilisation for a given time period (for 30 mins, or more) - useful for plotting resource utilisation graphs.
Security measures/user authentication
UI improvements - look and feel and slickness
Sorting table data by fields
Settings view
Ability to start the server in background (-d/–daemon mode)
Ability to pass an external JSON/YAML configuration file to configure bind address, logging path, etc.
Support for cluster setup (may be?)
Get Involved
Contributions are most welcome! Whether it’s reporting a bug, proposing an enhancement, or helping with code - any sort of contribution is much appreciated.
License
The project is released under the MIT License. For more details, consult the License file.
1 maintainer

Release files for sys-stats 0.0.15
For a detailed explanation of source distributions (sdists) and built distributions (wheels), please see the package formats documentation.
Built distribution (wheel)
| File | Interpreter | ABI | Platform | Reset |
|---|---|---|---|---|
| sys_stats-0.0.15-py3-none-any.whl | Python 3 | none | any | Details |
Release files / sys_stats-0.0.15-py3-none-any.whl
| Download URL | sys_stats-0.0.15-py3-none-any.whl |
|---|---|
| Size | 21.6 kB |
| Tags | Python 3 |
|
SHA-256 checksum How to use checksums |
074eea0f3b5e49238ab66c29048d1a1654f339fec7c2be7d878bdf61858df685
|
|
BLAKE2b-256 checksum How to use checksums |
ee8e779aeb9a0b9f673d0001671861b060578b5c086d2e8d20ccee28bb064f73
|
| Upload date | |
|
Uploaded using Trusted Publishing? What is trusted publishing? |
No |
| Uploaded via |
twine/4.0.2 CPython/3.8.18
|














