
SystemPulse



SystemPulse is a lightweight cross-platform system monitoring and observability CLI for Windows, macOS, and Linux. It combines a Rich terminal dashboard with configurable alerts, local SQLite history, CSV export, and an optional Prometheus endpoint—without requiring a background daemon or web application.
Use it for an immediate view of host health, a live terminal dashboard, local metric history, or a small Prometheus target on a workstation or server.
Dashboard
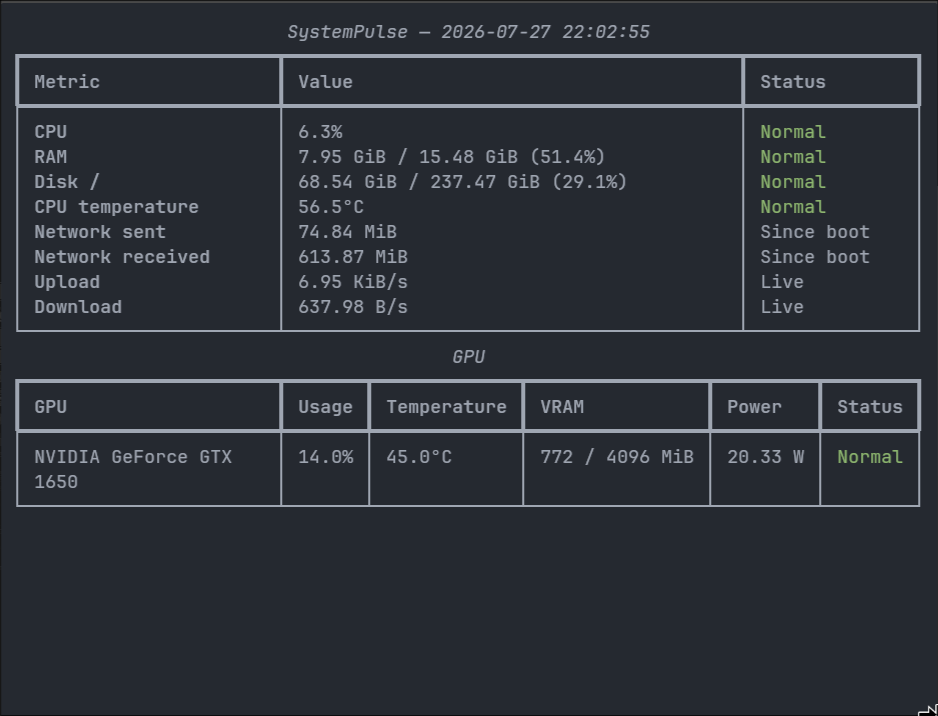
The existing capture accurately represents the core dashboard layout. It predates the current
Alerts, Power, and Power Session panels, so a present-day systempulse live session includes
additional information. See docs/demo.md for a safe, reproducible demo-capture
workflow.
Quick start
SystemPulse is not yet published to PyPI. Install the current project from source:
git clone https://github.com/guptaoni891-ctrl/systempulse.git
cd systempulse
python -m pip install -e .
Then open the menu, live dashboard, or a one-time snapshot:
systempulse
systempulse live
systempulse snapshot
Install the optional exporter dependencies from the source checkout when Prometheus support is needed:
python -m pip install -e ".[prometheus]"
systempulse serve
After a future PyPI release, installation will become:
pip install systempulse
pip install "systempulse[prometheus]"  # only when exporter support is needed
These PyPI commands are release instructions, not a claim that version 2.1.0 is currently published. For virtual-environment setup on each platform, see Installation from source.
Features
- CPU, memory, system-disk, and network monitoring.
- Network totals since boot and upload/download rate calculation.
- On-demand internet connection benchmarking through Cloudflare's globally routed edge.
- CPU temperature when the operating system exposes a usable sensor through
psutil. - Top CPU-consuming processes.
- NVIDIA GPU usage, temperature, VRAM, and optional power through
nvidia-smi. - CPU package power on Windows through optional LibreHardwareMonitor, plus clearly labelled system and wall-power estimates.
- Live and historical time-weighted power statistics, telemetry-aware observed durations, and integrated energy in Wh or kWh.
- Multiple NVIDIA GPUs represented independently in snapshots, alerts, history, and Prometheus.
- Rich one-shot and live terminal views with configurable status thresholds.
- Stateful alerts with duration, hysteresis, cooldown, escalation, and recovery transitions.
- Transactional SQLite snapshot, GPU, and durable alert-event history with retention.
- CSV snapshot logging and custom output paths.
- Optional scrape-decoupled Prometheus exporter.
- Typed, validated JSON configuration with OS-specific config and data locations.
- Python 3.11–3.13 support with cross-platform CI, static typing, and enforced branch coverage.
Platform support
| Platform | Core metrics | CPU temperature | CPU package power | NVIDIA GPU |
|---|---|---|---|---|
| Windows 10/11 | Supported | Available only when exposed through psutil |
Optional LibreHardwareMonitor | Requires nvidia-smi |
| macOS | Supported | Often unavailable through psutil |
Currently unavailable | Generally unavailable on modern Macs |
| Linux | Supported | Commonly available when supported sensors are exposed | Currently unavailable | Requires nvidia-smi |
Missing sensors or GPU tooling are reported as unavailable; they do not prevent core monitoring.
Use --no-gpu to skip NVIDIA detection explicitly.
For Windows CPU power, LibreHardwareMonitor must be running with enough access to expose its
root\LibreHardwareMonitor WMI namespace. LibreHardwareMonitor is optional and is not installed as
a Python dependency. If it is stopped, inaccessible, or does not expose a recognized CPU package
sensor, SystemPulse reports CPU package power as unavailable; core monitoring and independent
NVIDIA GPU telemetry continue to work.
Power telemetry
SystemPulse keeps measured components distinct from estimates:
- CPU Package is a measurement when LibreHardwareMonitor supplies it on Windows.
- GPU Total is the sum of available measured NVIDIA GPU power readings already present in the snapshot.
- CPU + GPU combines those measured components, but is available only when both totals exist.
- Estimated System adds a configured allowance for components outside the measured CPU and GPUs.
- Estimated Wall adjusts estimated system power for the configured power-supply efficiency.
- Actual Wall is reserved for physical external-provider data. No such provider exists today,
so this field remains
Unavailable.
Estimated values are prefixed with ~ in terminal views. In particular, estimated wall power is a
model and is not equivalent to a physical wall-meter reading. The implemented relationships are:
estimated_system_watts = cpu_gpu_watts + other_components_watts
estimated_wall_watts = estimated_system_watts / psu_efficiency
The defaults are a 35 W allowance and 0.90 efficiency. Configure the existing fields with, for example:
systempulse config set power.other_components_watts 45
systempulse config set power.psu_efficiency 0.92
other_components_watts estimates DC power not represented by measured CPU + GPU power, such as
memory, storage, fans, and motherboard components. psu_efficiency is used only to derive the wall
estimate. If either CPU package or GPU total is unavailable, CPU + GPU and its dependent system and
wall estimates are also unavailable rather than being filled with fake zeroes.
Power over time
One watt-hour (Wh) is one watt sustained for one hour; 1000 Wh is 1 kWh. SystemPulse integrates successive readings over their real elapsed time instead of multiplying an arbitrary instantaneous reading by the whole period. Each valid interval uses trapezoidal integration:
energy_Wh += ((P1 + P2) / 2) * elapsed_seconds / 3600
Missing, negative, or non-finite readings break continuity. For example, no energy is assigned across this gap:
00:00  100 W
00:30  unavailable
01:00  100 W
Session Duration is total elapsed live-session time. Observed Duration includes only intervals bounded by consecutive valid power readings, so it can be shorter. Live timing uses a monotonic clock and the actual elapsed interval, not an assumed refresh interval.
systempulse live shows current CPU, GPU, system, and wall values plus the time-weighted average,
peak, observed duration, and integrated energy for estimated wall power. Actual-wall statistics
have a separate accumulator and will appear only if genuine provider readings become available.
systempulse history reports corresponding averages, peaks, energy, and observed durations from
persisted samples. See docs/history.md for filtering and migration details.
CLI reference
Global options must appear before the command:
--config PATH   use an explicit JSON configuration
--no-gpu        skip NVIDIA GPU collection
--version       print the installed version
Monitor the host
| Command | Purpose |
|---|---|
systempulse |
Open the interactive menu. |
systempulse menu |
Open the same menu explicitly. |
systempulse live |
Run the continuously updating dashboard until interrupted. |
systempulse snapshot |
Render one authoritative system snapshot. |
systempulse processes --limit 10 |
Show processes sorted by sampled CPU usage. |
systempulse network |
Show cumulative sent/received counters since boot. |
systempulse network --speed |
Measure current local interface upload and download throughput. |
systempulse speedtest |
Actively benchmark internet download, upload, HTTP latency, and jitter through Cloudflare's edge. |
systempulse --no-gpu snapshot |
Collect a snapshot without running nvidia-smi. |
The installed module entry point is equivalent, for example python -m systempulse snapshot.
Internet speed test
systempulse network --speed and systempulse speedtest measure different things. The former
samples operating-system interface counters to report current local throughput; it does not create
benchmark traffic. The latter is an explicit, active internet benchmark that downloads and uploads
progressively larger payloads through Cloudflare's edge infrastructure.
The benchmark uses a native Python HTTP/2 client and a Cloudflare-inspired progressive measurement methodology. Results may differ from Cloudflare's browser test, which uses the browser PerformanceResourceTiming API; SystemPulse does not claim numerical equivalence. Latency is measured with HTTPS requests to the Cloudflare edge at the application layer. It is not ICMP ping, and protocol and timing-API differences can make it differ from the browser result.
Because systempulse speedtest transfers test data, it may consume significant bandwidth. It runs
only when invoked directly (or selected from the interactive menu), never as part of snapshot,
live, history, save, serve, config, processes, or ordinary network monitoring. Results are not
stored in SQLite history or CSV. SystemPulse displays Cloudflare's edge colo code when response
metadata provides one, but it does not infer or display the user's country, city, or other
geographic location. See docs/network.md.
Alerts and history
| Command | Purpose |
|---|---|
systempulse alerts |
Show configured alert rules and the runtime-state limitation. |
systempulse alerts --history --limit 20 |
Show recent durable alert transitions. |
systempulse history --limit 10 |
Show summaries, including Power History, and recent samples. |
systempulse history --hours 24 --limit 20 |
Restrict history to recent hours. |
systempulse history --days 7 |
Restrict history to recent days. |
--hours and --days are mutually exclusive. Active alerts exist only in the live process; durable
transition history is stored separately in SQLite. See docs/alerts.md and
docs/history.md.
Save and export
| Command | Purpose |
|---|---|
systempulse save |
Append one sampled reading to the configured CSV file. |
systempulse save --output logs/readings.csv |
Override the CSV destination. |
systempulse serve |
Serve current metrics at 127.0.0.1:9100/metrics. |
systempulse serve --host 0.0.0.0 --port 9200 --interval 2 |
Override exporter binding and sampling interval. |
Prometheus support requires the prometheus extra. Binding beyond 127.0.0.1 exposes host metrics
to reachable clients and should be an explicit decision. See
docs/prometheus.md.
New CSV files include these seven power fields after the established columns:
cpu_package_watts, gpu_total_watts, cpu_gpu_watts, estimated_system_watts,
estimated_wall_watts, actual_wall_watts, and cpu_power_source. Unavailable readings are
written as Unavailable, never fake zero. An existing file with the exact legacy V1 header keeps
receiving legacy-width rows; an unknown or incompatible header is rejected instead of risking a
malformed file.
Inspect and update configuration
| Command | Purpose |
|---|---|
systempulse show-config |
Print the effective configuration; legacy alias for config show. |
systempulse config show |
Print the effective validated configuration. |
systempulse config path |
Print the selected or default user config path. |
systempulse config init |
Create a complete user configuration without replacing an existing file. |
systempulse config init --force |
Replace the target configuration intentionally. |
systempulse config set cpu.warning 70 |
Validate and update one supported setting. |
systempulse --config custom.json config show |
Use an explicit configuration path. |
Configuration precedence, every supported key, and a complete valid example are documented in docs/configuration.md.
Architecture
flowchart TD
    C[Hardware collectors] --> S[MonitorService]
    S --> SS[Authoritative SystemSnapshot + PowerStats]

    SS --> UI[Rich terminal UI]
    SS --> PST[PowerSessionTracker]
    SS --> A[AlertEngine]
    SS --> CSV[CSV logger]
    SS --> H[SQLite history]
    E[Shared energy integration] --> PST
    E --> H
    A --> AE[Alert transition events]
    AE --> H

    ES[Exporter sampling loop] --> S
    SS --> LS[Lock-protected latest state]
    LS --> PE[Prometheus collector]
    PS[Prometheus scrape] --> PE
Collectors gather raw host data. MonitorService combines it into one immutable, UTC-stamped
SystemSnapshot, including PowerStats; presentation, session tracking, persistence, and export
components consume that snapshot rather than collecting independently. AlertEngine and
PowerSessionTracker never poll hardware.
The exporter has its own monotonic sampling loop that updates lock-protected latest state.
Prometheus scrapes read that state and never call MonitorService, psutil, or nvidia-smi.
SQLite is a separate sink and does not feed Prometheus. See
docs/architecture.md for module boundaries and design guarantees.
Installation from source
SystemPulse requires Python 3.11, 3.12, or 3.13.
Windows PowerShell
git clone https://github.com/guptaoni891-ctrl/systempulse.git
cd systempulse
py -m venv .venv
.venv\Scripts\Activate.ps1
python -m pip install --upgrade pip
python -m pip install -e ".[dev]"
Linux and macOS
git clone https://github.com/guptaoni891-ctrl/systempulse.git
cd systempulse
python3 -m venv .venv
source .venv/bin/activate
python -m pip install --upgrade pip
python -m pip install -e ".[dev]"
The dev extra includes the optional Prometheus dependency so the complete test suite can exercise
both normal exporter behavior and missing-dependency behavior. Runtime users can install . or
.[prometheus] instead.
Documentation
- Configuration
- Alerts
- SQLite history
- Network and internet speed
- Prometheus exporter
- Architecture
- Development and CI
- Demo capture
- Contributing
- Security policy
- Changelog
Engineering quality
The repository enforces branch coverage at 90% and currently maintains more than 90% coverage. CI separates quality checks, the supported Python/OS test matrix, and clean package validation. Local commands are documented in docs/development.md.
Important boundaries include immutable authoritative snapshots, monotonic interval scheduling, timezone-aware UTC persistence, transactional SQLite writes, bounded Prometheus labels, optional exporter dependencies, and no scrape-triggered hardware collection.
License
SystemPulse is available under the MIT License.
1 maintainer

Metadata
1 maintainer
Release files for systempulse 2.1.0
For a detailed explanation of source distributions (sdists) and built distributions (wheels), please see the package formats documentation.
Source distribution (sdist)
| File | Size | Uploaded | |
|---|---|---|---|
| systempulse-2.1.0.tar.gz | 141.4 kB | Details |
Built distribution (wheel)
| File | Interpreter | ABI | Platform | Reset |
|---|---|---|---|---|
| systempulse-2.1.0-py3-none-any.whl | Python 3 | none | any | Details |
Total release size: 195.6 kB
Release files / systempulse-2.1.0.tar.gz
| Download URL | systempulse-2.1.0.tar.gz |
|---|---|
| Size | 141.4 kB |
| Tags | Source |
|
SHA-256 checksum How to use checksums |
d3ccbec246aff691d397ea25ffba9056b5aa347322f0f0def5dbfb99461c0510
|
|
BLAKE2b-256 checksum How to use checksums |
4c739b2e5a750a0fda43864143905091456cd4e2d15cb7e0fca0ff1a3d098b64
|
| Upload date | |
|
Uploaded using Trusted Publishing? What is trusted publishing? |
Yes |
| Uploaded via |
twine/7.0.0 CPython/3.13.14
|
Provenance
Provenance describes where a file came from. On PyPI, provenance is shared via attestations, which provide a verifiable record of the build or publishing details. View details, limitations and caveats.


PyPI Publish Attestation
PyPI verified that this artifact, at this checksum, originated from the publisher listed below.
Signed by GitHub Actions, verified by PyPI on Sep 15, 2026.
Transparency logRelease files / systempulse-2.1.0-py3-none-any.whl
| Download URL | systempulse-2.1.0-py3-none-any.whl |
|---|---|
| Size | 54.2 kB |
| Tags | Python 3 |
|
SHA-256 checksum How to use checksums |
397e3580b4bb1b4f0b617ce8f21252d75af9f38eda8ae6e7364b49dd5d0c925b
|
|
BLAKE2b-256 checksum How to use checksums |
1988cf1a2ff7c6a4f719a352fdc1800e071dda7b9a90b883aec79fe96f110d7c
|
| Upload date | |
|
Uploaded using Trusted Publishing? What is trusted publishing? |
Yes |
| Uploaded via |
twine/7.0.0 CPython/3.13.14
|
Provenance
Provenance describes where a file came from. On PyPI, provenance is shared via attestations, which provide a verifiable record of the build or publishing details. View details, limitations and caveats.
PyPI Publish Attestation
PyPI verified that this artifact, at this checksum, originated from the publisher listed below.
Signed by GitHub Actions, verified by PyPI on Sep 15, 2026.
Transparency log













