
syswatch
A local Linux system diagnostics and monitoring tool with an interactive
terminal UI and scriptable CLI. syswatch reads /proc and /sys
directly (plus a few well-known OS interfaces) and degrades gracefully when
information cannot be collected.
Requirements
- Linux (kernel 4.x+ tested) — the application is designed for Linux; on other platforms it exits with a clear message.
- Python 3.11+ (Debian 12+, Ubuntu 23.04+, Fedora 38+, Arch, RHEL 9+)
- For the interactive TUI only:
textual(installed automatically with the[tui]extra). All non-interactive commands run on the standard library alone.
Install
Recommended: pipx
pipx installs CLI tools in isolated environments
and puts the command on your PATH. It handles Debian/Ubuntu's
externally managed Python restriction transparently.
# Debian / Ubuntu
sudo apt install pipx && pipx ensurepath

# Fedora
sudo dnf install pipx && pipx ensurepath

# Arch
sudo pacman -S python-pipx && pipx ensurepath

# Install syswatch (restart your shell after the first ensurepath)
pipx install 'syswatch-linux[tui]'      # CLI + interactive TUI
pipx install syswatch-linux             # CLI only, no TUI dependencies
Alternative: pip in a user environment
If pipx isn't available:
python3 -m pip install --user 'syswatch-linux[tui]'
# then make sure ~/.local/bin is on your PATH
On distros that mark system Python as externally managed (PEP 668), add
--break-system-packages. It's safe here since --user writes only to
~/.local/, not to system directories.
From a checkout, no install at all
The CLI runs straight from the source tree on the standard library alone:
git clone https://github.com/S0mthingIDK/syswatch
cd syswatch
chmod +x bin/syswatch     # only needed if you did not clone via git
./bin/syswatch info
./bin/syswatch health
Or invoke the module directly:
python3 -m syswatch info # from the checkout root
Only the TUI needs the extra packages. To install them into the checkout:
python3 -m venv .venv
.venv/bin/pip install -e '.[tui]'
.venv/bin/syswatch
Note for tarball / ZIP users: after copying the tree onto Linux, run
chmod +x bin/syswatchonce. The executable bit is preserved bygit clonebut not by zip,scp, or shared folders from Windows.
Verify
syswatch --version
syswatch info
syswatch health
Interactive TUI
Run syswatch with no arguments (or syswatch tui) in a terminal:
syswatch            # pipx install
.venv/bin/syswatch  # from a checkout
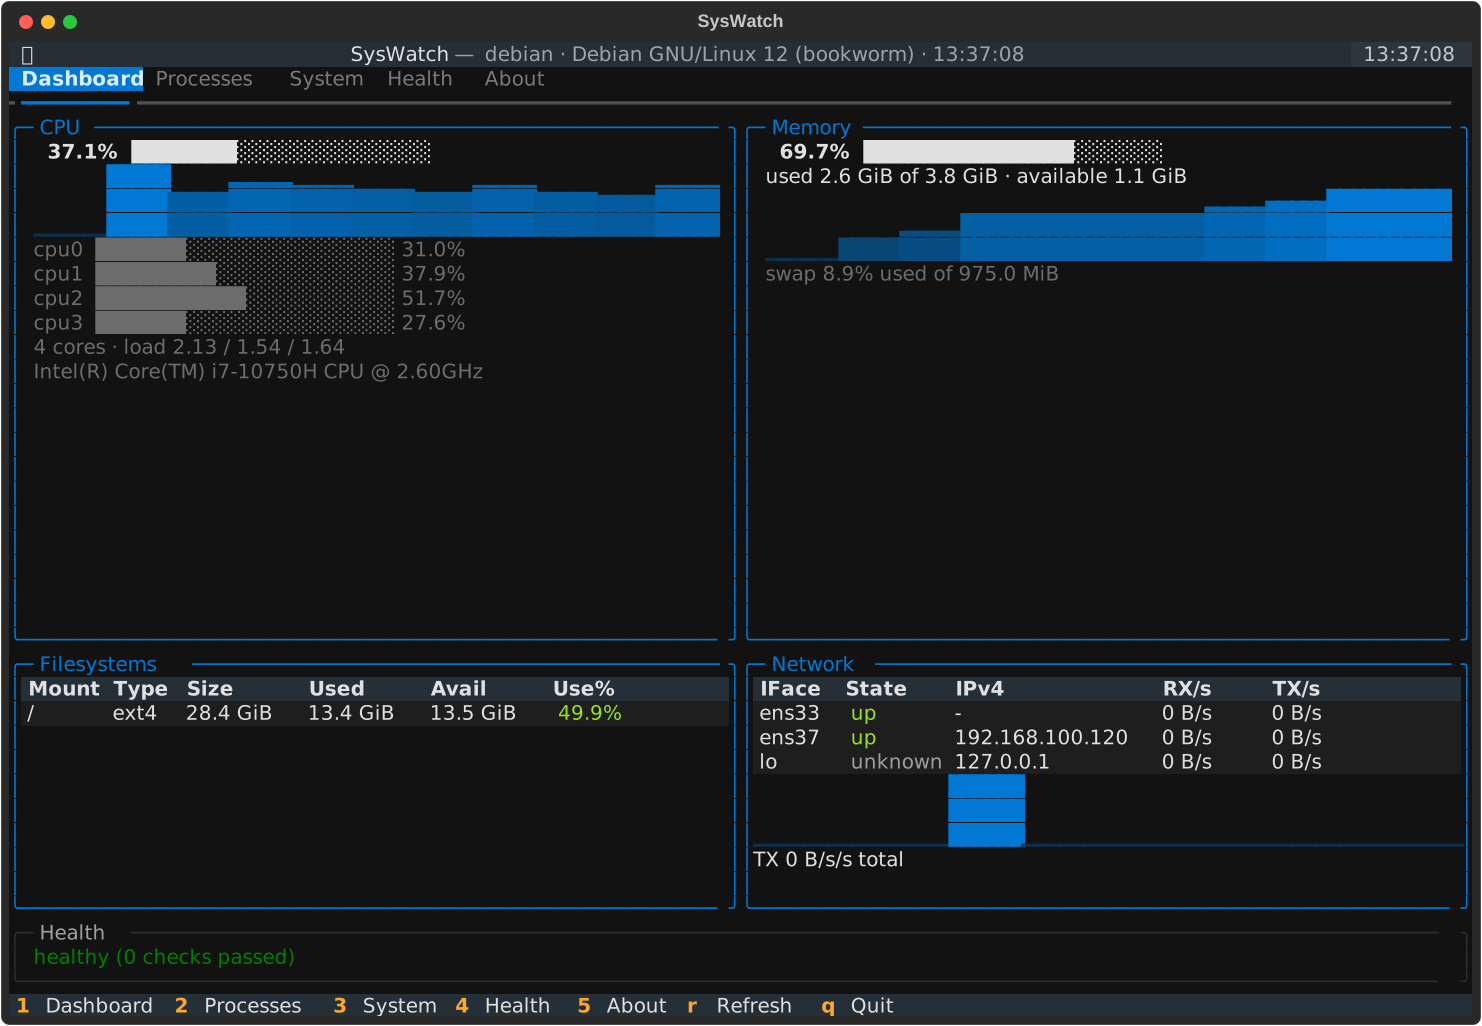
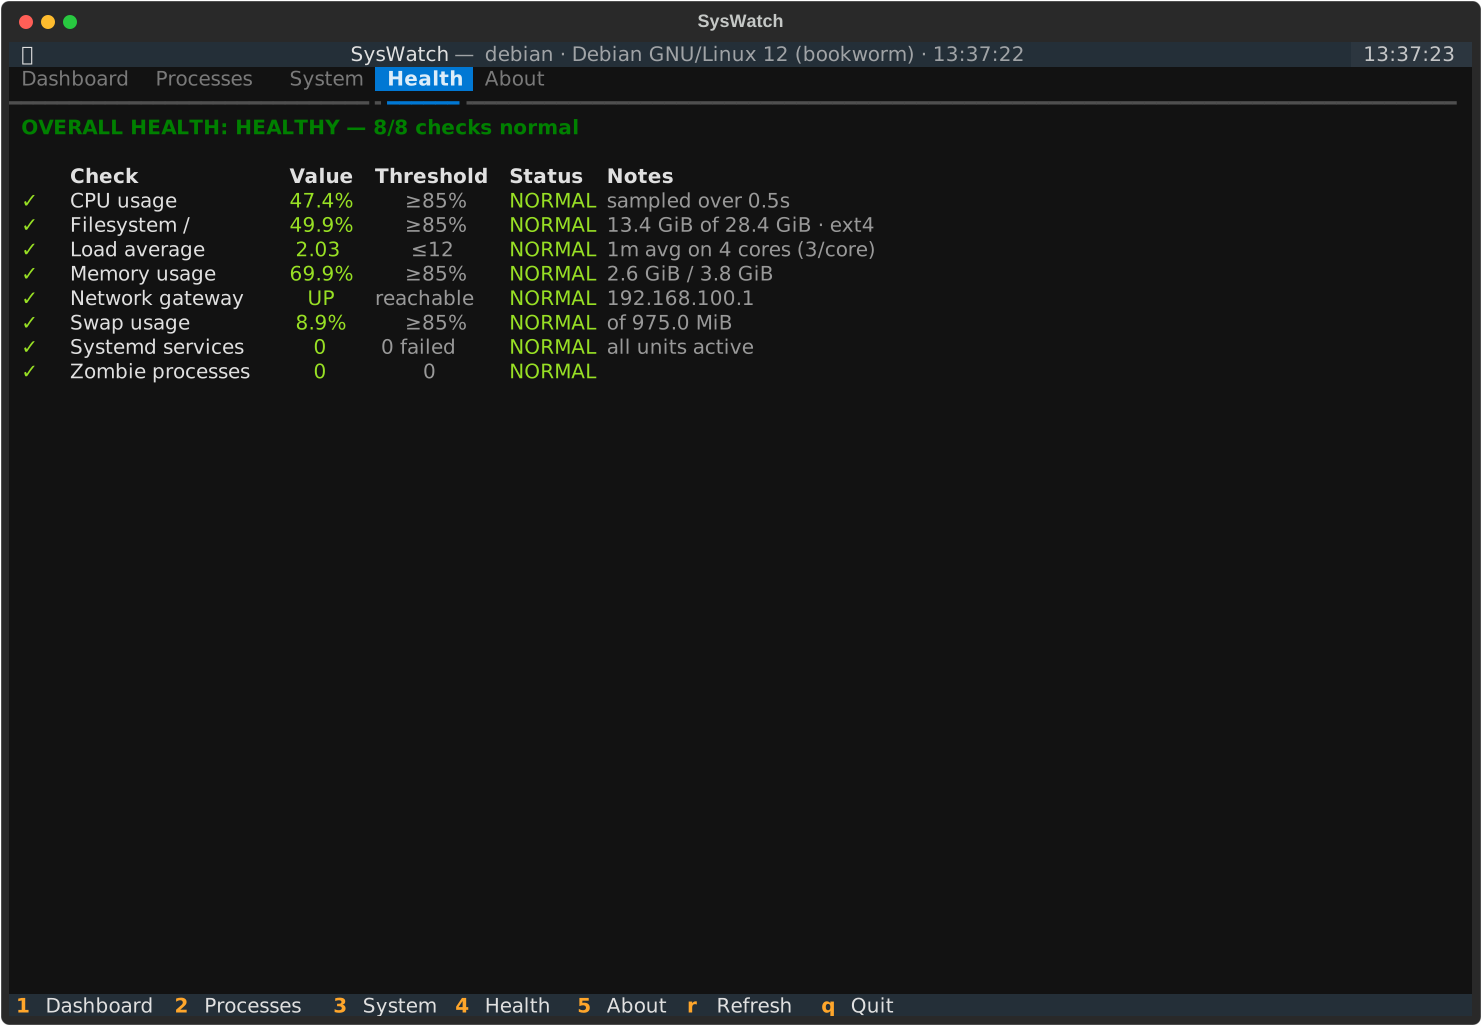
Views: [1] Dashboard (CPU/memory/disks/network + health strip), [2] Processes (live table, filter, details pane), [3] System (host/CPU/memory/filesystem/network cards), [4] Health (every check with live value and threshold), [5] About.
Keyboard shortcuts:
| Key | Action |
|---|---|
1..5 |
switch view |
r |
force an immediate refresh |
/ |
focus process filter (Esc clears, works globally) |
s |
cycle process sort: cpu → mem → pid → name |
Enter |
popup with full details of selected process |
d |
toggle the process details side pane |
q |
quit |
Everything is live: CPU/memory/network graphs update every refresh interval, the process table rescans in a background thread, and health checks re-run periodically without blocking the UI. A failed collector shows “unavailable” in its panel instead of crashing the app.
Troubleshooting the TUI:
ModuleNotFoundError: textual— reinstall with the extra:pipx install --force 'syswatch-linux[tui]'(orpip install 'syswatch-linux[tui]').- Broken/garbled colors over SSH — ensure
TERMis set correctly (e.g.xterm-256color). - Below ~100 columns views stack into a single column; below ~26 rows the
System view becomes a scrollable column so no panel is crushed.
The process details pane appears from ~100 columns (
dtoggles it). - On very wide terminals (>160 columns) panels regroup into balanced multi-column grids instead of stretching; content stays centered.
Commands
| Command | Purpose |
|---|---|
info |
Static system facts: hostname, OS, kernel, CPU, RAM, disks, NICs (--json supported) |
monitor |
Live view: CPU %, memory, worst disk, network RX/TX rates, process count, load average. Options: -i/--interval, -n/--count, --json, --no-clear |
ps |
Process viewer with PID, name, state, CPU %, MEM %, RSS. Options: -s/--sort {cpu,mem,pid,name}, -f/--filter NAME, -n/--rows 0=all, --json |
health |
Health checks (see below). Exit status reflects findings (--json supported) |
report |
Machine-readable JSON diagnostic report to stdout or -o FILE; --pretty for indented output |
config |
Show effective configuration, its source file and search order |
tui |
Launch the interactive terminal UI (also the default when no command is given) |
Examples
syswatch info
syswatch ps -s cpu -f chrome -n 20
syswatch monitor -i 2
syswatch health --json | jq '.findings'
syswatch report -o /var/tmp/report.json --pretty
All commands work without the TUI dependency, making them safe for cron jobs, scripts and CI.
Health checks
Every check is always visible in the TUI Health view with its live value, configured threshold and status (normal / warning / critical / unavailable) — even when it passes:
- CPU usage – sampled over
sample_delayseconds; warning abovecpu_warning, critical abovecpu_warning + critical_offset - memory usage – same pattern with
ram_warning - swap usage – same pattern with
swap_warning; reported normal when no swap is configured - filesystem almost full – per mounted filesystem, warning above
disk_warning, critical abovedisk_warning + critical_offset - abnormal load average – 1-minute load above
load_per_core_warning x cores - zombie processes – any process in state
Z - failed systemd services – only where systemd is detectable; shown as unavailable otherwise
- default gateway reachability – ICMP ping when available, TCP probes as fallback; unavailable when no default route exists
CLI exit status: 0 healthy, 1 warnings found, 2 any critical finding.
Where the results appear
Three surfaces, all fed by the same evaluate_health() call:
| Surface | Shows |
|---|---|
syswatch health (CLI) |
Only findings — problems above their thresholds. Silence means healthy. |
| TUI Dashboard strip | One-line summary: healthy · no issues detected, N warnings, or N critical. Links to view [4]. |
TUI Health view [4] |
Every check, with live value, threshold, status and note — passing ones included. |
Configuration
TOML file. Search order: $SYSWATCH_CONFIG, ~/.config/syswatch/config.toml,
/etc/syswatch/config.toml. A path passed via --config overrides all and
must exist.
[thresholds]
cpu_warning = 85.0        # percent, 0-100
ram_warning = 85.0        # percent, 0-100
swap_warning = 85.0       # percent, 0-100
disk_warning = 85.0       # percent, 0-100
critical_offset = 10.0    # added to warning thresholds for critical level
load_per_core_warning = 3.0

[monitor]
interval = 1.0            # seconds between refreshes

[processes]
rows = 15                 # default rows shown by `ps`

[tui]
interval = 2.0            # dashboard refresh seconds (>= 0.25)
history = 120             # graph history samples
theme = ""                # Textual theme name e.g. "nord", "dracula"

[general]
health_timeout = 3.0      # timeout for systemctl/ping probes
TUI thresholds reuse the same [thresholds] values as syswatch health;
every panel — CPU, memory, swap, filesystems — switches to warning/critical
colors using warning_threshold and critical_offset from this table.
Unknown options produce a warning; values outside valid ranges are rejected with a clear error and exit status 1.
Logging
Logs go to stderr only (stdout stays clean for output and JSON):
- default: warnings and errors
-v/--verbose: debug logging including per-source collection failures-q/--quiet: suppress log output
Error handling
Every collector tolerates missing files, malformed /proc content,
permission problems, disappearing interfaces/mountpoints, and unavailable
external commands (systemctl, ping). Partial results are rendered, and
collection failures are reported:
infoprints a "could not be collected" sectionreportincludes acollection_errorsarray- running on a non-Linux platform exits with status 1 and an explanatory message
Development
Setup
git clone https://github.com/S0mthingIDK/syswatch
cd syswatch
python3 -m venv .venv
.venv/bin/pip install --upgrade pip
.venv/bin/pip install -e '.[dev]'
Testing
.venv/bin/python -m pytest -q
The suite is hermetic — collectors accept injectable proc_root / sysfs_root
/ etc_root paths, so tests run against synthetic /proc and /sys trees
in tmp_path rather than the live system. tests/test_tui.py drives the
Textual app headlessly via App.run_test(); it is skipped automatically
(pytest.importorskip("textual")) if the TUI extra is not installed, so
pip install -e '.[dev]' — which includes textual — is required to run
the complete suite.
Building and publishing
python -m build                                  # produces dist/*.whl and dist/*.tar.gz
python -m twine check dist/*                     # metadata sanity check
python -m twine upload --repository testpypi dist/*   # test
python -m twine upload dist/*                    # real PyPI
Releases are published automatically by GitHub Actions when a GitHub Release
is created — see .github/workflows/publish.yml. Uses PyPI Trusted
Publishing, no API tokens required.
Project layout
bin/syswatch             checkout launcher (auto-selects the project .venv)
docs/screenshots/        rendered TUI captures (SVG)
tests/                   pytest suite incl. headless Textual pilot tests

syswatch/
├── cli.py               argument parsing, command handlers
├── config.py            TOML loading/validation
├── tui/                 interactive terminal UI (Textual)
│   ├── app.py           navigation, timers, background workers
│   ├── state.py         UI-independent collector hub (no Textual imports)
│   ├── widgets.py       dashboard/system/health/about panels
│   └── processes.py     process table, filtering, details pane & popup
├── collectors/
│   ├── cpu.py           /proc/stat deltas, load average
│   ├── memory.py        /proc/meminfo
│   ├── network.py       /proc/net/dev counters, /proc/net/route gateways
│   ├── processes.py     /proc/[pid] scanning, zombies, CPU deltas
│   └── system.py        host identity, statvfs disks, interfaces
├── health.py            checks and severity model (findings + per-check statuses)
├── report.py            JSON report assembly
├── output.py            terminal tables/colors
├── logging_setup.py     stderr logging configuration
├── paths.py             /proc, /sys, /etc roots (injectable for tests)
├── util.py              formatting and safe-read helpers
└── exceptions.py
Dependencies
Non-interactive syswatch is standard-library only. The optional TUI adds
textual; because Textual (as of
8.x) relies on Rich APIs removed in Rich 15, the project pins
rich >=13,<15 alongside it — pipx install 'syswatch-linux[tui]' resolves a
compatible pair automatically.
Known limitations
- CPU/memory percentages are sampled over short windows (
sample_delay), so they are estimates, not long-run averages. - Failed-service detection requires systemd; other init systems are skipped.
- Gateway reachability relies on ping or open TCP ports; firewalled gateways may be reported unreachable when merely filtered.
- IPv4 interface addresses come from SIOCGIFADDR, which reports the primary address only; aliases are not listed.
- Per-process CPU percentages need two refreshes to warm up (they are deltas), so the first sample after launch reads 0.
- CPU frequency is shown only when the kernel exposes it via
cpuinfoor cpufreq; on some VMs neither is available.
Contributing
Issues and pull requests are welcome. Before opening a PR:
.venv/bin/python -m pytest -q # expect all tests to pass
Keep new collectors proc_root/sysfs_root-injectable so tests stay
hermetic, and prefer extending evaluate_health() over ad-hoc checks in
the CLI or TUI.
License
MIT — see LICENSE for the full text.
1 maintainer

Metadata
1 maintainer
Release files for syswatch-linux 1.0.0
For a detailed explanation of source distributions (sdists) and built distributions (wheels), please see the package formats documentation.
Source distribution (sdist)
| File | Size | Uploaded | |
|---|---|---|---|
| syswatch_linux-1.0.0.tar.gz | 66.5 kB | Details |
Built distribution (wheel)
| File | Interpreter | ABI | Platform | Reset |
|---|---|---|---|---|
| syswatch_linux-1.0.0-py3-none-any.whl | Python 3 | none | any | Details |
Total release size: 120.7 kB
Release files / syswatch_linux-1.0.0.tar.gz
| Download URL | syswatch_linux-1.0.0.tar.gz |
|---|---|
| Size | 66.5 kB |
| Tags | Source |
|
SHA-256 checksum How to use checksums |
6e45c1c42c2ec463040710b1bb003ba067f2bc8ea333f0a9ba7b3c6335f92f3e
|
|
BLAKE2b-256 checksum How to use checksums |
79acc1b29440e68259d0febf88251655b9b803a95ff23a77cc44e0627095161a
|
| Upload date | |
|
Uploaded using Trusted Publishing? What is trusted publishing? |
Yes |
| Uploaded via |
twine/7.0.0 CPython/3.13.14
|
Provenance
Provenance describes where a file came from. On PyPI, provenance is shared via attestations, which provide a verifiable record of the build or publishing details. View details, limitations and caveats.


PyPI Publish Attestation
PyPI verified that this artifact, at this checksum, originated from the publisher listed below.
Signed by GitHub Actions, verified by PyPI on Sep 18, 2026.
Transparency logRelease files / syswatch_linux-1.0.0-py3-none-any.whl
| Download URL | syswatch_linux-1.0.0-py3-none-any.whl |
|---|---|
| Size | 54.2 kB |
| Tags | Python 3 |
|
SHA-256 checksum How to use checksums |
540ee51f0a4ace753acced1b79ff4f43d0c1ef6e1c41e5eb401993d8d4f1fac1
|
|
BLAKE2b-256 checksum How to use checksums |
45bff59d5d6345829d13872e96314382c886ae6e5cb81895fccb0d7915205898
|
| Upload date | |
|
Uploaded using Trusted Publishing? What is trusted publishing? |
Yes |
| Uploaded via |
twine/7.0.0 CPython/3.13.14
|
Provenance
Provenance describes where a file came from. On PyPI, provenance is shared via attestations, which provide a verifiable record of the build or publishing details. View details, limitations and caveats.
PyPI Publish Attestation
PyPI verified that this artifact, at this checksum, originated from the publisher listed below.
Signed by GitHub Actions, verified by PyPI on Sep 18, 2026.
Transparency log












