
Taraplotlib
A cosy matplotlib styles for tea and cat lovers, inspired by the one and only Tara Murphy, part-time science communicator and professional tea drinker.
taraplotlib (aka tpl) is a quirky little thing that tries to recreate in a plot the feeling of sipping a cup of warm tea in a rainy day.
How did we do it? Let's see some examples!
If we try to plot a line...
x = np.linspace(0, 10, 100)

fig, ax = plt.subplots()
ax.plot(x, x)
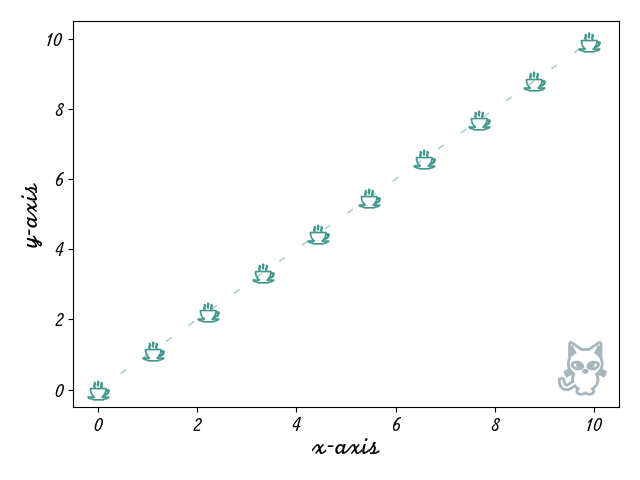
... a line of steaming hot teacups appears! And in a nice pastel color, non of that professional-looking default blue!
Full example available in
taraplotlib/examples/single-line.py
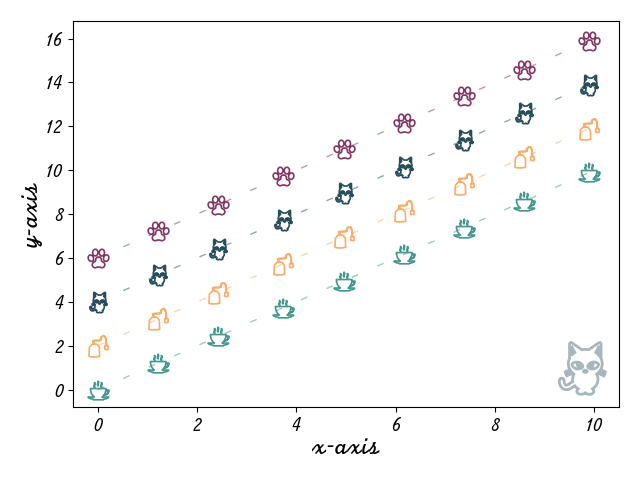
I wonder what happens if I try to plot multiple lines...?
Full example available in
taraplotlib/examples/simple_plot.py
More pastel colors! And more nice little silhouettes! And we haven't even mentioned the cat in the background! That's a plot carrying one heck of a cosy vibe, right?
And to the purists in the room that have noticed, yes, by default tpl plots (cute) markers, with very faint lines. "But what if I have too many data points? Won't the plot get too crowded?", I hear you ask. And to you - you know who you are - I reply that no! With a little matpllotlib dark magic we can make sure everything stays nice and cosy even with loads of data points. However, I can't but wonder why you have so many data points that you think this might be an issue. This is a cosy plotting library, and you are working too hard by the sounds of it! Stop producing so much data and go enjoy a cup of tea and maybe a movie!
But before you go, please don't forget to
add_background(ax, 'cat')
or your favorite between the available images (cat, teacup, teabag, pawprint). You wouldn't want to miss on the cosy good vibes!
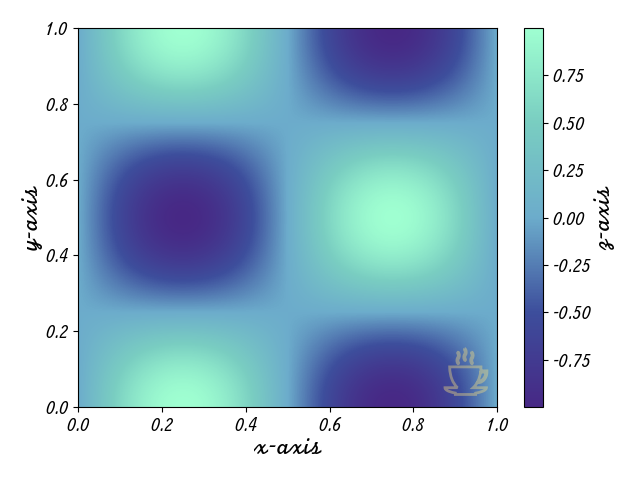
Ok, now imagine that you have a 2D dataset to plot. Let's see what happens...
Full example available in
taraplotlib/examples/2d_plot.py
... what a cosy colormap! None of that harsh purple and yellow in viridis.
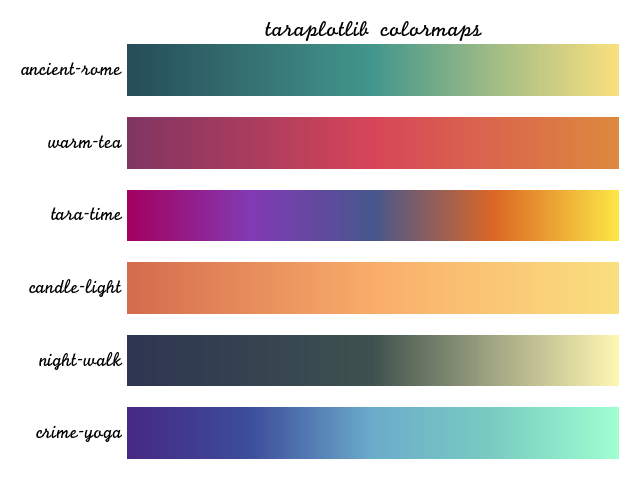
But... does that mean tpl has it's own colormaps? Yes! Here they are in their full glory!
Code available in
taraplotlib/examples/colormaps.py
So, if you are convinced, please don't hesitate to join in the cosy fun of tpl with a simple
pip install .
1 maintainer

Metadata
1 maintainer
Release files for taraplotlib 1.0.0
For a detailed explanation of source distributions (sdists) and built distributions (wheels), please see the package formats documentation.
Source distribution (sdist)
| File | Size | Uploaded | |
|---|---|---|---|
| taraplotlib-1.0.0.tar.gz | 50.1 kB | Details |
Built distribution (wheel)
| File | Interpreter | ABI | Platform | Reset |
|---|---|---|---|---|
| taraplotlib-1.0.0-py3-none-any.whl | Python 3 | none | any | Details |
Total release size: 89.5 kB
Release files / taraplotlib-1.0.0.tar.gz
| Download URL | taraplotlib-1.0.0.tar.gz |
|---|---|
| Size | 50.1 kB |
| Tags | Source |
|
SHA-256 checksum How to use checksums |
a3a0cac2426503676b4fc4e57957592ac38b77f1e0f0d27c91027f8b71cb6067
|
|
BLAKE2b-256 checksum How to use checksums |
292d83b6e4a46dd9776e5fe5c2c31ceb01a54b4a35b41c62e8e2f411d8a560ce
|
| Upload date | |
|
Uploaded using Trusted Publishing? What is trusted publishing? |
No |
| Uploaded via |
twine/5.1.1 CPython/3.12.7
|
Release files / taraplotlib-1.0.0-py3-none-any.whl
| Download URL | taraplotlib-1.0.0-py3-none-any.whl |
|---|---|
| Size | 39.3 kB |
| Tags | Python 3 |
|
SHA-256 checksum How to use checksums |
bc745b61167518d4c93bb2e8295984225360d3985794a814b7b6687a8cf3003d
|
|
BLAKE2b-256 checksum How to use checksums |
50e8902d177531b936b3859a723a6350a6e274656ed06b7e2dd2b71020d1d470
|
| Upload date | |
|
Uploaded using Trusted Publishing? What is trusted publishing? |
No |
| Uploaded via |
twine/5.1.1 CPython/3.12.7
|













